Cold Email CTA Benchmarks: 2026 Performance Data
Industry data shows that low-friction CTAs generate 2-3x more responses than aggressive asks. Discover the benchmarks for effective cold email calls-to-action.
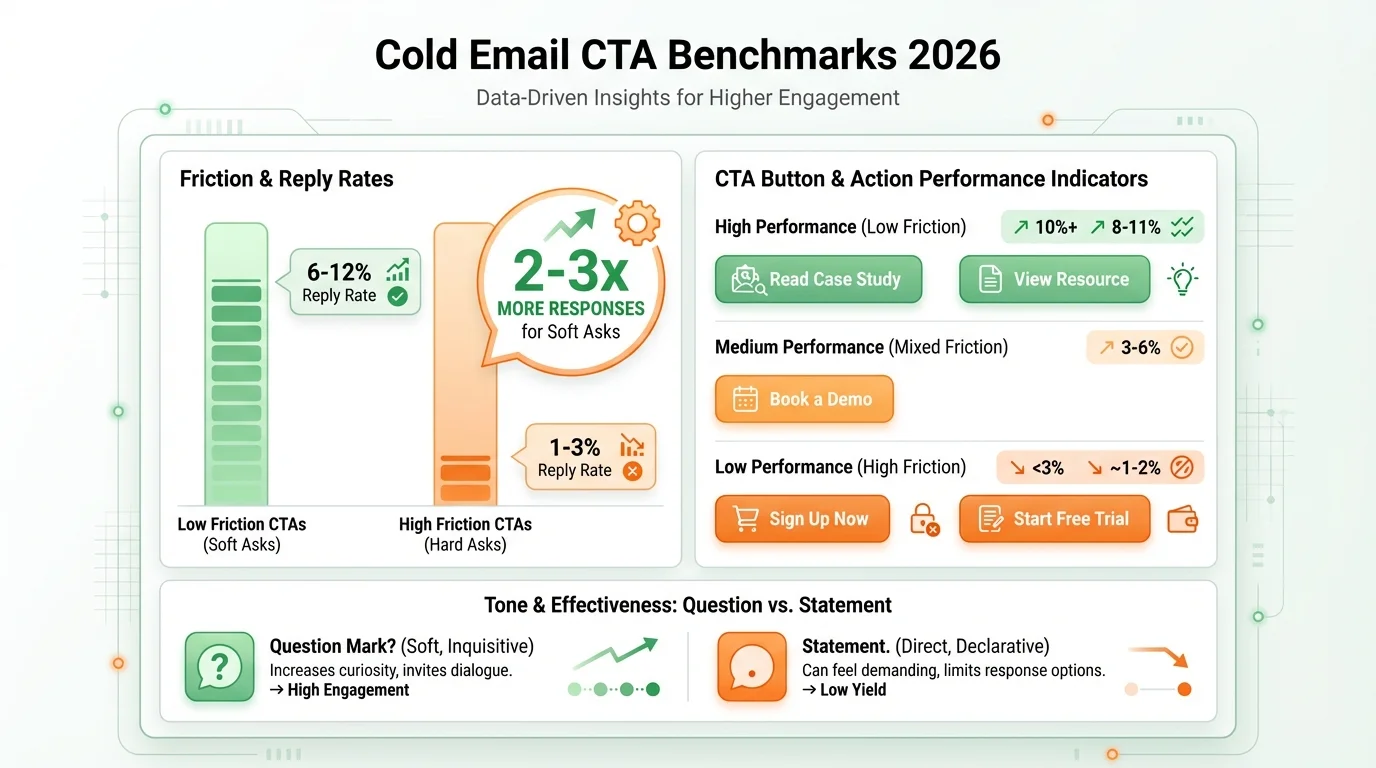
Low-friction CTAs like simple questions generate 6-12% reply rates, while aggressive asks like demo requests achieve only 2-5%. Industry data shows question-format CTAs outperform statements by 1-3 percentage points. Single, clear CTAs placed at email end after establishing value consistently beat multiple options or assumptive closes. The friction-quality tradeoff matters: lower friction increases volume but may require more qualification.
Key takeaways
- Low-friction CTAs generate 2-3x more responses than high-commitment asks, with simple questions achieving 6-12% reply rates versus 1-3% for trial signups.
- Question-format CTAs outperform direct statements by 1-3 percentage points, with "Would a quick call make sense?" achieving 5-9% reply rates compared to 3-6% for "Let's schedule a call."
- Single clear CTAs produce 5-8% reply rates, while emails with three or more options drop to 3-5% due to decision paralysis.
- "Quick question" phrases generate 6-10% reply rates, making them the highest-performing CTA wording across B2B cold email campaigns.
- First email interest checks achieve 3-6% reply rates, while breakup emails with permission-based CTAs recover 2-4% responses from non-responders.
Reviewed and updated September 15, 2026
Cold Email CTA Benchmarks: 2026 Performance Data
Your call-to-action (CTA) determines whether a prospect who reads your email takes the next step. Industry data consistently shows that the ask you make dramatically affects response rates. Low-friction CTAs generate 2-3x more replies than aggressive asks, while the format and placement of your CTA further influence performance.
This benchmark report covers the performance data for different CTA types, formats, and approaches. Understanding these benchmarks helps you craft asks that convert readers into responders.
About This Data
The benchmarks presented in this report are compiled from publicly available industry research, aggregated data from sales engagement platforms, and typical ranges observed across B2B cold email campaigns. These figures represent industry estimates and general ranges rather than definitive standards. Your actual results will vary based on your specific industry, target audience, and overall email quality.
We recommend using these benchmarks as directional guidance while testing CTA variations for your specific audience.
CTA Type Benchmarks
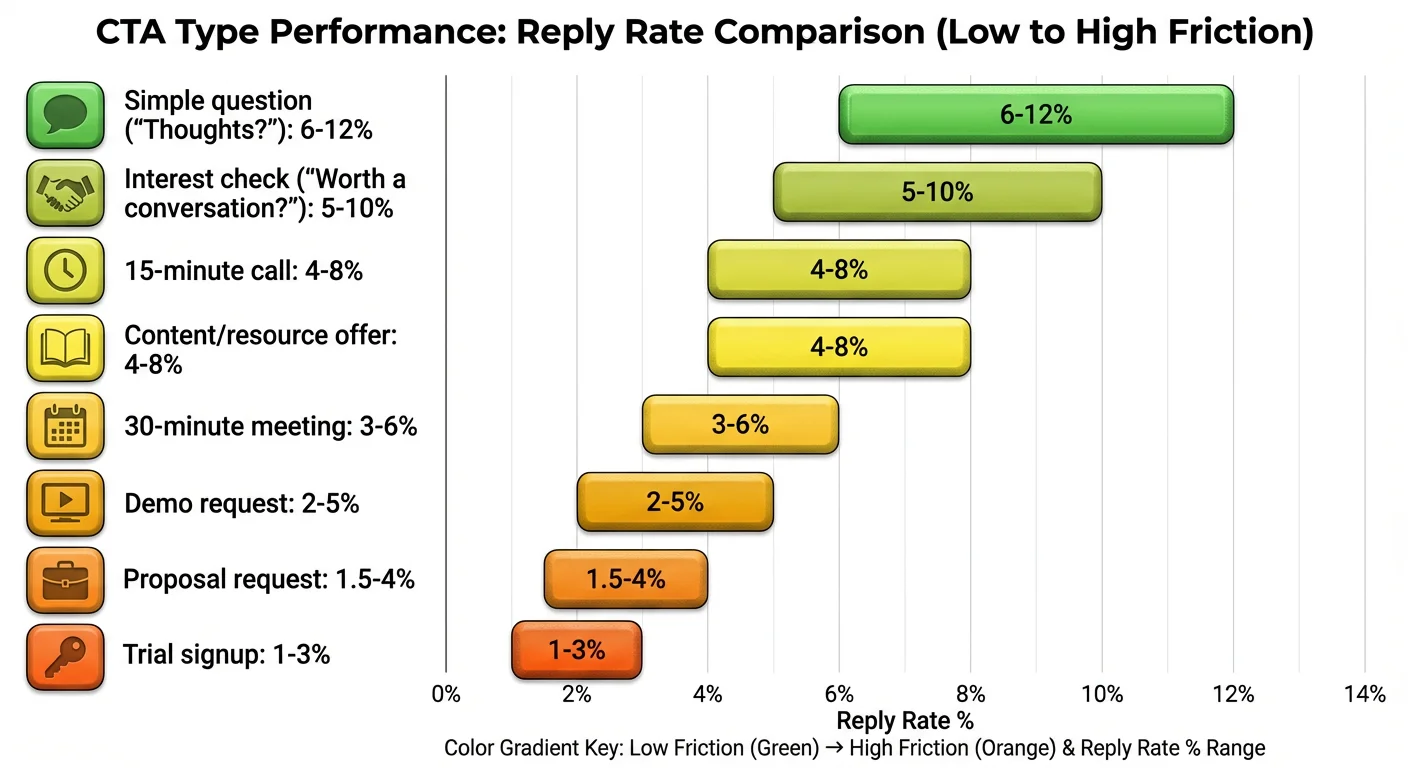
Different types of asks produce dramatically different response rates.
CTA Performance by Type
| CTA Type | Typical Reply Rate | Conversion Quality |
|---|---|---|
| Simple question/advice ask | 6% - 12% | Variable |
| Interest check ("worth a conversation?") | 5% - 10% | Good |
| 15-minute call | 4% - 8% | Good |
| 30-minute meeting | 3% - 6% | Higher commitment |
| Demo request | 2% - 5% | High intent |
| Proposal/quote request | 1.5% - 4% | Highest intent |
| Content/resource offer | 4% - 8% | Lower intent |
| Trial signup | 1% - 3% | Varies widely |
Friction Level Performance
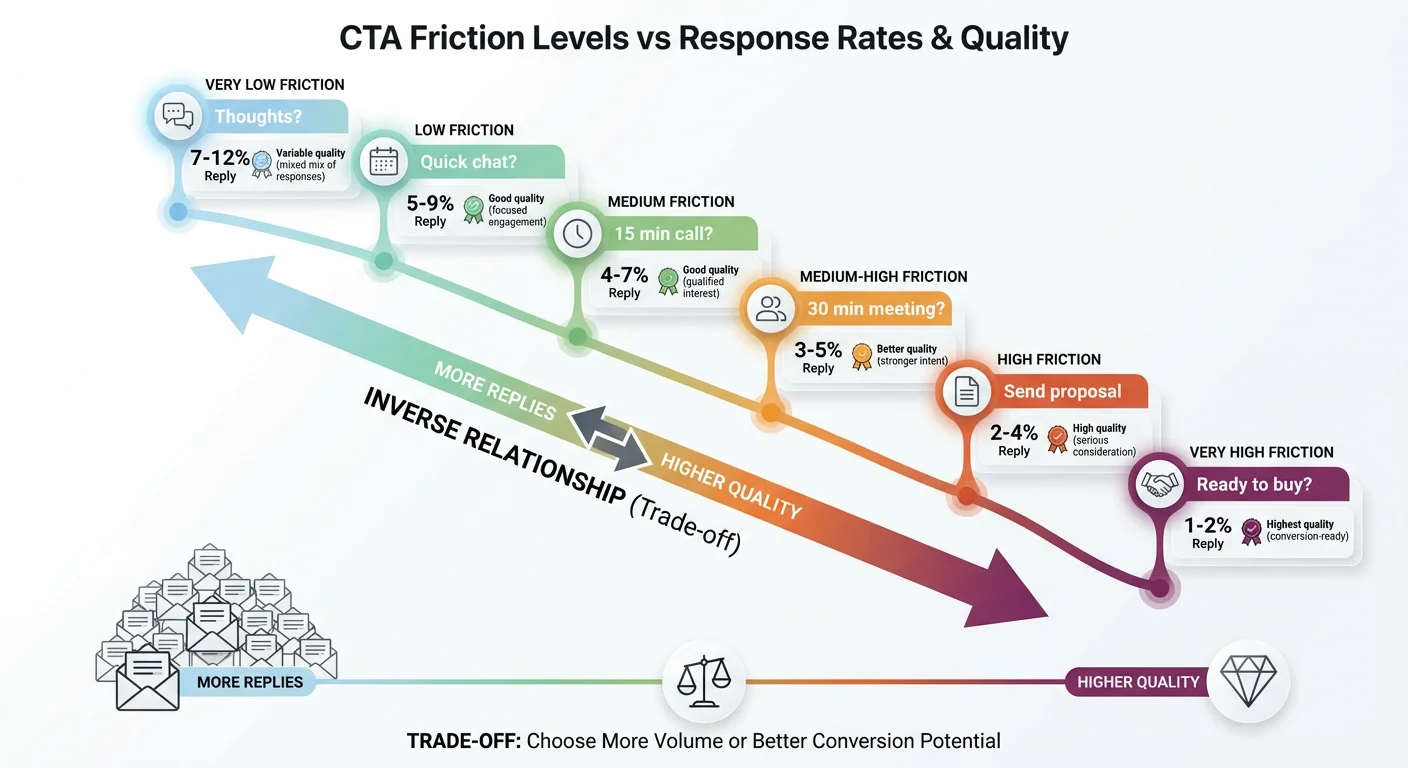
| Friction Level | Example CTA | Reply Rate | Quality |
|---|---|---|---|
| Very Low | "Thoughts?" | 7% - 12% | Variable |
| Low | "Worth a quick chat?" | 5% - 9% | Good |
| Medium | "Open to a 15-min call?" | 4% - 7% | Good |
| Medium-High | "Can we schedule 30 minutes?" | 3% - 5% | Better |
| High | "Let me send over a proposal" | 2% - 4% | High |
| Very High | "Ready to move forward?" | 1% - 2% | Highest |
Lower friction generates more responses but may require additional qualification. Higher friction generates fewer responses but often from more serious prospects.
CTA Format Benchmarks
How you present your CTA affects its effectiveness.
Question vs. Statement Performance
| Format | Reply Rate | Examples |
|---|---|---|
| Question | 5% - 9% | "Would a quick call make sense?" |
| Soft statement | 4% - 7% | "Happy to share more if helpful." |
| Direct statement | 3% - 6% | "Let's schedule a call." |
| Assumptive close | 2% - 5% | "I'll send over some times." |
Questions outperform statements because they invite response and feel less presumptuous.
Single CTA vs. Multiple Options
| Approach | Reply Rate | Clarity |
|---|---|---|
| Single clear CTA | 5% - 8% | Highest |
| Two options | 4% - 7% | Good |
| Three+ options | 3% - 5% | Confusing |
| No clear CTA | 2% - 4% | Poor |
One clear ask performs best. Multiple options create decision paralysis and reduce response rates.
CTA Placement
| Placement | Reply Rate | Reading Pattern |
|---|---|---|
| End of email (standard) | 5% - 8% | Natural conclusion |
| After value proposition | 5% - 7% | Good flow |
| Beginning of email | 3% - 5% | Can feel abrupt |
| P.S. line | 4% - 7% | High visibility |
Placing your CTA at the natural end of your message, after establishing value, yields the best results.
CTA Wording Performance
Specific word choices affect response rates.
High-Performing CTA Phrases
| Phrase | Reply Rate | Why It Works |
|---|---|---|
| "Quick question..." | 6% - 10% | Low friction, curiosity |
| "Worth a 15-minute chat?" | 5% - 8% | Time-bounded, optional |
| "Would it make sense to..." | 4% - 7% | Consultative, respectful |
| "Interested in exploring..." | 4% - 7% | Open-ended, non-pushy |
| "Happy to share more if helpful" | 4% - 6% | Value-focused |
Medium-Performing CTA Phrases
| Phrase | Reply Rate | Notes |
|---|---|---|
| "Let me know your thoughts" | 3% - 6% | Common, neutral |
| "Are you available for a call?" | 3% - 5% | Direct but standard |
| "I'd love to connect" | 3% - 5% | Somewhat generic |
| "Can we schedule time?" | 3% - 5% | Standard ask |
Low-Performing CTA Phrases
| Phrase | Reply Rate | Why It Underperforms |
|---|---|---|
| "Let me know when you're free" | 2% - 4% | Puts burden on recipient |
| "Please reply to this email" | 2% - 3% | Too direct, impersonal |
| "Click here to schedule" | 1% - 3% | High friction |
| "Sign up for a demo" | 1% - 2% | Very high commitment |
| "Buy now" / "Get started" | Below 1% | Not appropriate for cold email |
CTA Performance by Email Position in Sequence
CTA effectiveness varies based on where the email falls in your sequence.
Optimal CTAs by Sequence Position
| Position | Best CTA Type | Reply Rate |
|---|---|---|
| Email 1 | Question/interest check | 3% - 6% |
| Email 2 | Value offer + soft ask | 2% - 4% |
| Email 3 | Direct meeting request | 1.5% - 3% |
| Email 4 | New angle + question | 1% - 2.5% |
| Email 5 | Breakup/permission | 1% - 3% |
Breakup Email CTA Performance
| Breakup CTA Style | Reply Rate | Response Type |
|---|---|---|
| "Should I close your file?" | 2% - 4% | Often "yes, close" |
| "Is this a dead end?" | 2% - 3.5% | Mixed |
| "One last thing before I go..." | 1.5% - 3% | Can reopen conversation |
| "Circling back one final time" | 1% - 2.5% | Variable |
Breakup emails often generate surprisingly high response rates by creating urgency.
Industry-Specific CTA Benchmarks
Different industries respond to different CTA approaches.
Technology and SaaS
| CTA Type | Performance |
|---|---|
| "Quick call to discuss [tech challenge]?" | 5% - 8% |
| "Want to see how [integration] works?" | 4% - 7% |
| "Interested in a quick demo?" | 3% - 6% |
| "Can I send over some resources?" | 4% - 6% |
Tech buyers respond well to product-focused and educational CTAs.
Professional Services
| CTA Type | Performance |
|---|---|
| "Worth a brief conversation?" | 6% - 10% |
| "Happy to share how we helped [similar firm]" | 5% - 8% |
| "Interested in exchanging ideas?" | 5% - 8% |
| "Can I share a relevant case study?" | 4% - 7% |
Professional services buyers prefer relationship-focused CTAs.
Healthcare
| CTA Type | Performance |
|---|---|
| "Worth discussing how this fits your compliance needs?" | 4% - 7% |
| "Interested in seeing the clinical evidence?" | 4% - 6% |
| "Can we explore the implementation process?" | 3% - 6% |
Healthcare buyers need CTAs that acknowledge regulatory and evidence requirements.
Financial Services
| CTA Type | Performance |
|---|---|
| "Worth exploring how peers are handling this?" | 4% - 7% |
| "Interested in the compliance considerations?" | 4% - 6% |
| "Can I share how [similar institution] approached this?" | 4% - 6% |
Financial services buyers respond to peer validation and compliance awareness.
CTA Performance by Seniority
Target seniority affects optimal CTA approach.
C-Suite CTAs
| Approach | Performance | Notes |
|---|---|---|
| Strategic value question | 4% - 8% | Respect time constraints |
| Brief exploratory chat | 3% - 6% | Low commitment |
| Peer company reference | 4% - 7% | Social proof matters |
| Long demo request | 1% - 2% | Too much commitment |
Executives respond to time-efficient, high-level CTAs.
VP/Director CTAs
| Approach | Performance | Notes |
|---|---|---|
| Initiative-focused question | 5% - 8% | Aligned with their goals |
| Metric/ROI conversation | 4% - 7% | Results-oriented |
| 15-30 minute call | 4% - 6% | Reasonable ask |
Mid-level leaders respond to CTAs connected to their initiatives and metrics.
Manager/IC CTAs
| Approach | Performance | Notes |
|---|---|---|
| Problem-solution exploration | 5% - 9% | Practical focus |
| Demo or walkthrough | 4% - 7% | Hands-on interest |
| Resource or content offer | 5% - 8% | Educational value |
Individual contributors respond to practical, educational CTAs.
Calendar Link Performance
Including calendar links in CTAs affects conversion rates.
Calendar Link Impact
| Approach | Reply Rate | Meeting Conversion |
|---|---|---|
| No calendar link | 5% - 8% | Requires follow-up |
| Calendar link included | 4% - 7% | Higher conversion |
| Calendar link + text option | 5% - 8% | Best of both |
Calendar Link Best Practices
| Practice | Impact |
|---|---|
| Offer times, link as option | Maintains personal feel |
| Link only, no times | Can feel impersonal |
| Specific times + fallback link | Most effective |
Example: "Would Tuesday at 2pm or Wednesday at 10am work? If not, grab whatever time suits you here: [link]"
CTA Testing Benchmarks
A/B testing CTAs reveals actionable performance differences.
Typical Test Results
| Test Variable | Performance Variation |
|---|---|
| Question vs. statement | 15% - 35% difference |
| High vs. low friction | 40% - 100% difference |
| Specific vs. generic | 20% - 40% difference |
| Time-bounded vs. open | 10% - 25% difference |
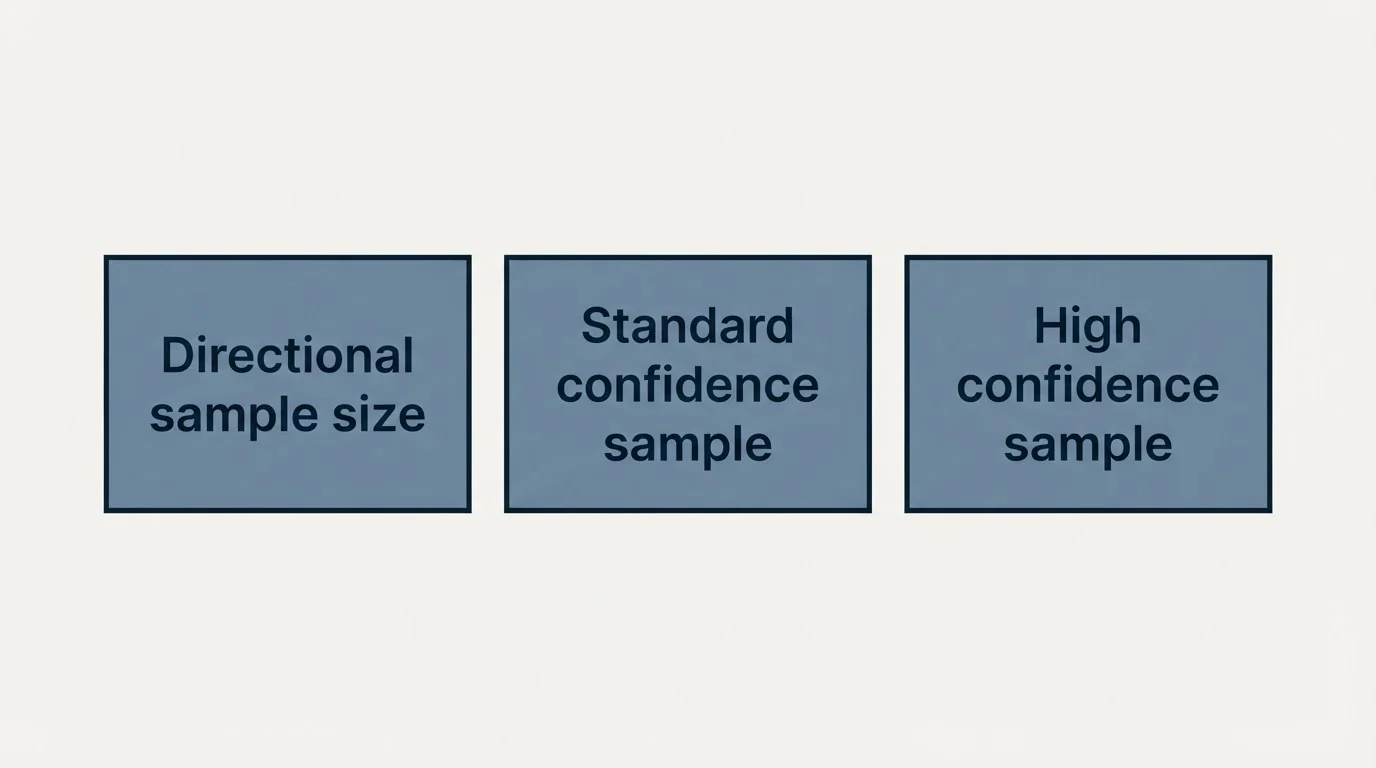
Minimum Sample Sizes
| Confidence Level | Sample per Variant |
|---|---|
| Directional | 100+ |
| Standard confidence | 250+ |
| High confidence | 500+ |
Multiple CTA Strategies
Some campaigns benefit from varied CTAs across the sequence.
CTA Progression Strategy
| CTA Approach | Purpose | |
|---|---|---|
| 1 | Soft question ("thoughts?") | Open dialogue |
| 2 | Value offer ("happy to share") | Demonstrate value |
| 3 | Direct ask ("15 minutes?") | Request meeting |
| 4 | Alternative angle ("different thought") | New entry point |
| 5 | Breakup ("should I close?") | Create urgency |
CTA Escalation
| Stage | CTA Level | Example |
|---|---|---|
| Initial | Very soft | "Worth exploring?" |
| Follow-up | Soft | "Quick chat?" |
| Later | Direct | "Let's schedule time" |
| Final | Urgent | "Last chance to connect" |
Gradually increasing CTA directness through the sequence can improve overall conversion.
Avoiding CTA Mistakes
Common CTA Errors
| Mistake | Impact | Solution |
|---|---|---|
| No clear CTA | -40% replies | Always include specific ask |
| Multiple asks | -25% replies | One CTA per email |
| Too aggressive early | -30% replies | Match friction to stage |
| Too vague | -20% replies | Be specific about next step |
| Assuming agreement | -15% replies | Ask, don't tell |
CTA Red Flags
| Red Flag | Why It Fails |
|---|---|
| "Let me know" (alone) | No clear action |
| "Feel free to reach out" | Passive, low conversion |
| Long paragraph explaining CTA | Overthinking, loses clarity |
| Multiple calendar links | Decision overload |
| "ASAP" or urgent language | Pressure, inauthentic |
Measuring CTA Effectiveness
Key Metrics
| Metric | Formula | Benchmark |
|---|---|---|
| Reply rate | Replies / Delivered | 4% - 8% |
| Positive reply rate | Positive replies / Delivered | 2% - 5% |
| Meeting conversion | Meetings / Positive replies | 50% - 70% |
| CTA click rate (if link) | Clicks / Opens | 2% - 5% |
CTA Performance Tracking
Track CTA effectiveness by:
- Reply rate per CTA type
- Positive vs. negative reply ratio
- Meeting conversion rate
- Sequence position performance
CTA Strategy Framework
The Effective CTA Formula
[Low-friction question] + [Time boundary] + [Value hint]
Examples:
- "Worth a quick 15-minute chat to explore if [value]?"
- "Would it make sense to spend 15 minutes discussing [specific benefit]?"
- "Interested in a brief call to see if [outcome] is achievable?"
CTA Selection Guide
| Situation | Best CTA Type |
|---|---|
| Cold first touch | Question, very soft |
| Warm follow-up | Interest check |
| Engaged prospect | Direct meeting ask |
| Late sequence | Breakup/urgency |
| High-value target | Time-bounded, specific value |
Optimizing Your CTAs
Your CTA is where email readers become responders. The benchmarks clearly show that thoughtful, low-friction asks outperform aggressive or unclear alternatives. Testing and iteration will help you find the optimal CTA approach for your specific audience.
If you want to improve your CTA performance or need help designing high-converting cold email campaigns, our team specializes in building effective outreach programs for B2B companies.
Get a free campaign audit and see how your current CTA performance compares to top performers. We will identify specific opportunities to improve your asks for better response and meeting conversion rates.
Related Reading
Frequently asked questions.
Frequently asked questions- What type of call-to-action gets the highest response rate in cold emails?
- Simple questions and advice asks generate the highest response rates at 6-12%, followed by interest checks at 5-10%. These low-friction CTAs outperform aggressive asks like demo requests (2-5%) or trial signups (1-3%) by 2-3x. However, lower friction may attract lower-quality responses requiring additional qualification, while higher-friction CTAs generate fewer but more serious prospects.
- Should I use questions or statements for my cold email CTA?
- Questions consistently outperform statements, generating 5-9% reply rates compared to 3-6% for direct statements. CTAs like "Would a quick call make sense?" invite response and feel less presumptuous than "Let's schedule a call." Soft statements like "Happy to share more if helpful" perform better than direct or assumptive statements but still trail question-format CTAs by 1-2 percentage points.
- How many CTAs should I include in a cold email?
- One clear CTA performs best, generating 5-8% reply rates. Adding a second option drops performance to 4-7%, while three or more options fall to 3-5% due to decision paralysis. Emails with no clear CTA achieve only 2-4% responses. The single-CTA approach provides clarity and removes friction from the decision-making process.
- Where should I place the CTA in my cold email?
- Place your CTA at the natural end of your email after establishing value, which generates 5-8% reply rates. CTAs positioned after the value proposition achieve 5-7%. Beginning-of-email CTAs underperform at 3-5% because they feel abrupt. P.S. lines achieve 4-7% due to high visibility but work best as reinforcement rather than the primary ask.
- Does CTA effectiveness change based on email sequence position?
- Yes, optimal CTAs vary by sequence position. First emails with questions or interest checks achieve 3-6% reply rates. By email three, direct meeting requests drop to 1.5-3%. Breakup emails in position five with permission-based CTAs like "Should I close your file?" recover 2-4% responses from previously non-responsive prospects, though many replies are "yes, close" rather than interest signals.
About the author.

Hosun Chung is COO at RevenueFlow, which builds and operates outbound revenue engines for B2B companies. Previously at Gleacher Shacklock LLP. Studied at London School of Economics.
Hosun Chung · COO
Connect on LinkedIn →Explore more.
Ready to scale your outreach?
We build GTM engines that book real meetings. See the receipts.
Related articles.
Cold Email Spam Rate Benchmarks: 2026 Performance Data
Industry standards require keeping spam complaint rates below 0.1% to maintain sender reputation. Learn the benchmarks and strategies to protect your cold email deliverability.
Cold Email Follow-Up Benchmarks: 2026 Performance Data
The follow-up benchmarks kept intact and read against their own definitions, plus why RevenueFlow sends one message per campaign instead.
Cold Email Bounce Rate Benchmarks: 2026 Performance Data
A 3.04% platform bounce rate held 1.27% true hard bounces, 2.38% with blocks included, and 12.6% delay notices. What low bounce email data is made of.
Cold Email Subject Line Benchmarks: 2026 Performance Data
Industry data reveals that subject lines determine 35-50% of open rate variation. Discover the benchmarks for length, personalization, and format that drive the highest engagement.
Cold Email Personalization Benchmarks: 2026 Performance Data
LeadMagic, Cognism, Explorium and others sell funding and competitor signals. What published data ties to higher reply rates, and how to turn a signal into a line.
Cold Email Sequence Benchmarks: 2026 Performance Data
Every industry sequence figure, kept intact and read honestly: the opening message produces 30-40% of replies, and here is what the rest of them cost.