Sales Analysis: The Question Comes Before the Dashboard
Sales analysis is the systematic reading of a team's own sales records to answer a question named before the data is opened. Four questions cover almost all of it: what happened, why, where deals stop, and what the next period will produce. Each needs a different record, and the binding constraint is sample size: a B2B pipeline holds few outcomes.
Key takeaways
- A sales analysis starts with the decision that depends on the answer; where nothing would change either way, the work is a report and can stop.
- Four questions cover almost all of it, what happened, why, where deals stop and what comes next, and each reads a different record.
- Count the closed deals in the smallest cell before comparing anything: under about thirty, report a direction and a caveat, never a ranking.
- In outbound, opportunities against attended meetings is the only ratio in the chain that tests the target list and not the copy.
Sales analysis is the systematic reading of a team's own sales records to answer a stated question about how the selling is going: what closed, why deals were lost, where opportunities stop moving, which segments convert, and what the coming period is likely to produce. It is a practice rather than a report, and the distinguishing feature is that a question exists before the data is opened.
That sounds like a technicality and it is the whole difference between analysis and decoration. A dashboard assembled without a question shows whatever the system finds easy to count, which is activity, and activity is the one thing nobody needs a system to tell them about.
The four questions, and the record each one needs
Useful sales analysis divides into four questions. They need different records, they fail differently, and running them together is why so much of this work produces a chart and no decision.
What happened. Bookings, by segment, product and period, against what was expected. This is descriptive, it needs only closed records, and it is the only one of the four that is close to being a fact. Its failure mode is being mistaken for the other three.
Why it happened. Win and loss reasons, collected from the buyer where possible rather than from the seller's guess. This is the highest-value and least-collected record in most companies, and where it exists it is often the seller's guess, and the sampling problem in it is severe enough to have its own argument, set out in win/loss analysis.
Where it stops. Stage-by-stage conversion and time in stage, which localise a loss to a point in the process. A team with an acceptable close rate and a poor first-meeting-to-opportunity rate has a targeting problem being read as a closing problem.
What happens next. The forecast, built from open opportunities and a judgment about which land. It fails when that judgment goes unstated, because a forecast nobody wrote the reasoning for cannot be checked afterwards. The families of method and what each one trusts are compared in sales forecasting methods.
| Question | The record it needs | How it fails |
|---|---|---|
| What happened | Closed records: bookings by segment, product and period, against what was expected | It gets mistaken for the other three |
| Why it happened | Win and loss reasons, collected from the buyer where possible | The record was never collected, or it is the seller's guess |
| Where it stops | Stage-by-stage conversion and time in stage | A targeting problem gets read as a closing problem |
| What happens next | Open opportunities and a judgment about which land | The judgment goes unstated, so the forecast cannot be checked |
How to do a sales analysis: a worked example
A sales analysis is done in five moves: write down the decision, pick one of the four questions, count the sample in the smallest cell you mean to compare, state and date the definitions, then read the result as a distribution and write the answer as one sentence somebody can act on. The work is mostly in the first three, and they happen before a chart exists.
The example that follows is illustrative. The company and every number in it are invented to show the moves.
A head of sales at a company closing two hundred deals a year believes the mid-market segment converts badly, and is considering moving two sellers out of it.
- The decision. Move the two sellers, or leave them. If the analysis could not change that, it would not be worth running.
- The question. Where it stops. The suspicion is about conversion, so the record is stage-by-stage conversion by segment. Bookings by segment would only say that mid-market is smaller, which everybody already knows.
- The sample. Mid-market closed fifty of the two hundred deals. Fifty carries a comparison between segments. Split across five sellers it is ten each, which carries nothing, so the comparison between sellers is dropped before anybody looks at it.
- The definitions. The rule for what enters the pipeline was tightened in the spring. Only opportunities created since that change are compared, and the write-up says so.
- The reading. Mid-market opportunities close at about the same rate as the rest. The gap sits earlier, between the first meeting and an opportunity being created, and it shows across most sellers in the segment.
The sentence that comes out is this: mid-market loses deals between first meeting and opportunity, on a sample that supports a direction and no more, so the sellers stay and the account selection for that segment gets reviewed. Moving two closers would have changed nothing about a problem that sits in the targeting, and only the third question could show that.
Notice what the example never needed: a dashboard, a model, or more data than the CRM already held. It needed a decision written first and one comparison abandoned because the cell was too small.
Why it matters: the sample is smaller than it looks
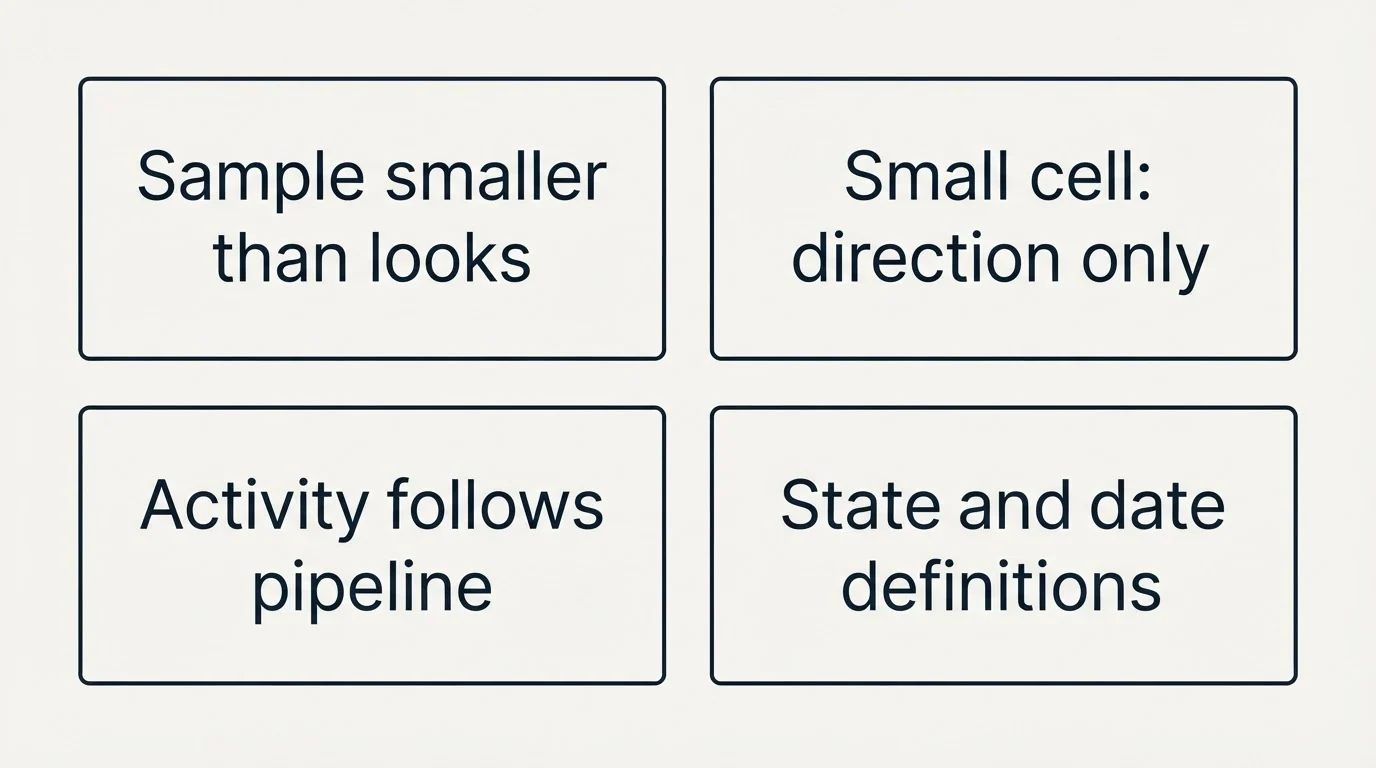
The constraint nobody plans around is that B2B sales datasets are tiny.
A team closing two hundred deals a year has two hundred outcomes. Split them by segment, by product and by seller and the cells fall into single figures fast. As illustrative arithmetic, with even splits: four segments leave fifty deals in a cell, three products inside each segment leave about seventeen, and five sellers inside each of those leave three or four. At that size the gap between a weak cell and a strong one can be three deals, and three deals is the width of ordinary variation. The analysis that follows is a comparison of noise, presented with the confidence a percentage always carries.
This has a practical consequence that is worth stating as a rule. Count the closed deals in the smallest cell you intend to compare, before you compare anything. Where that count is under about thirty, the honest output is a direction and a caveat rather than a ranking, and the correct next step is usually to collect more of the record rather than to slice the existing one harder.
The second structural problem is confounding, and activity data is where it bites. Sellers who send more emails tend to close more deals. The reading that sending more emails causes closing is available immediately and is usually wrong, because the sellers with more open opportunities have more people to email, so the activity is a consequence of the pipeline rather than a cause of it. Which numbers a development team genuinely controls, and which are inherited, is set out in SDR metrics.
The third is that definitions move. Tightening what is allowed into the pipeline raises conversion and lowers coverage without anybody selling differently. Any comparison across periods needs the entry definition stated and dated, or the trend is an edit to a rule.
Where the term misleads
A dashboard is not an analysis. A dashboard answers a question repeatedly once somebody has decided which question is worth answering repeatedly. Built first, it becomes an inventory of whatever the CRM exposes, and the volume of it is what makes the useful numbers hard to find.
Averages describe nobody. A team mean is usually one or two strong sellers and a long tail, and coaching the mean helps neither group. The distribution and the spread between the best and the median carry the information the average removes.
More data does not fix a missing record. The reason a loss happened is not in the CRM unless somebody asked the buyer and typed it in. No amount of analysis over deal amounts and stage timestamps recovers it, and a model applied to the same records produces a more confident version of the same gap.
The analysis is only as current as the process it describes. A conversion rate measured across the last four quarters describes a pipeline that ran under whatever entry rule, pricing and territory design were in force at the time. Where any of those changed halfway through, the honest unit is the period since the change, which is usually too short to carry the comparison anybody wanted. That is an uncomfortable answer and it is the correct one, and stating it is more useful than producing a blended figure that describes neither regime.
Retail and B2B sales analysis are different subjects sharing a phrase. Most material written on the term is about retail: sales volume, product mix and seasonality across many small transactions, where the sample is large and the questions are genuinely statistical. A B2B pipeline has a few hundred outcomes and a buying committee behind each one, and the methods do not transfer.
In place before you start
- The decision that depends on the answer is written down first
- The smallest cell being compared has enough closed deals to carry a comparison
- Pipeline entry and qualification definitions are stated and dated
- The result is read as a distribution and not only as a team average
Readings to refuse
- An activity correlation read as a cause, without checking the pipeline behind it
- Segments split again and again until the interesting difference appears
How it is used in outbound
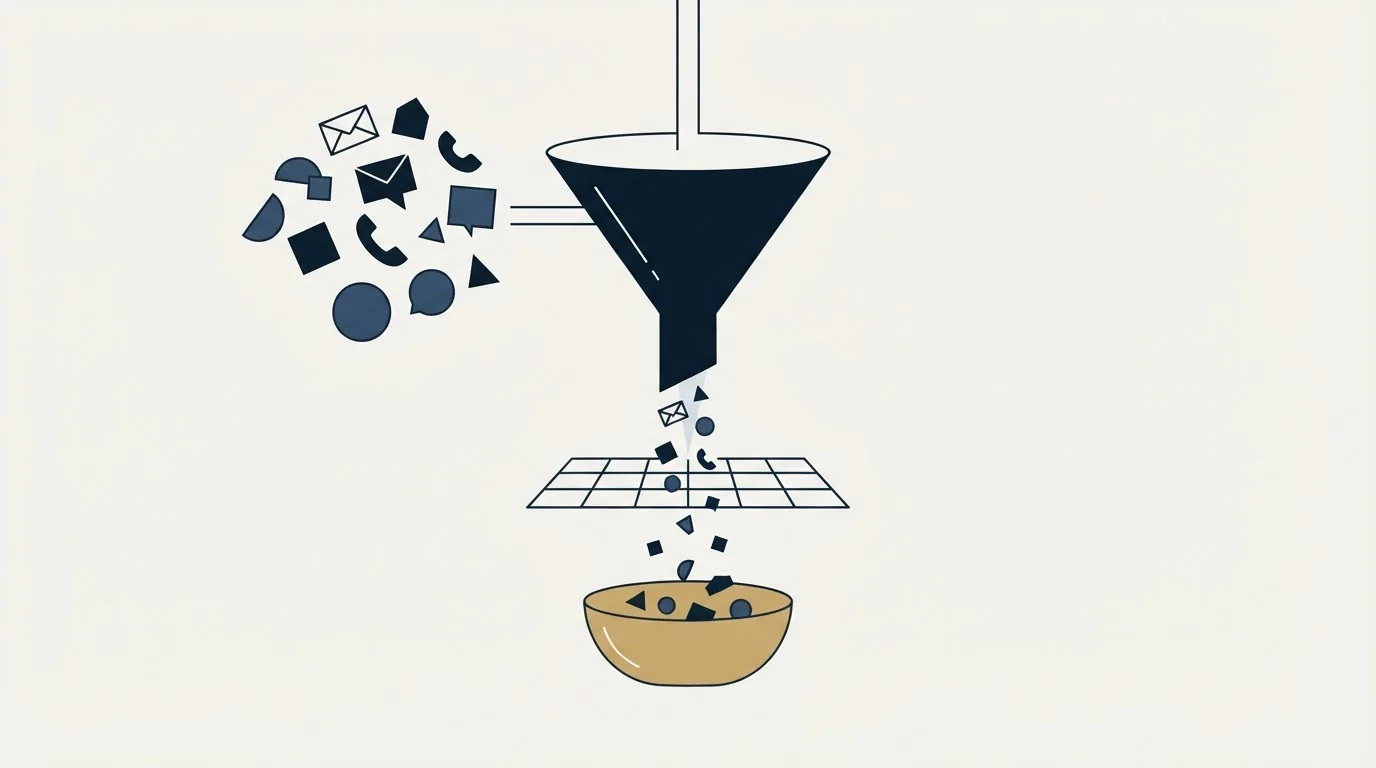
An outbound programme produces the opposite dataset to the rest of sales: thousands of records at the top, a handful of outcomes at the bottom, and a chain of denominators in between that have to be named or nothing is comparable.
The chain runs sent, delivered, replied, positive reply, meeting booked, meeting attended, opportunity created. Each step has a rate, and the useful discipline is knowing which of them tests what.
Reply rate tests the premise: whether the reason for writing landed with the audience. Meeting rate against positive replies tests the offer. Opportunity rate against attended meetings tests the list, and it is the only one of the three that does. A programme reporting a rising reply rate and flat pipeline has usually improved the copy against an audience that was never going to buy, and the analysis that would have shown this is the one nobody runs, because it needs the outcome record to be joined back to the targeting decision.
That join is the single most valuable thing to build, and it costs almost nothing at the start: record why each account was selected, on the account, at the moment it enters the list. Without it every later analysis compares outcomes across accounts chosen for reasons that were never written down.
The second thing worth building early is a stable record of what was actually sent, held against the audience it went to. Campaign copy gets edited, lists get topped up, and a programme reviewed six months later usually cannot reconstruct which version of a message reached which segment. At that point the only available analysis is across everything at once, which averages two campaigns that worked with four that did not and reports the mean as the state of the channel.
Our own practice makes one part of this unusually clean. We send one message per campaign, with no bumps and no thread replies, so a reply rate is the response to a single message rather than to a sequence, and the campaign is a genuine experimental unit: one audience, one premise, one message, one result. A sequenced programme cannot cleanly attribute a reply to any one touch, which is the measurement cost of the cadence rather than an argument against it.
What the recorded conversation adds on top of the structured records, and what it still cannot see, is covered in conversation intelligence.
The short version
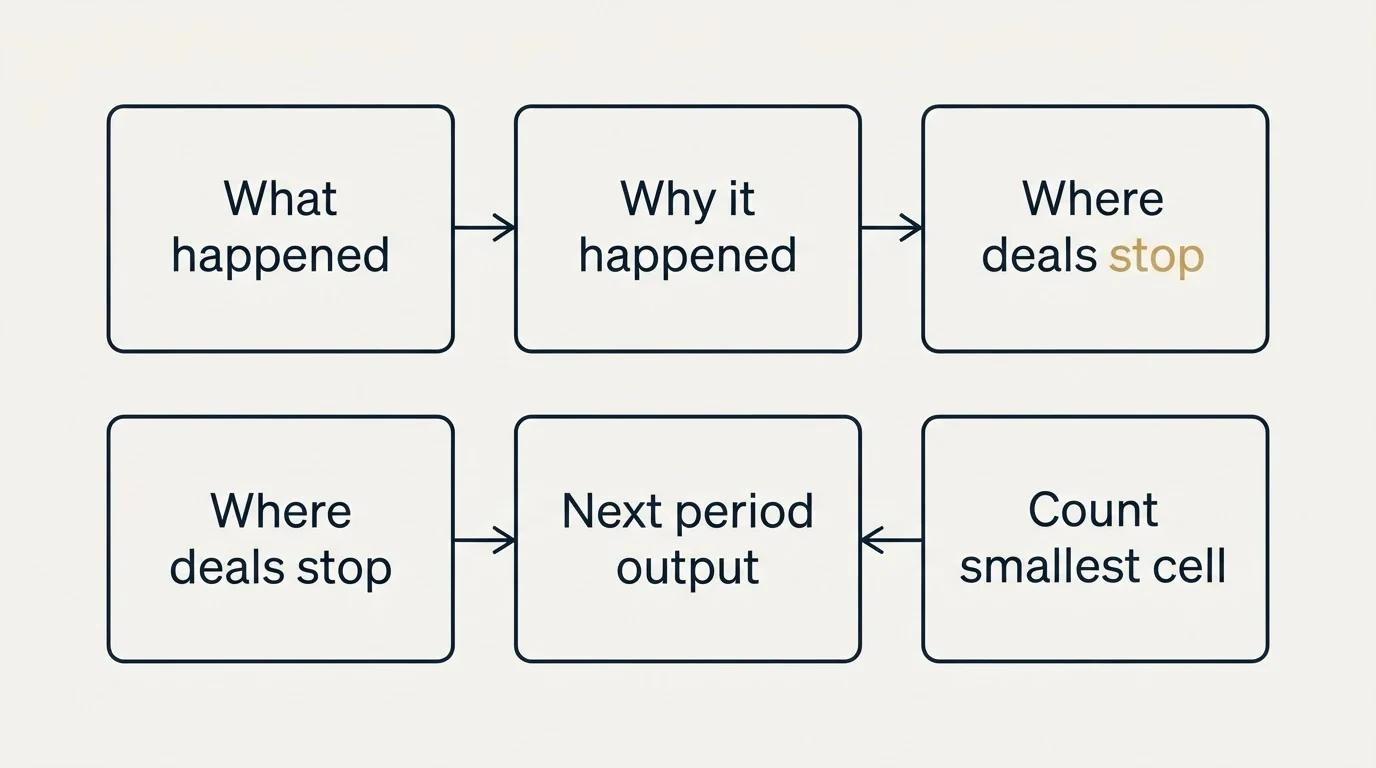
Sales analysis is reading your own sales records to answer a question you named first. Four questions cover almost all of it: what happened, why, where deals stop, and what the next period will produce. Each needs a different record and they do not combine into one chart.
The binding constraint is sample size. Count the closed deals in the smallest cell before comparing anything, because a B2B pipeline holds a few hundred outcomes and splits into single figures quickly. Watch for activity correlations that are consequences of pipeline rather than causes of it, and state and date every definition, or a change in a rule reads as a change in performance.
In outbound, name the denominator at every step and join the outcome back to the reason each account was selected. Opportunities against attended meetings is the ratio that tests the list rather than the copy.
The neighbouring definitions are win rate, whose denominator decides the number, sales velocity, which holds four inputs in one expression, sales forecast, which is the forward question, and pipeline coverage, which says how much was needed.
RevenueFlow runs the front of that chain and reports every denominator in it. See what a first campaign produces.
Frequently asked questions.
Frequently asked questions- What is sales analysis?
- Sales analysis is the systematic reading of a team's own sales records to answer a stated question about how the selling is going: what closed, why deals were lost, where opportunities stop moving, which segments convert, and what the coming period is likely to produce. It is a practice more than a report, because the question exists before the data is opened.
- How do you do a sales analysis?
- In five moves. Write down the decision that depends on the answer. Pick one question: what happened, why, where deals stop, or what comes next. Count the closed deals in the smallest cell you intend to compare. State and date the definitions, such as what entered the pipeline. Then read the result as a distribution and write the answer as one sentence somebody can act on.
- How many closed deals do you need for a sales analysis?
- Enough in the smallest cell you intend to compare, which is a stricter test than the total. A team with two hundred annual closes split by segment, product and seller lands in single figures per cell, where the whole gap between a weak cell and a strong one can be three deals. Under roughly thirty in a cell, report a direction with a caveat.
- What is the difference between sales analysis and a sales dashboard?
- A dashboard answers a question repeatedly, once somebody has decided which question is worth answering repeatedly. Analysis is the work of deciding that. Built the other way round, a dashboard becomes an inventory of whatever the CRM finds easy to count, which is activity, and the volume of it buries the few numbers that would change a decision.