Sales Forecasting Methods: What Each One Trusts
Choosing a forecasting method is choosing which structural problem you will live with. The families, the assumption each hides, and the units error behind most rows.
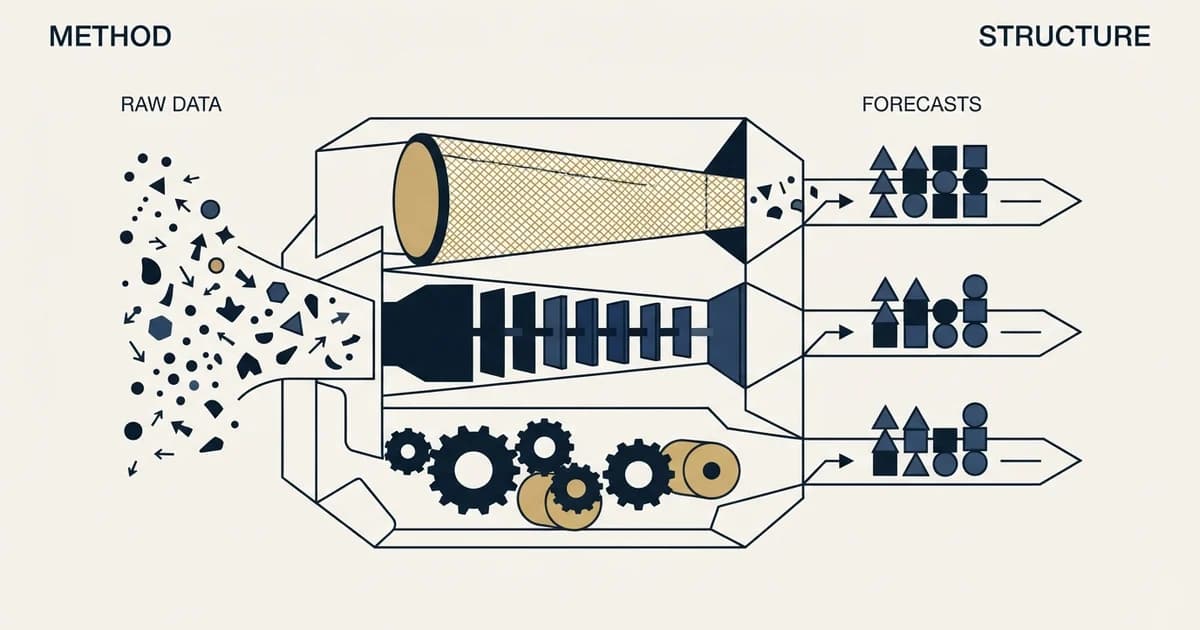
Sales forecasting methods divide into judgement-based, pipeline-weighted, history-based and bottom-up capacity models. Each trusts a different input: the seller, the stage, the base rate, or the capacity arithmetic. The right choice depends on deal volume and how stable the motion is.
Key takeaways
- Stage-weighted forecasting is only valid where stage membership is a buyer-verifiable fact, otherwise the arithmetic multiplies seller effort by a coefficient.
- Commit, weighted and best case are three different quantities, and most forecast disagreements are units errors rather than judgement disputes.
- Measuring accuracy as absolute error in both directions removes the incentive to sandbag, which a total-landed measure rewards.
- Run one primary method and one independent cross-check, then investigate the gap rather than averaging it, because the gap carries the diagnosis.
Reviewed and updated September 2, 2026
Every sales forecast is a claim about the future built from records typed in by the people whose performance the forecast describes. That is not a criticism of anybody's honesty. It is a structural property, and choosing a forecasting method is mostly choosing which part of that problem you are willing to live with.
The published methods divide into a small number of families. Each one takes a different input, each fails in a characteristic way, and the right choice depends more on what your data can support than on which method is currently fashionable.
Forecasting for sales divides into a small number of families, and choosing a sales forecasting method is mostly choosing which structural problem you are willing to live with.
The artifact all of this produces is a forecast report, and its useful content is not the single number at the bottom. A report that shows the same figure by two methods, and names which deals account for the gap between them, is doing the job; one that shows a weighted total alone has hidden its own argument.
Treating this as a forecasting strategy rather than a forecasting method is the more honest framing, because the choice is not really technical: you are deciding which structural error you can live with for a year, and changing it mid-year costs you the comparability that made the old one useful.
The same units problem is what makes a sales forecasting dashboard misleading rather than wrong: a tile labelled Forecast that silently mixes commit, weighted and best-case is three quantities sharing one number, and no dashboard tool resolves that for you.
For sales forecasting methods examples, each method below carries one worked case: the same quarter forecast four ways, so the divergence between methods is visible rather than claimed.
Asked for the four steps to preparing a sales forecast, the honest sequence is: pick the method your data can support, derive its inputs from your own closed deals, run one independent cross-check alongside it, and label every figure as commit, weighted or best case before anyone reads it. Written up as revenue forecasting models the same four families appear under finance labels, and the only real addition is that a finance model reconciles the sales number against a plan the rest of the company is also building.
Method choice gets easier once the output is defined, and the sales forecast definition separates that estimate from the quota and the plan it gets confused with.
The families, and what each one actually trusts
Revenue modeling and revenue forecasting are used interchangeably in most of what is published about them, and where they do come apart the model is the arithmetic that turns assumptions into a number while the forecast is the commitment somebody makes on top of it. The families below are the arithmetic.
- Rep commit: each seller states what will close
- Manager adjustment: leaders discount or add on top
- Requires: that people are calibrated and incentives do not distort
- Fails when: a bad quarter makes optimism cheaper than the alternative
- Stage-weighted: value times a probability attached to each stage
- Requires: stages with exit criteria the buyer produces
- Fails when: stages advance on seller activity, so the arithmetic multiplies effort by a coefficient
- Historical run rate, seasonally adjusted
- Length-of-cycle: deals dated forward from their creation date
- Requires: enough closed deals for a stable rate, and a stable motion
- Fails when: the market, the product or the team changed
A fourth family sits underneath the others in practice: bottom-up capacity modelling, which forecasts from inputs rather than from deals. Number of sellers, productive weeks, meetings each can hold, historical conversion, average deal value. It is the only method that works before there is a pipeline to read, which makes it the right instrument for a new segment or a new team, and the wrong one for a mature motion where the pipeline itself carries better information.
Those inputs stop arriving once a partner owns the first conversation, which is the cost least often modelled when weighing a partner route against a direct one.
Stage-weighted forecasting and the assumption it hides
Weighted pipeline is the most widely used method and the one most often applied without its precondition.
Pipeline forecasting is the usual name for this family, and it is worth hearing the name as a warning rather than as a description, because what it says is that the method trusts the stage.
The arithmetic is simple: multiply each deal's value by a probability attached to its stage, and add them up. The precondition is that stage membership is an observable fact, because the probability is derived from history and history is only a base rate if the population is comparable.
When stages advance on buyer evidence, the coefficient means something real: deals that reached this observable state closed at this frequency. When stages advance on seller activity, the same arithmetic computes the frequency with which reps who did a thing went on to close, which mixes deal quality and rep behaviour into one number and hides both. The output looks identical in either case, which is what makes this failure durable. Pipeline stages that earn their place covers how to write criteria that survive the test.
Stage definitions only carry that meaning when the CRM enforces them, which is the discipline covered in pipeline management practices.
There is a second and quieter assumption. Weighted forecasting is only valid across a large enough population for the probabilities to average out. Applied to one seller with eight open deals, a seventy percent coefficient does not mean seventy percent of the value arrives; it means the largest deal either lands or does not, and the weighted figure will be wrong by a wide margin in whichever direction that goes. Weighted numbers are for territories and above.
The category error in most forecast reviews
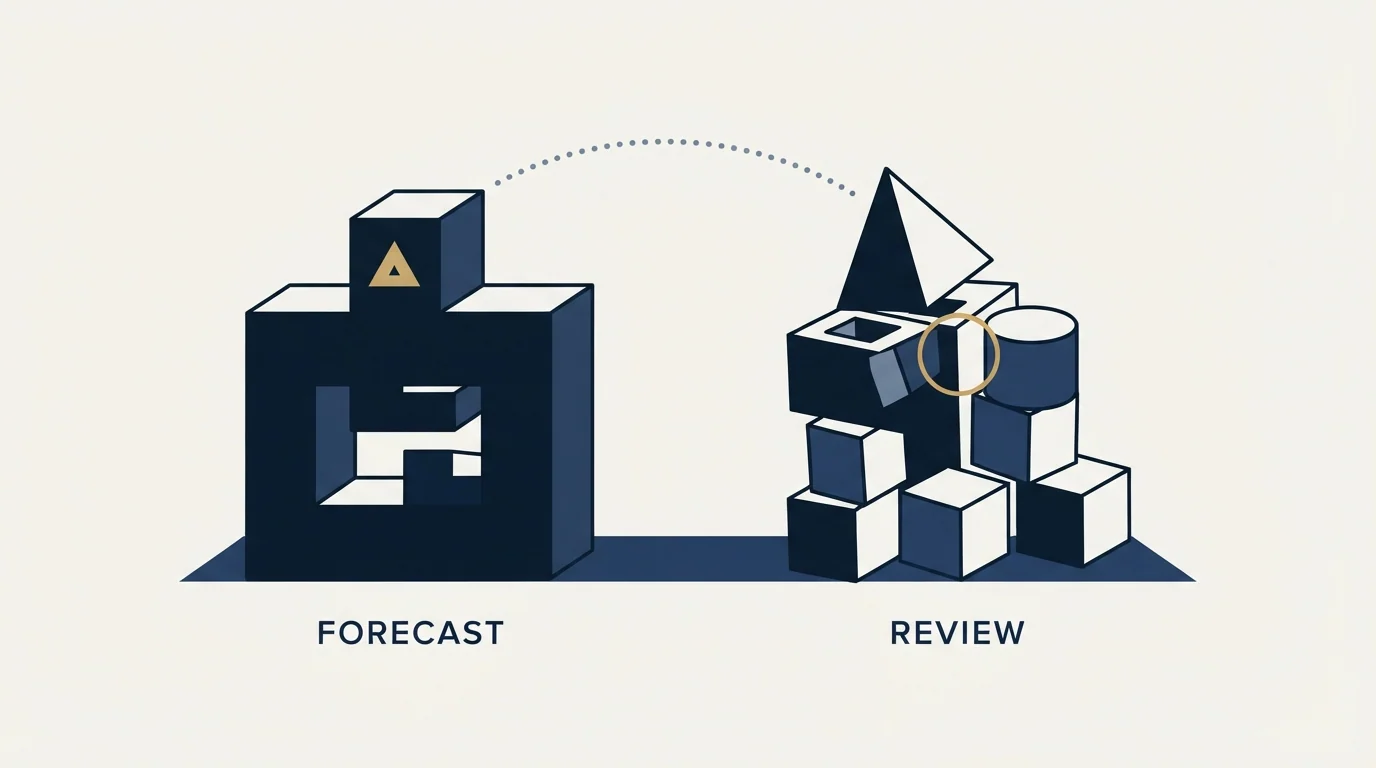
The commonest forecasting failure is not a method problem. It is that two people in the room are forecasting different things and neither notices.
Most of this is actually done in a spreadsheet, and forecasting future sales in Excel is a choice of family rather than a family of its own. A trendline is the time-series family, a stage-weighted column is the pipeline family, and a rep-entered commit column is judgement. The spreadsheet makes none of them more reliable. It just stops recording which one the number came from, which is exactly the condition described above.
A commit number is a promise. A weighted number is an expected value. A best-case number is an upper bound. These are three different quantities, they will never agree, and a review where one person quotes commit while another quotes weighted produces a disagreement that feels like a judgement dispute and is actually a units error.
The same confusion runs one level up in planning, where a goal, a quota and a KPI are three different objects that one revenue number quietly merges.
The fix costs one line in the reporting template: state which quantity every figure is, every time. Teams that do this find that most of their forecasting arguments were arithmetic misunderstandings, and the remaining ones are real and worth having.
Judging accuracy, and the metric that stops the gaming
Forecast accuracy needs its own measurement or the process improves nothing, and the choice of measurement decides what behaviour it rewards.
Measuring only whether the total landed rewards a forecast set low enough to beat, which is why sandbagged forecasts survive so long: they are accurate in the direction nobody complains about. Measuring absolute error in both directions removes that, because a forecast that comes in forty percent over is as wrong as one that comes in forty percent under.
- Yes: Every figure is labelled as commit, weighted or best case
- Yes: Stage probabilities are derived from your own closed deals, not from a template
- Yes: Accuracy is measured as absolute error in both directions
- Yes: Deals with close dates inside a window shorter than the median cycle are flagged
- Yes: The forecast is compared against a bottom-up capacity model at least quarterly
- Yes: Definition changes are dated and shown on the same chart as the metric
- Depends: One deal can move the whole number, and it is named in the review
The last item belongs there as a disclosure rather than as a failure. Concentration is normal in mid-market and enterprise motions, and a forecast whose outcome rests on one opportunity should be presented that way rather than as a smooth aggregate that happens to contain a coin flip.
Choosing a method for your situation
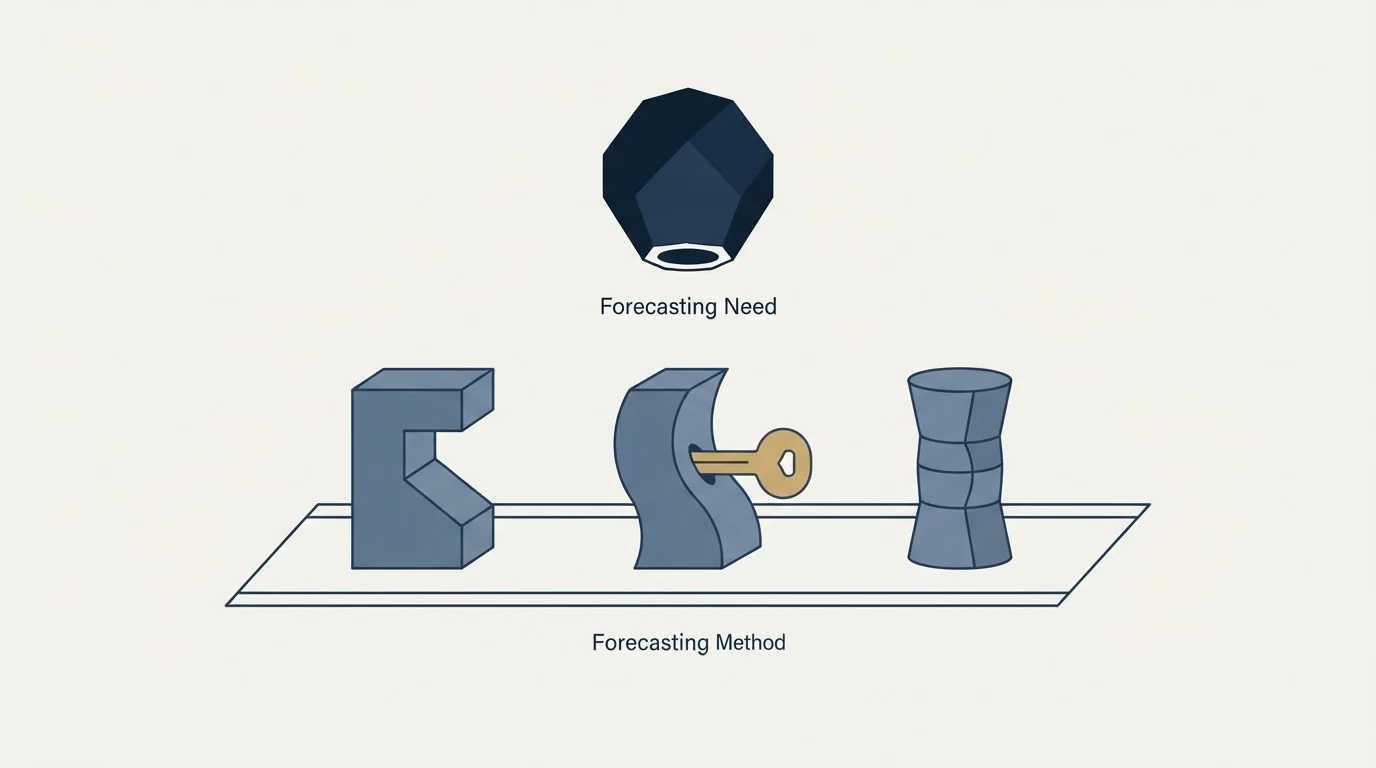
The decision is mostly determined by two facts about your business: how many deals close per period, and how stable the motion is.
High volume with a stable motion favours history-based methods, because the base rate is genuinely a base rate and individual deals cannot distort it. This is where run rate and cycle-length forecasting are at their best, and where weighted pipeline is a reasonable cross-check rather than the primary.
Low volume with large deals favours judgement plus explicit deal-by-deal review, because no statistical method has enough events to work with. The discipline here is making the judgement inspectable rather than arithmetical: what has the buyer actually done, what is still unknown, who has not been met. That is what opportunity-planning methodologies exist to structure, and it is why the acceptance test at the front of the pipeline matters so much in this motion: with twenty deals a quarter, one wrongly accepted opportunity distorts the whole forecast. What qualified has to mean when money depends on it is the version of that definition we hold ourselves to.
A new segment, a new team or a new product favours bottom-up capacity modelling, because the historical rates you would otherwise use describe a motion you are no longer running.
The sales efficiency ratio explains why hiring ahead of production quietly worsens the growth metric finance calls the magic number, which capacity models depend on justifying, The sales efficiency ratio.
Most companies of any size need two of the three at once, and the useful practice is to run the primary method and one independent cross-check, then investigate the gap rather than averaging it. Averaging two forecasts produces a number with no owner and no diagnosis attached.
The gap itself is the most informative output of running two methods, and it is usually thrown away. A weighted pipeline number well above a capacity model means either the pipeline is carrying deals that should have been disqualified or the conversion assumptions in the model are stale, and reading ten deals settles which. A commit number well below the weighted one means sellers are seeing something the stage coefficients do not, and the reasons they give are the most valuable qualitative data a forecasting process generates. Neither of those questions survives an averaging step.
Review frequency matters as much as method. A forecast reviewed weekly against a quarterly target produces twelve chances to notice a gap while there is still time to act on it, and also twelve chances to overreact to noise. The practical compromise most teams settle on is a weekly read of movement and pipeline created, with the full forecast revisited monthly, and the number that goes outside the sales organisation changed only when something real has changed rather than every time it wobbles.
What forecasting cannot do
Two things are routinely asked of a forecast and cannot be delivered by any method.
It cannot create pipeline. A forecast that shows a gap eight weeks before period end is reporting a targeting decision made a full cycle earlier, and the honest response is usually to protect the next period rather than to rescue this one. Compressing outbound into the gap produces rushed targeting and opportunities that inflate coverage without closing. Pipeline coverage works through the timing of that in detail.
It cannot survive a definition change silently. Move the boundary at which an opportunity enters the pipeline and several forecast inputs shift at once, in different directions, with nobody selling any differently. Date the change and put it on the chart.
Where we differ from standard practice

Much of the advice around forecasting assumes an outbound motion run the common way, and since this page sits on our site it is worth naming where ours differs and what that costs.
The standard assumption is that pipeline gaps are closed by increasing touches: more messages per prospect, spread over more weeks, with later ones landing in the same thread. We run one message per campaign, with no bumps and no thread replies. A non-responding audience becomes a new campaign built on a different premise rather than a reminder of the last one. The reasoning is mechanical: a follow-up reaches the population that already saw the message and chose not to answer, which is the population most likely to complain, and the reputation cost lands on the sending domain across everything else it sends. our write-up on why we stopped using follow-ups has the full argument. The forecasting consequence is real and worth stating: pipeline built this way tends to move steadily rather than in spikes, which forecasts better and fills slower.
We are also paid on attended meetings that meet criteria agreed in writing before launch, with budget, timing and authority deliberately outside the definition. That is the same instinct as dating a forecast definition: settle the ruler before anyone reads the number. The full argument, including what it costs us, is in why we stopped using follow-ups.
The short version
Forecasting methods divide into judgement, pipeline-weighted, history-based and bottom-up capacity models. Weighted pipeline is the most used and needs stages whose criteria the buyer produces, or it multiplies seller effort by a coefficient and reports the result as revenue. It also needs a population large enough to average, so it belongs at territory level and above.
Label every figure as commit, weighted or best case, because most forecast arguments are units errors. Measure accuracy as absolute error in both directions so sandbagging is penalised. Run one primary method and one independent cross-check, and investigate the gap rather than averaging it. And accept that no method creates pipeline: a gap found late is a message about next period.
Where the gap is genuinely supply, that is the half we run, on criteria agreed before launch: see what a first campaign produces.
Frequently asked questions.
Frequently asked questions- What is the best sales forecasting method?
- It depends on volume and stability. High deal volume with a steady motion favours history-based methods, because the base rate is genuinely a base rate. Low volume with large deals favours judgement plus inspectable deal review, since no statistical method has enough events. A new team or segment favours bottom-up capacity modelling.
- Why does weighted pipeline forecasting go wrong?
- Because the probability attached to a stage is a historical base rate, and a base rate is only meaningful if stage membership means the same thing every time. Where stages advance on seller activity rather than buyer evidence, the arithmetic computes how often reps who did something went on to close, which mixes deal quality and rep behaviour into one number.
- How should forecast accuracy be measured?
- As absolute error in both directions, not simply whether the total was met. Measuring only the shortfall rewards a forecast set low enough to beat, which is exactly why sandbagged numbers persist. A forecast that lands forty percent over should count as wrong by the same amount as one that lands forty percent under.
- Can forecasting close a pipeline gap?
- No. A gap discovered eight weeks before period end is reporting a targeting decision made a full sales cycle earlier, so the honest response is usually to protect the next period. Compressing outbound into the remaining weeks produces rushed targeting and opportunities that raise coverage without ever closing.
About the author.

B2B cold email experts helping companies generate qualified leads through done-for-you outreach campaigns.
RevenueFlow Team
Explore more.
Ready to scale your outreach?
We build GTM engines that book real meetings. See the receipts.
Related articles.
Win Rate Benchmarks: Which Figures State a Population
A catalogue of the published average sales win rates, sorted by whether the page names the population behind its own number. Most do not.
Sales Cycle Length Benchmarks: What Each Figure Counts
The published B2B sales cycle benchmarks, sorted by what each page says it counted. The same number means two different things in two of them.
Sales Enablement Charters: What the Published Ones Ask For
Six publishers set out what a sales enablement charter should contain. Five describe a document nobody can check, and one writes a definition with inspection in it.
Sales Kickoff Agendas: Five Published, Session by Session
Five publishers print a sales kickoff agenda. They agree on four blocks and disagree on session length, rehearsal and where the agenda comes from.
Sales Comp Plan Design: What the Publishers Prescribe
Four publishers set out how to design a sales compensation plan. Here are their procedures, their components, and which of their ratios carry a population.
B2B Lead Lists for Aviation Companies: Build or Buy
Aviation is one of the few industries whose accounts are published by its regulator, which changes what is worth buying and what is worth downloading yourself.