Win Rate Benchmarks: Which Figures State a Population
A catalogue of the published average sales win rates, sorted by whether the page names the population behind its own number. Most do not.
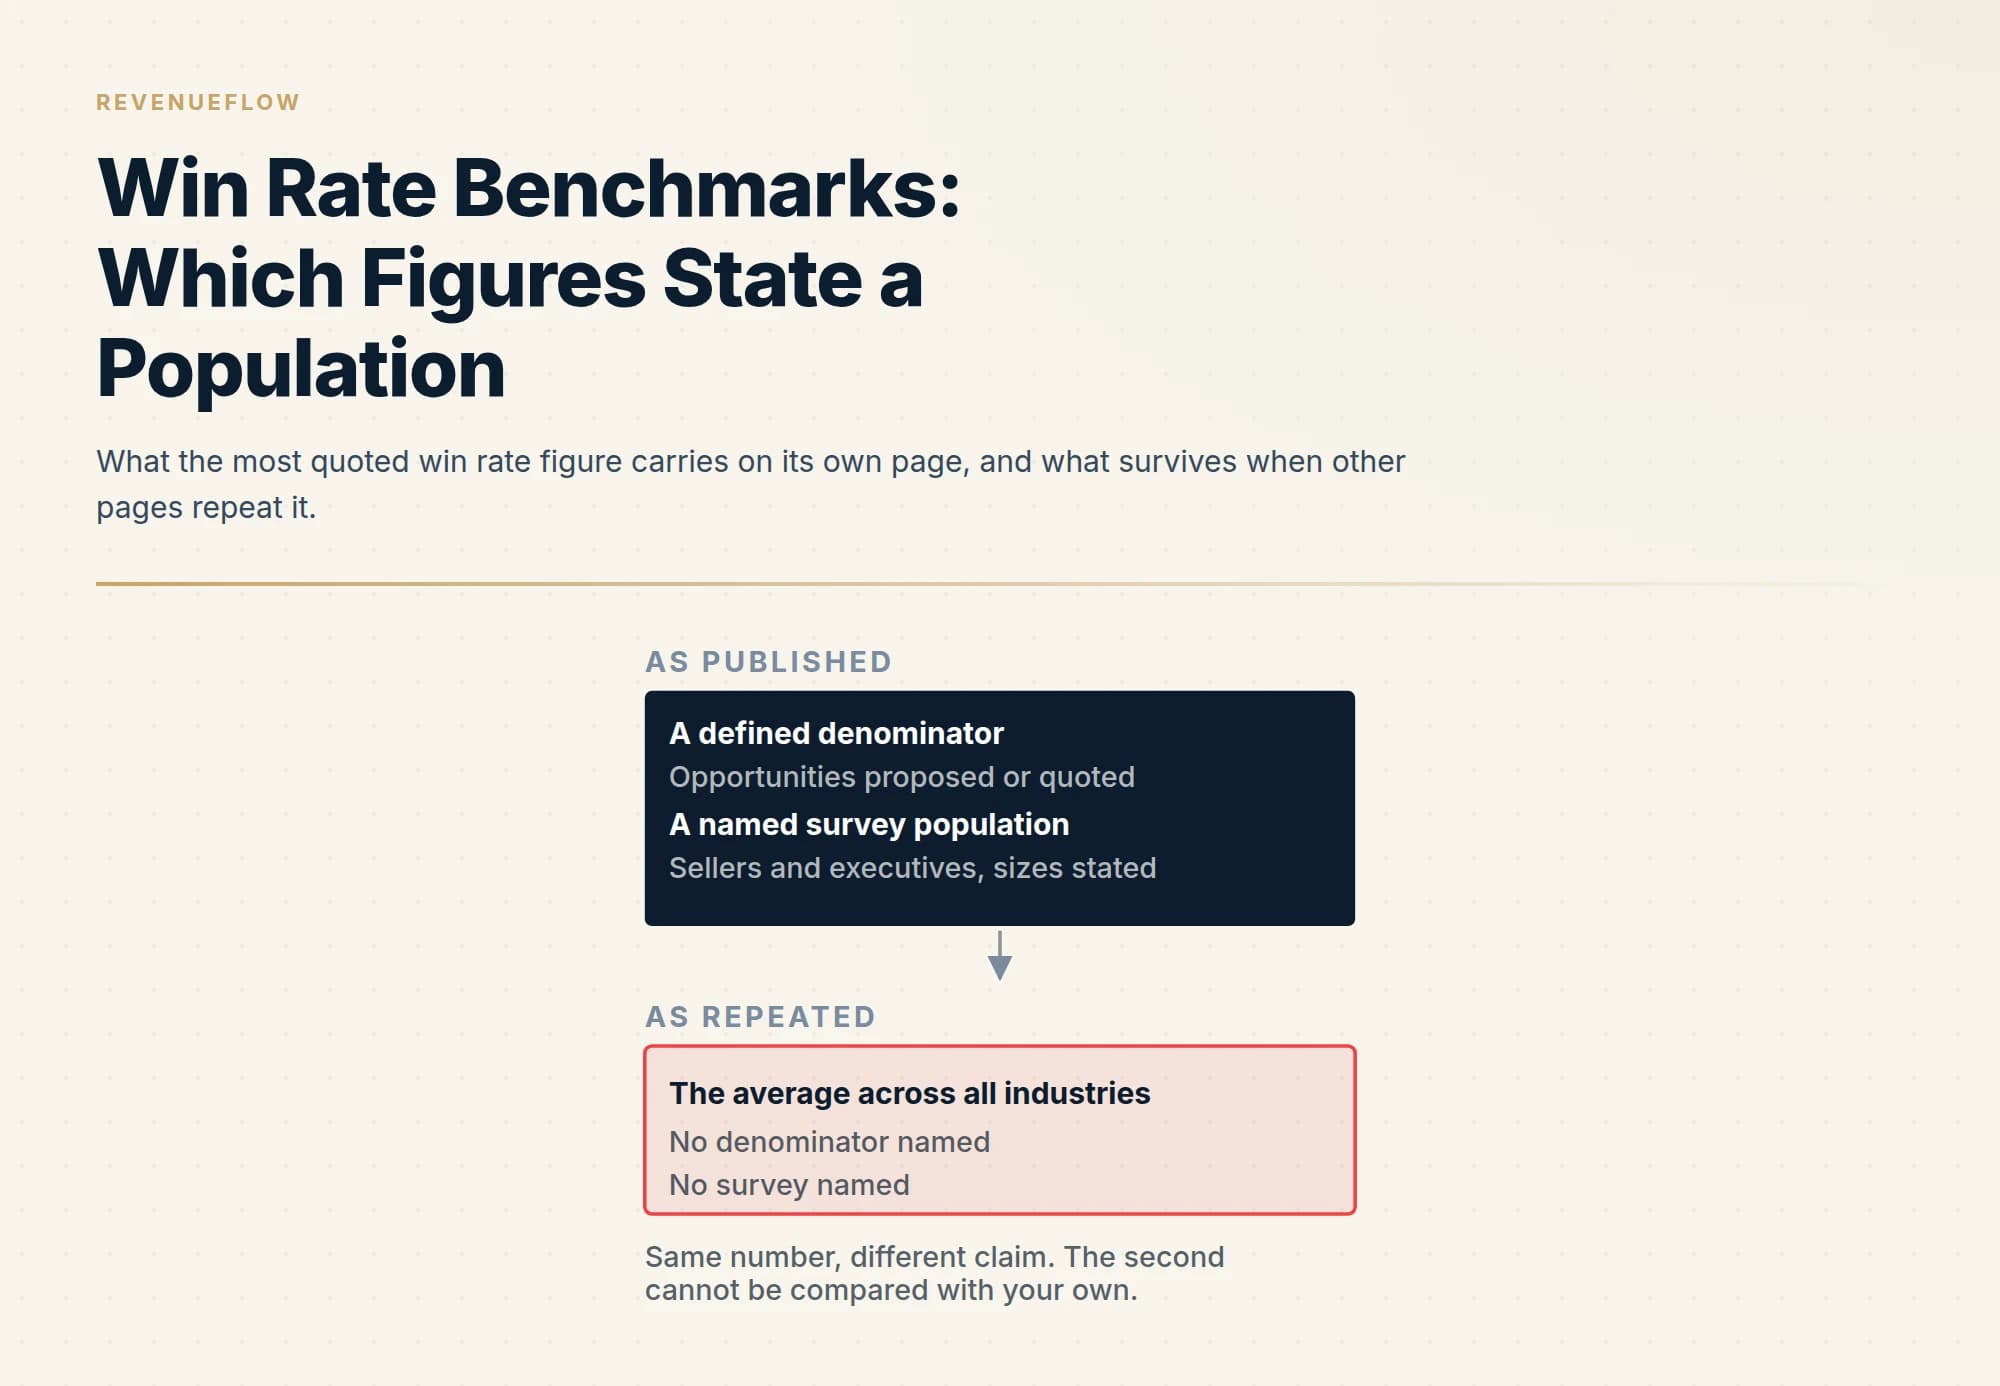
Of the most visible pages publishing an average sales win rate, one states its population and its denominator. Two publish figures from their own customer data without a count. Two assert a number with no source. Two publish a definition and no figure at all, and one roundup credits a figure to a page that does not carry it.
Key takeaways
- The most quoted average defines its denominator as opportunities proposed or quoted, and states the survey size and the range of company sizes behind it.
- That same figure is repeated elsewhere as the average across all industries, with the denominator, the population and the spread all dropped.
- Two publishers print ranges from their own customer base or their own report without stating how many opportunities or respondents are behind them.
- One widely repeated average is credited to a survey that exists, but not on the page a reader following the attribution would land on.
Reviewed and updated September 21, 2026
The same win rate appears on two pages in the first ten results for the average. One page gives it a definition, names the research group that produced it, says how many sellers were surveyed and describes the range of company sizes they came from. The other prints it as the average across all industries, with no definition and no survey attached. Both numbers are the same number. Only one of them is a benchmark.
That is the whole problem with win rate benchmarks, and it is not solved by finding a better figure. It is solved by reading what each published figure says about itself. What follows is a catalogue of the figures circulating for average sales win rate, sorted by whether the page states the population behind them, and it is written to be used before you compare anything. Why the denominator decides the number in the first place is the subject of the win rate entry, which this page takes as given.
The one figure here with a population attached
RAIN Group publishes the figure that most of the others are quoting. Its post, written by Mike Schultz and last updated on 11 June 2026, starts by defining the term rather than by printing a number: "Here's how we define sales win rate: The percent of opportunities proposed or quoted that the organization won."
That definition is doing real work, because it sets the denominator at the proposal stage rather than at everything that entered the pipeline. The page then states its population before its result: "the RAIN Group Center for Sales Research surveyed 472 sellers and sales executives representing companies with salesforces ranging in size from 10 sellers to 5,000+". Only after that does the figure arrive: "Across all respondents, the average win rate is 47%."
Two further statements on that page matter for anyone using the number. On generalisability, it says "It's worthwhile to note that though there were slight variations among industries and company sizes, their win rates were similar." On dispersion, it splits respondents into elite performers at the top, top performers, and the remaining majority, and reports that "Elite Performers win nearly three-quarters of their opportunities" while the larger group wins closer to two in five. So the published average sits between two populations that behave very differently, which is the part almost never carried over when the number is quoted.
What happens to it on the way
Ironclad's piece on increasing win rate, published on 8 May 2026 and modified on 29 July 2026, carries the number in the stripped form: "The average win rate across all industries is 47%". Later on the same page it softens to "Some studies point to an average around 47%, but that's just a benchmark", without naming which studies.
Read the two pages together and the loss is precise. The proposal-stage denominator is gone, so a reader measuring win rate over every opportunity created will compare their own number against one computed over a much smaller base. The survey population is gone, so a ten-person team and a five-thousand-seller organisation both read it as applying to them. And the spread between the top and the rest is gone, so a figure that sits between two very different groups reads as a single expectation.
Outreach's comparison of win rate and close rate, which carries no publication date on the page, handles the same source more carefully, writing that "the average win rate across 472 sellers and executives is 47 percent" and keeping the population in the sentence.
Pages that publish a figure from their own data, without a count
A second class is more honest about where the numbers come from and still cannot be compared against.
Forecastio, in a guide published on 16 April 2024 and modified on 29 May 2026, prints ranges by company size and says where they come from: "This guide shares battle-tested strategies from analyzing thousands of sales opportunities across our customer base, revealing exactly what separates average performers (20-30% win rate) from elite teams (35%+ win rate)." The evidence is real and the population is a customer base of unstated size, industry mix and deal shape.
Outreach adds a figure from its own research on the same page, reporting that "Opportunities closed within 50 days achieve a 47 percent win rate, while those exceeding 50-day cycles drop to 20 percent or lower, a 2.35x performance differential." The report is named. The sample behind it is not stated where the figure appears.
Both are usable as directional statements about the publisher's own customers. Neither is a target.
Pages that publish no figure at all, and pages that publish an assertion
The third class is the largest, and it splits in two.
Several of the most visible pages define the metric and decline to benchmark it. HubSpot's win rate guide, dated 28 July 2025, gives the arithmetic, describing how "The sales win rate is the percentage of final stage prospects that closed and became customers divided by the total number of deals in a given period", and offers a calculator rather than an average. Clozd, in a guide published on 13 December 2019 and modified on 17 April 2026, does the same in two forms, by count and by value, stating that "Win rate is the ratio of deals won divided by the total number of closed opportunities (both won and lost)" and warning that "A win rate percentage means nothing in a vacuum."
Other pages in this set supply a number with no source named on the page. AgencyAnalytics, on a page its own metadata dates to December 2023, states that "Typically, anything above 50% is considered a very good Win Rate, indicating more wins than losses in sales efforts", with no study attached. HeyIris, on a page carrying no date at all, prints ranges by sector, writing that "B2B SaaS companies often see win rates in the 15-25% range, as they might cast a wide net and have a more automated sales process", again without naming where the ranges were measured.
An assertion of that kind is not evidence about the market. It is evidence about what one publisher believes, and it circulates exactly as fast as a measured figure does.
| Publisher | What the page publishes | Population stated |
|---|---|---|
| RAIN Group | An average, with the denominator defined first | Stated: a named research group, a survey of sellers and executives, company sizes given |
| Forecastio | Ranges by company size | Unstated count: its own customer base |
| Outreach | A split by how long the deal took | Unstated sample: a named report, no sample where the figure appears |
| Salesmotion | An average credited to another publisher | Named second-hand, and absent from the page it credits |
| Ironclad | The same average as an all-industry figure | No |
| AgencyAnalytics, HeyIris | A threshold and sector ranges | No |
| HubSpot, Clozd | A definition and the arithmetic, no figure | No figure published |
The roundup layer, and an attribution that points elsewhere
Salesmotion's 2026 benchmark piece, dated 17 February 2026, is the most useful of the roundups because it opens by naming the problem: "most published averages mix apples and oranges, blending qualified-opportunity rates with raw lead-to-close rates and segment medians that don't apply to your business."
It then prints an average of roughly one deal in five and sources it plainly: "That number, from HubSpot's survey of over 1,000 sales reps, means nearly four out of five opportunities end in closed-lost."
Tracing that is instructive. HubSpot's own win rate page, read on 21 September 2026, publishes no average. What it does carry is a link to a separate publication described on the page as "HubSpot's 2025 State of Sales Report: What 1,000+ sales pros say about AI, buyer behavior, and growth", which is where a survey of that size lives. So the attribution points at a real survey of a stated size, and the figure is not on the page a reader following the trail would land on first.
That is the ordinary condition of this literature rather than a scandal. It does mean a figure should be traced to the organisation that produced it rather than to whoever repeated it, which is the general habit argued in sales benchmarking.
- Yes: The denominator is named, and it is the same one your report uses
- Yes: The population is named, with a count rather than a description
- Yes: The figure is traced to the organisation that produced it
- Yes: The spread is published, not only the average
- Yes: Deals that ended without a verdict are accounted for explicitly
- No: A threshold asserted with no study behind it
- No: Sector ranges with no stated source
Where we differ from standard practice
Two positions of ours change how these figures should be read on an outbound programme.
The first is about which opportunities exist at all. We send one message per campaign, built on one premise, with no bumps and no thread replies, and a later approach to the same audience is a separate campaign with its own reason to exist. That puts the whole qualification burden before the send rather than after it, because there is no second attempt to rescue a badly chosen audience. Fewer opportunities get created, and the ones that do have already passed a filter, which moves a decision-stage win rate upward for reasons that have nothing to do with selling skill. A benchmark drawn from teams running multi-touch sequences into a wider audience is measuring a different machine.
The second is that meetings are qualified against criteria agreed in writing before launch. A win rate computed over opportunities that met a written standard is not comparable with one computed over everything a rep chose to log, and the gap between those two is larger than the gap between most published benchmarks.
Neither position makes the published figures useless. It makes them orientation rather than targets, and the comparison that settles anything is your own rate measured the same way for four consecutive quarters.
What to do with the catalogue
Use the figure with a population when you have no history of your own, and quote it the way its publisher wrote it, including the proposal-stage denominator and the survey size. A number quoted with its definition attached survives contact with a sceptical room; the same number quoted bare does not.
Read the spread rather than the average. The one population-stated source here reports elite performers winning nearly three-quarters of their opportunities and the large remaining group winning closer to two in five, which tells a team far more than the midpoint between them.
Trace before you repeat. Two of the figures in this set are attributed to a publisher whose own page on the subject carries no such number, which is discoverable in one fetch and invisible otherwise. The same discipline applied to the wider set of sales figures is in sales statistics.
And when the rate itself moves, check the definition before the performance. A rate that shifts several points between quarters is usually a stage boundary being redrawn or a bulk cleanup closing old opportunities, and the way to find out which is the loss review described in win loss analysis, read beside the number the quota was built on in the sales quota.
The short version
Of the ten most visible pages on average sales win rate, one states a population: a named research group, a survey of several hundred sellers and executives, company sizes given, and a denominator set at the proposal stage. Its figure is the one the other pages read here are quoting, and it usually arrives stripped of all four of those.
Two more publish figures from their own customer data without a count. Two publish assertions with no source named. Two publish definitions and no figure. One roundup credits its headline to a survey that is real but not on the page it points at.
None of that makes benchmarking pointless. It makes the reading order clear: find the population, keep the denominator, prefer the spread to the average, and treat your own four-quarter trend as the only comparison that settles anything. If the constraint is the number of qualified conversations rather than the rate at which they convert, see what a first campaign produces against your market.
Frequently asked questions.
Frequently asked questions- What is a good sales win rate?
- No published figure in this set answers that for a specific team, because a rate only means something beside its denominator. The one source here that states its population defines win rate over opportunities that reached a proposal, which produces a far higher number than the same team measured over every opportunity created. Read your own rate over four quarters instead.
- What is the average B2B sales win rate?
- The most traceable published average comes from a research group that surveyed several hundred sellers and sales executives at companies ranging from ten sellers to several thousand, and it is measured over opportunities proposed or quoted. Other pages repeat the same number without the definition, and separate roundups print a much lower figure over every opportunity created.
- Why do published win rate benchmarks disagree so much?
- Because they are measuring different denominators over different populations. A rate over proposals excludes everything that died early. A rate over every opportunity created includes deals that never reached a decision. Add differences in how no-decision outcomes are treated and in whether the figure counts deals or dollars, and two honest publishers can be many points apart.
- Should I use an industry win rate as a target?
- Only as orientation, and only from a page that names its population. A benchmark can tell you whether your result is ordinary or an order of magnitude off. It cannot set a target, because it does not share your segment, your denominator or your qualification standard. The comparison that settles a decision is against your own prior quarters measured the same way.
About the author.

B2B cold email experts helping companies generate qualified leads through done-for-you outreach campaigns.
RevenueFlow Team
Explore more.
Ready to scale your outreach?
We build GTM engines that book real meetings. See the receipts.
Related articles.
Sales Cycle Length Benchmarks: What Each Figure Counts
The published B2B sales cycle benchmarks, sorted by what each page says it counted. The same number means two different things in two of them.
Sales Kickoff Agendas: Five Published, Session by Session
Five publishers print a sales kickoff agenda. They agree on four blocks and disagree on session length, rehearsal and where the agenda comes from.
Sales Enablement Charters: What the Published Ones Ask For
Six publishers set out what a sales enablement charter should contain. Five describe a document nobody can check, and one writes a definition with inspection in it.
Sales Comp Plan Design: What the Publishers Prescribe
Four publishers set out how to design a sales compensation plan. Here are their procedures, their components, and which of their ratios carry a population.
Cold Calling for Consulting Firms: The Partner's Hour
Cold calling for a consulting firm: who it dials and who picks up, why partner-led economics argue against the phone, the client's fiscal year, and when to skip it.
Cold Calling for Chemical Companies: Who Picks Up
A chemical cold call rarely arrives first. It reaches a formulator who has already been comparing suppliers on a screen, for one of three published reasons.