Sales Benchmarking: Only If the Denominators Match
A published benchmark summarises a population, a denominator, a window and a metric definition, and usually states none of them. What to compare against instead.
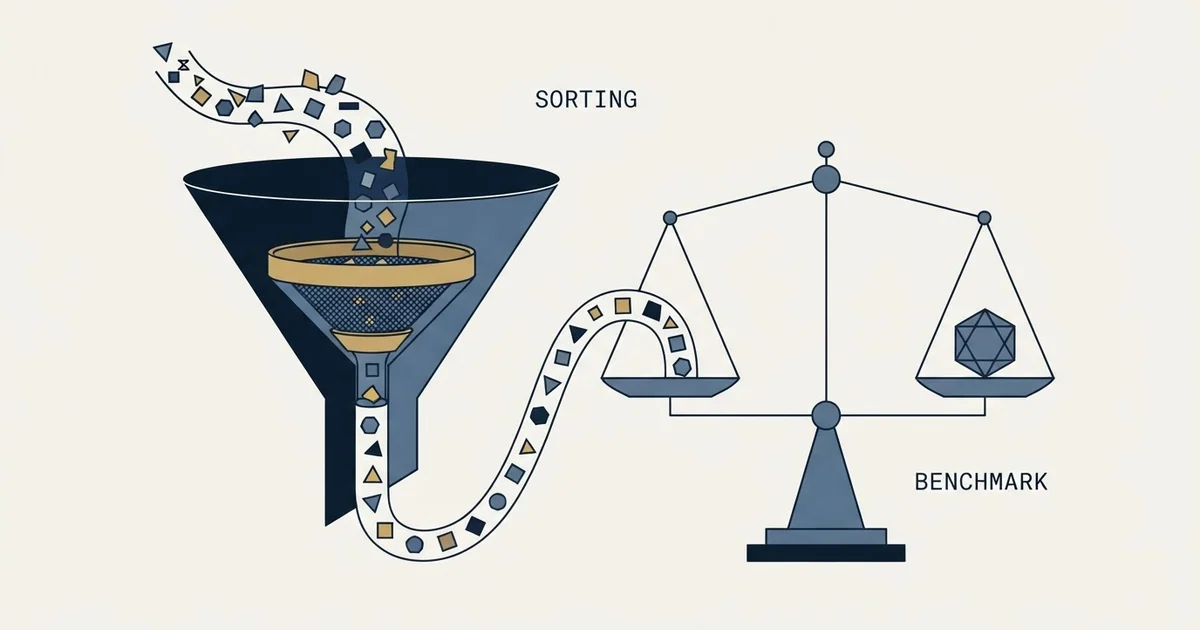
Sales benchmarking compares a sales organisation against a reference point, and it is only as good as the match between the two things compared. External figures orient. The comparison that settles a decision is against your own prior periods and cohorts, measured under the same definitions and the same denominator.
Key takeaways
- A benchmark figure summarises four decisions: the population, the denominator, the time window and the metric definition. A published one usually states none of them.
- Two teams reporting the same meeting count can be counting different events, because one counts booked meetings and the other counts attended ones.
- Internal comparison holds the offer, market and metric definition constant, which is why a movement in an internal number is evidence and a gap against an external one is not.
- An external benchmark is reliable as a smoke alarm rather than as a target: trust it for an order-of-magnitude gap, not for a difference of two percentage points.
Reviewed and updated September 2, 2026
A VP reads a published reply-rate benchmark, checks the dashboard, sees a number roughly half of it, and calls a meeting. Over the next quarter the team rewrites its messaging, changes its sending tool and loses two people. Nobody establishes what the published figure counted, who it counted it across, or over what window. The gap that triggered all of it may never have existed, because the two numbers were never measuring the same thing.
Sales benchmarking is the practice of comparing your sales organisation against a reference point. The practice is sound. The damage it does comes from skipping the step where you establish that the two numbers are comparable at all.
What a benchmark is actually claiming
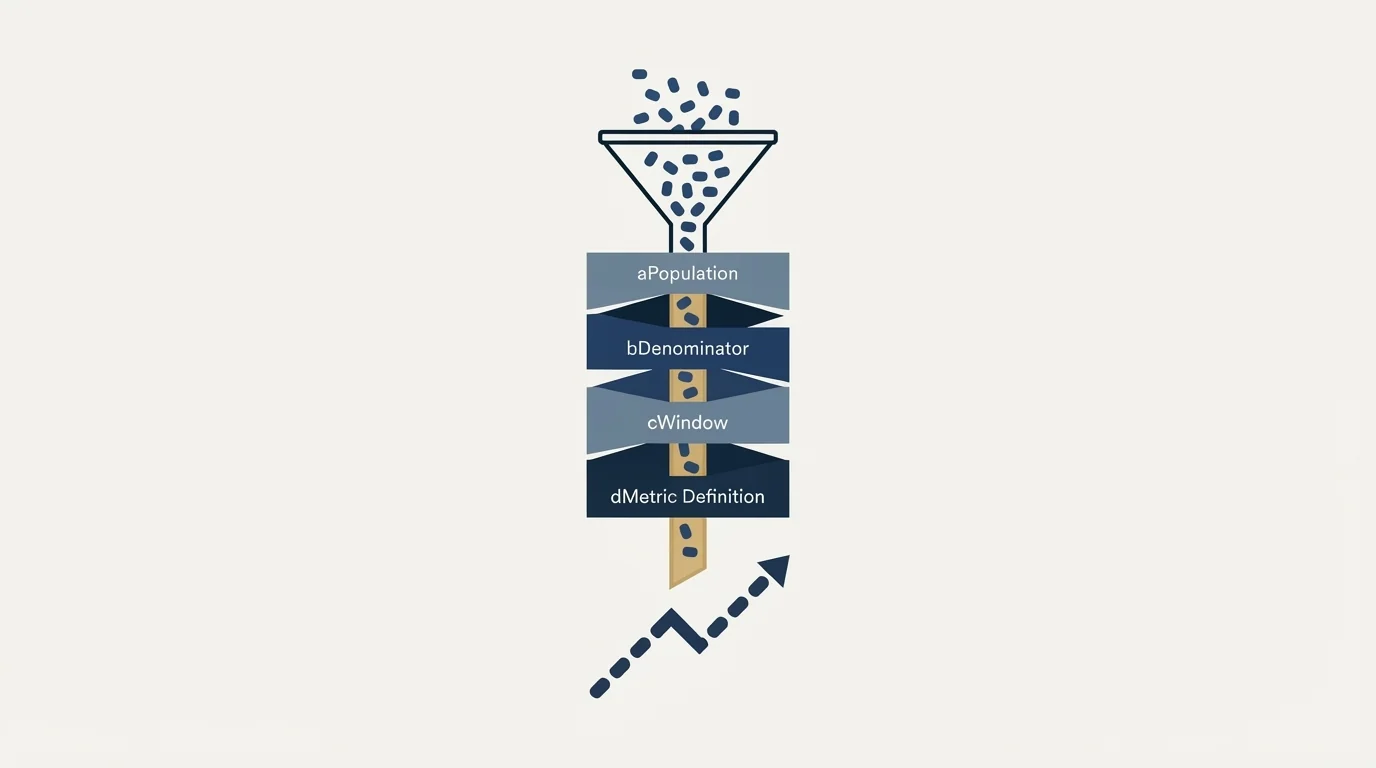
A benchmark figure is a summary of four decisions, and a published one usually states none of them.
The first is the population: which companies, which segments, which deal sizes. A reply-rate figure drawn from self-serve software sold at a few hundred dollars a year describes a different sales motion from one drawn from enterprise deals with a procurement cycle.
The second is the denominator. Reply rate over messages sent and reply rate over people contacted are different numbers, and they diverge by however much a team sends more than once. Win rate over qualified opportunities and win rate over all opportunities created can differ by a factor.
Deciding which of these figures deserves a dashboard slot and a named owner is a separate question, taken up in what actually counts as a sales KPI.
The third is the window. A quarter that contains a holiday period and a quarter that does not are not interchangeable, and a figure with no window attached silently averages both.
The fourth is the metric definition. Two teams reporting the same meeting count can be counting different events, because one counts booked and the other counts attended. That single difference moves the number more than most of the tactics people change in response to it. The same fault runs through pipeline reporting, where a lead counted on arrival and an opportunity counted on acceptance are two different moments measured by two different teams, which is the subject of pipeline lead generation.
Because a meeting count or reply rate can hide which motion produced it, how sales assist triggers handoffs shows why that written threshold matters as much as the metric definition itself.
- Depends: The population it was drawn from resembles your segment and deal size
- Depends: The denominator is the same one your dashboard uses
- Depends: The time window is stated and comparable to yours
- Depends: The metric is defined, so you know which event was counted
- Depends: You can name the source rather than the article that repeated it
Every item there is marked as a question rather than a tick on purpose. On most published figures the honest answer to at least two of them is that you cannot tell.
Internal benchmarking is the stronger instrument, and it is the one people skip
The comparison that settles a decision is against yourself. Your own previous quarter, measured with the same denominator, holds constant the offer, the market, the list quality and the definition of the metric, which are exactly the variables an external figure cannot hold constant. It is the only comparison where a movement in the number is evidence about something you did.
Internal benchmarking also has more surfaces than teams tend to use. A sales organisation can compare across reps at the same tenure, across segments, across sources, across quarters, and across cohorts of accounts that entered the pipeline in the same period. Each of those is a controlled comparison, because everything except the one variable is shared.
The cohort surface is the most underused of them and the least demanding to build. Group opportunities by the period they were created rather than by the period they closed, then measure each group as it matures. Closed-period reporting mixes deals that entered the pipeline under different offers, different targeting and different market conditions, and it is why a quarter can look worse than the work that produced it. Cohorts separate what was sold from when it happened to land.
The tenure comparison is worth calling out because it is so often read wrongly. A new rep's numbers are not a performance signal until they have finished ramping, and comparing a three-month rep to a two-year rep produces a gap that says nothing except that one of them started later. What the ramp period is and how to read performance during it is set out in ramp time.
The same caution applies to quota. Attainment distributions are a benchmarking surface in their own right, and the shape of the distribution carries more information than its average, because a team where most reps land near target and a team carried by two outliers can report the same mean. That reading is in quota attainment.
- Offer, market and metric definition are held constant
- A movement is evidence about a decision you made
- Available immediately, at no cost, from data you already hold
- Cannot tell you whether the whole organisation is unusual
- Population, denominator and window are usually unstated
- Useful for orientation and for spotting an order-of-magnitude problem
- Cannot settle a target, because it does not share your definitions
- Earns its place when you have no history yet
Where an external benchmark genuinely earns its place

Three cases, and they are narrower than the practice suggests.
When you have no history. A team sending its first campaigns has nothing to compare against, and an external range is better than nothing for deciding whether an early result is catastrophic or ordinary.
When the gap is an order of magnitude. External figures are too noisy to adjudicate a difference of two percentage points and perfectly adequate to tell you that a result ten times below the published range means something is broken rather than suboptimal. A benchmark used as a smoke alarm is being used correctly.
When you are pricing a decision you have not made. Deciding whether to open a new segment, or whether an outsourced provider's quoted rates are plausible, is a question about a world you have no data on, and somebody else's figure is the only evidence available.
Outside those three, the target-setting question is better answered from your own trajectory. The reasoning for that, applied to lead generation metrics specifically, is in lead generation KPIs, which also covers which six metrics survive a quarter of scrutiny.
How to read a published benchmark table
The best published benchmark sets say plainly what they are. Ours do: the cold email benchmark set states that its data points are industry-wide estimates compiled from platform reports and aggregated campaign data, tells the reader to use them as directional guidance while building their own baselines, and notes separately that open-rate tracking relies on pixel loading and has become less reliable, so open rates should be read as a directional signal rather than a precise metric. The 2026 B2B report opens with a methodology note making the same first point, and adds that individual results vary with list quality, messaging, timing and industry dynamics.
Read that kind of statement as the most useful part of the table rather than as boilerplate. A benchmark set that tells you its figures are estimates has told you the size of the claim it is making. A table that presents a single decimal-place figure with no methodology note has made a larger claim on weaker ground.
Two habits follow. Prefer a source that publishes a range over one that publishes a point, because the range is the honest representation of the uncertainty. And trace a figure back to the organisation that produced it rather than to whoever repeated it, since a number that has been through three summaries has usually lost its denominator on the way.
Applied to one metric, that habit produces a short list, and win rate benchmarks sorts the published figures by whether the page names a population.
Running one, in order
- Step 1Fix the definitions first
Write down what each metric counts and over what denominator, before pulling any data. This is the step that decides whether the rest is meaningful.
- Step 2Build the internal baseline
Your own prior periods and cohorts, measured under those definitions. Nothing external enters yet.
- Step 3Choose the comparison surface
Across reps at equal tenure, across segments, across sources, or across time. One variable at a time, or the result is unreadable.
- Step 4Bring in external figures last, as orientation
Check whether the whole organisation sits somewhere unusual, and treat any gap smaller than an order of magnitude as unproven.
- Step 5Act on the largest readable gap
A benchmark identifies where to look. What to change is a separate question that the benchmark cannot answer.
The last step is where most benchmarking exercises stop being useful. A gap tells you that two numbers differ. It does not tell you which of the several things upstream of that number caused the difference, and a team that reorganises around a gap without diagnosing it has chosen an expensive way to test a hypothesis.
Decomposing an output into the numbers multiplied to produce it is the way in, and the inputs a slump is made of show why the cause is always older than the symptom.
Consider an invented illustration to show the shape. Suppose two segments report meeting rates of two percent and six percent on equal volume. Those figures are made up for the example and are not measurements of anything. The three-fold gap could be targeting, offer relevance, message quality, or the fact that one segment's meetings are counted at booking and the other's at attendance. Only the last of those is free to check, and it is the one to check first, because if it explains the gap then no campaign work was ever needed.
What benchmarking cannot do
A benchmark is a measurement instrument pointed backwards. It compares what happened, and it is silent on whether the thing you are doing is the right thing to be doing at all. A sales organisation can benchmark its way to the top quartile of a motion that is structurally wrong for its market, and every number on the way will look like progress.
It is also silent on causation. Two numbers differing is not a mechanism, and the temptation to supply one from intuition is strongest exactly when the gap is large and the meeting is uncomfortable.
Used properly it is a targeting device for attention. It tells a team which of fifteen things is furthest from where it should be, so the expensive diagnostic work goes to that one rather than being spread evenly across all fifteen.
The short version

Sales benchmarking compares your organisation against a reference point, and the comparison is only as good as the match between the two things being compared. A published figure summarises a population, a denominator, a window and a metric definition, and usually states none of them, which is why an external benchmark orients and does not settle. The comparison that settles a decision is against your own prior periods and cohorts, measured the same way. Bring external figures in last, treat anything short of an order-of-magnitude gap as unproven, and remember that a gap identifies where to look rather than what to change.
If the number you are benchmarking is outbound performance and you would rather see it diagnosed against live sending than argued from a table, that is what a free campaign review is for.
Frequently asked questions.
Frequently asked questions- What is sales benchmarking?
- It is the practice of comparing your sales organisation's performance against a reference point, which can be internal or external. Internal benchmarking compares against your own prior periods, segments, sources or cohorts. External benchmarking compares against published figures or a peer set. The two answer different questions and only one of them can settle a target.
- Why do published sales benchmarks disagree with our numbers?
- Usually because the denominator differs. Reply rate over messages sent and reply rate over people contacted are different numbers, and win rate over qualified opportunities differs from win rate over all opportunities created. Add an unstated population and time window and two figures can differ substantially while both are correct about different things.
- Should we set targets from industry benchmarks?
- A target derived from your own trajectory is a plan, and one derived from someone else's median is a guess with a citation attached. Use your own prior periods, measured the same way, to set the target. Reach for an external figure when you have no history at all, or to check whether the whole organisation sits somewhere unusual.
- How do I know whether a benchmark source is any good?
- Read what it says about itself. A set that publishes a range and states its figures are estimates has told you the size of the claim it is making. A single decimal-place figure with no methodology note has made a larger claim on weaker ground. Trace a number to the organisation that produced it rather than to the article that repeated it.
About the author.

B2B cold email experts helping companies generate qualified leads through done-for-you outreach campaigns.
RevenueFlow Team
Explore more.
Ready to scale your outreach?
We build GTM engines that book real meetings. See the receipts.
Related articles.
Win Rate Benchmarks: Which Figures State a Population
A catalogue of the published average sales win rates, sorted by whether the page names the population behind its own number. Most do not.
Sales Enablement Charters: What the Published Ones Ask For
Six publishers set out what a sales enablement charter should contain. Five describe a document nobody can check, and one writes a definition with inspection in it.
Sales Cycle Length Benchmarks: What Each Figure Counts
The published B2B sales cycle benchmarks, sorted by what each page says it counted. The same number means two different things in two of them.
Sales Kickoff Agendas: Five Published, Session by Session
Five publishers print a sales kickoff agenda. They agree on four blocks and disagree on session length, rehearsal and where the agenda comes from.
Sales Comp Plan Design: What the Publishers Prescribe
Four publishers set out how to design a sales compensation plan. Here are their procedures, their components, and which of their ratios carry a population.
Sales Prospecting for Utilities: Read the Filings First
Prospecting utilities from the proceedings that announce their spend: rate cases, resource plans and procurement decisions, who owns each, and the supplier gate.