Sales Cycle Length Benchmarks: What Each Figure Counts
The published B2B sales cycle benchmarks, sorted by what each page says it counted. The same number means two different things in two of them.
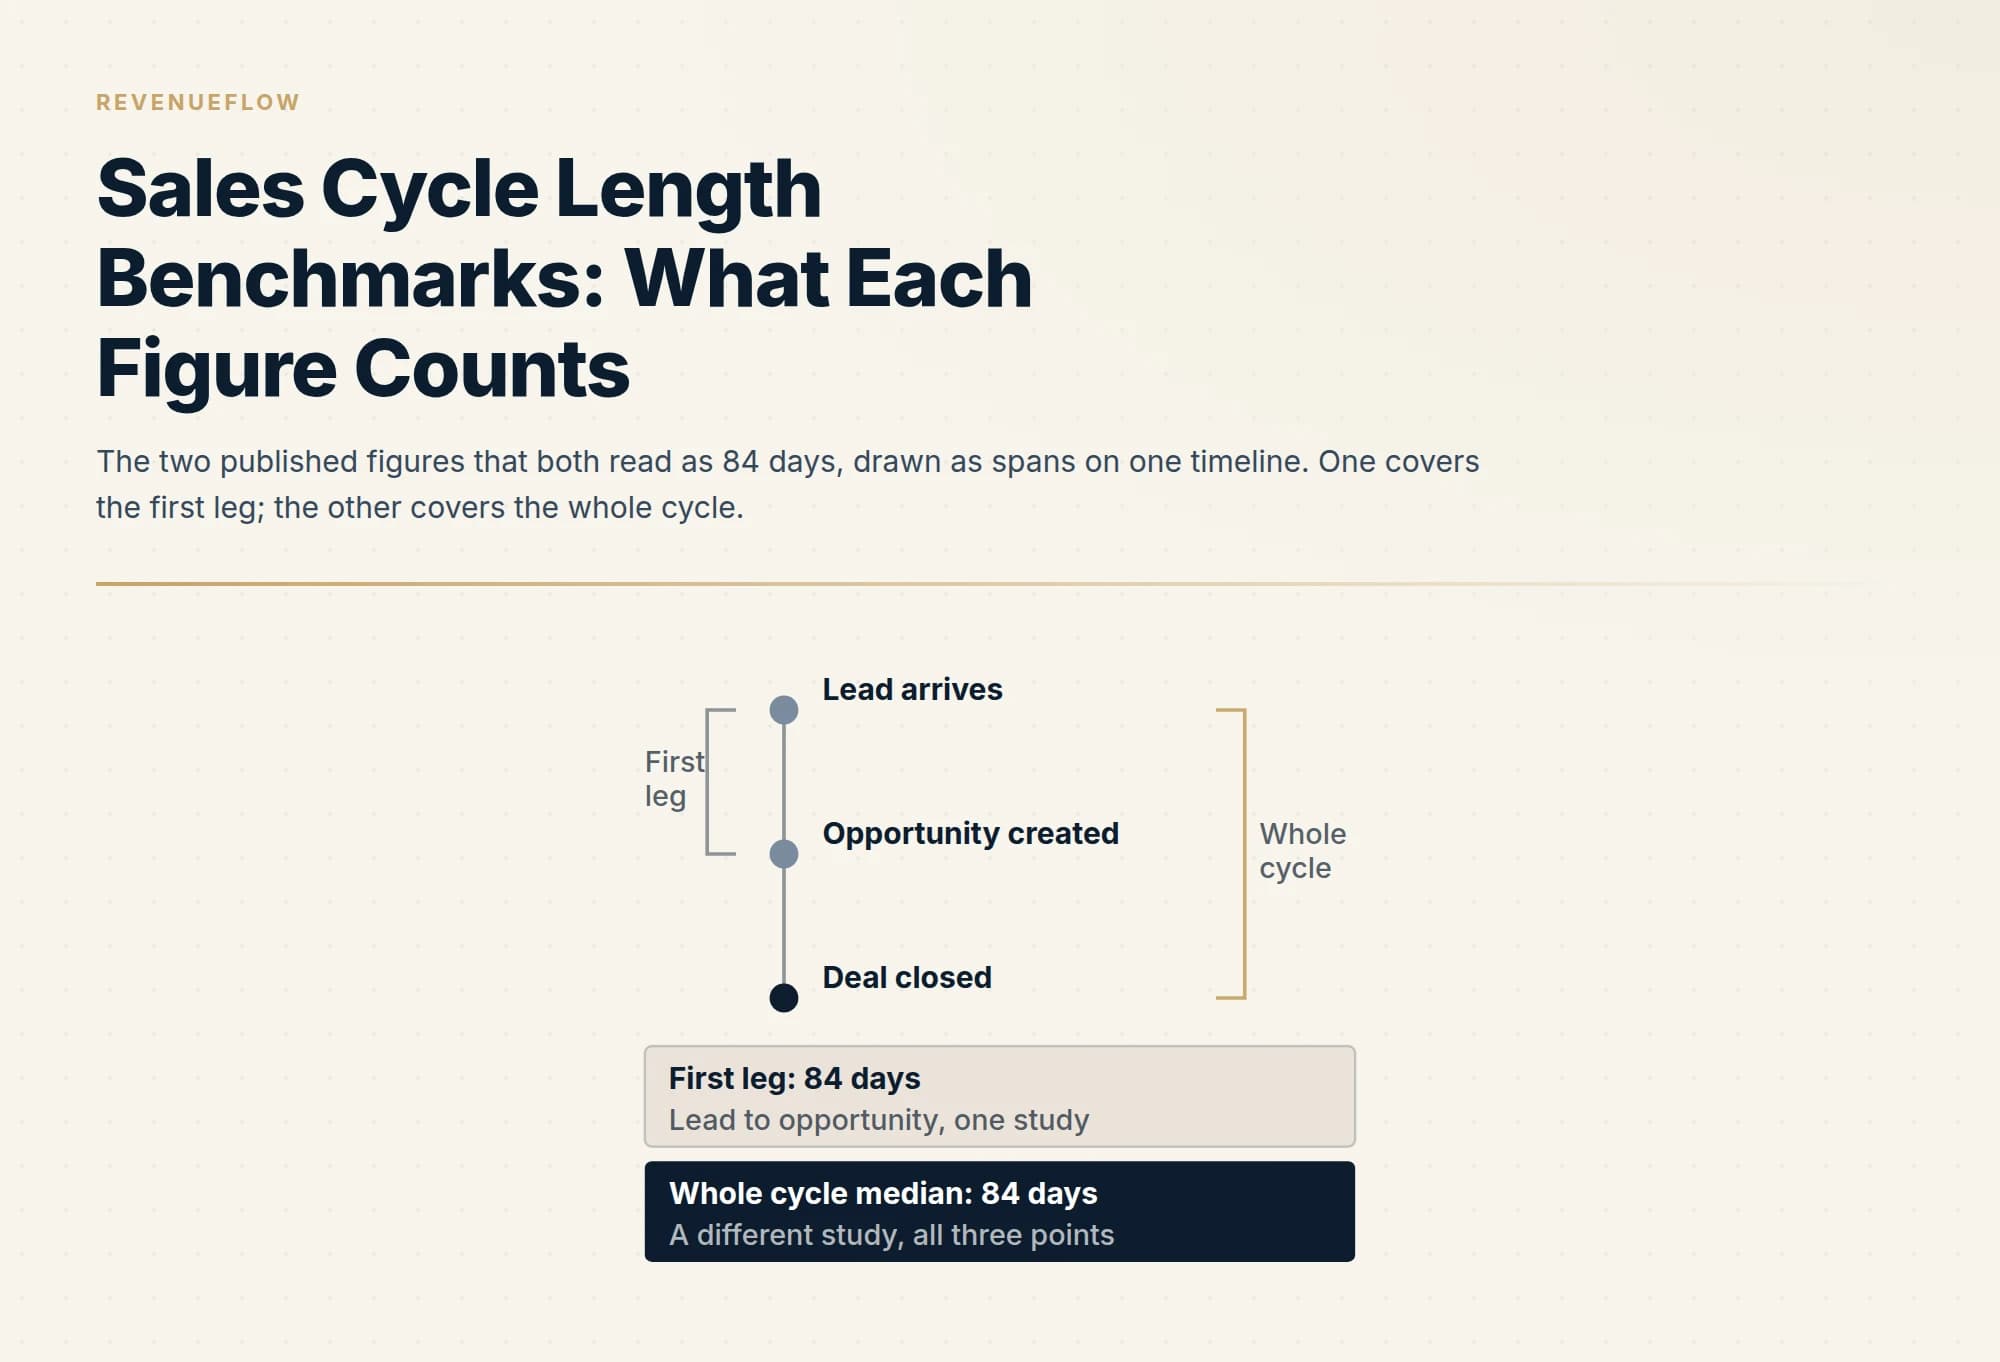
Published sales cycle benchmarks differ mostly in what they counted. One states a company count, a four-quarter window and bands by deal size given as a middle-half spread. One names both legs it measured. One compiles twenty industries from other sources. Two publish only the formula.
Key takeaways
- One widely repeated figure is a whole-cycle median and another identical-looking one covers only the leg from a lead arriving to an opportunity being created.
- The study with a stated company count publishes its bands as a middle-half spread, so a quarter of its population sits outside each end.
- Its stage-by-stage table is built from won deals only, which leaves out the slow deals that eventually died.
- The by-industry table that ranks first for this question describes itself as compiled rather than measured, and publishes its source list.
Reviewed and updated September 21, 2026
The number 84 days appears twice in the published literature on business-to-business sales cycle length, and it measures two different things. In one study it is the median length of a whole cycle across several hundred software companies. In another it is the average time from a lead arriving to an opportunity being created, which is the leg that happens before a deal exists at all. A planner who takes the second figure for the first has budgeted half a cycle.
That is the recurring failure in this category. The figures are not wrong; they are answers to questions nobody restates when quoting them. What follows is a catalogue of the published cycle-length benchmarks, sorted by what each page says it counted and over which population. Where the clock starts and stops, and why that choice changes everything downstream, is argued in the sales cycle entry and is taken as given here.
The figures that state what they counted
Two sources in this set publish both a population and a counting rule, and they are the only two worth planning against.
Optifai publishes a benchmark keyed on a stated company count and a stated window. Its page attributes its headline to the "Optifai Pipeline Study, 2026, N=939 B2B SaaS companies with stage-level CRM data", and a second line on the same page dates the window as running from the second quarter of 2025 to the first quarter of 2026. The headline is a median of 84 days across business-to-business software, with bands by deal size: under fifteen thousand dollars of annual contract value closing in 14 to 30 days, the mid-market band in 30 to 90 days, and enterprise deals above one hundred thousand dollars in 90 to 180 days or longer. The page also states the shape of those ranges rather than leaving them to be read as extremes: "Cycle ranges represent 25th-75th percentile."
Two methodological statements on that page deserve more attention than the headline. The stage-by-stage table is derived from "CRM timestamp analysis of won deals", so it describes the deals that closed successfully and not the ones that died, which biases every stage duration towards the paths that worked. And the page reports a trend rather than a level as well, stating that sales cycles "have lengthened 22% since 2022" alongside a rise in the number of stakeholders on a deal.
Geckoboard publishes the other traceable figure, and it is the one whose scope is most often lost. Its metric page reports that "Implisit analysed the pipelines of hundreds of companies and found the average length from Lead to Opportunity (otherwise known as Marketing Qualified Lead (MQL) to Sales Qualified Lead (SQL))was 84 days and the average length from Opportunity to Close (otherwise known as Sales Qualified Lead (SQL) to Deal) was 18 days. So the average Lead to Close length is 102 days." The population is described rather than counted, and both legs are named explicitly, which is what makes the figure usable.
The compilation layer, and what it does to provenance
Focus Digital publishes the by-industry table that a search for this question is most likely to surface first. Its page, published on 3 July 2026 and modified on 27 August 2026, describes its own method as assembly rather than measurement: "Our team compiled 2026 benchmarks for average sales cycle length across 20 industries, segmented by pipeline stage, company size, sales channel, product complexity, deal size, and, new this year, number of decision makers."
Its headline figures are specific. "The overall average sales cycle across all industries we studied is approximately 118 days". By sector, "Non-profit organizations carry the longest average cycles at 162 days; retail has the shortest at 70 days". On committee size it publishes a rate of change: "Each additional decision maker added to a buying committee extends the average sales cycle by an estimated 8-15 days". And at the top of the market, the same page reports that "Enterprise deals exceeding $500K in ACV average 270 days to close".
The page is unusually good about its sources, listing the 939-company study and a separate 2024 benchmark set among them. That is also what makes it a compilation rather than an original: the 84-day median it repeats near the top of the page is the other publisher's median, while the 118-day average is its own aggregate across the twenty industries it assembled. Both numbers are on one page, they are not in conflict, and a reader who takes one of them without reading the other will describe the market wrongly in either direction.
| Row | Start and end named | Population counted | Losses accounted |
|---|---|---|---|
| Optifai | Yes | Yes | Yes |
| Geckoboard | Yes | Partial | No |
| Focus Digital | Partial | No | No |
| Aexus | No | No | No |
| Salesforce and Kixie | Yes | No | No |
Ranges published from experience rather than from data
Aexus, a sales outsourcing firm, publishes segment ranges in months rather than days, writing that "The average B2B software sales cycle typically takes between 3 to 6 months for mid-market solutions and 9 to 18 months for enterprise deals", with smaller business software at roughly one to three months. Its page, dated 17 November 2025, names no dataset and no sample, and its explanatory sections are about mechanisms rather than measurement: deal size, the number of decision makers, product type, buyer urgency and budget timing.
Read as a practitioner's summary of what they see, that is useful. Read as a benchmark it has no population, so there is nothing to place your own number against.
A third variant publishes a figure by pointing at somebody else's chart. Default's guide, dated 1 December 2025, introduces its average by inviting the reader to "Check out the following data from Databox showing the average sales cycle length for a B2B company", which makes the figure a reference rather than a finding, and leaves the reader two hops from a population.
The pages that publish the arithmetic and no number
Several of the most visible results define the metric and stop, which is the honest option when you have no dataset.
Salesforce, in a piece dated 18 October 2023, publishes the formula in one line: "At a basic level, sales cycle length is simply the total number of days it takes for a deal to close, divided by the total number of closed deals." Kixie, published on 29 July 2024 and modified on 16 June 2026, makes the variance argument instead of a claim, noting that "Average sales cycle length can vary significantly depending on the industry, target market, and individual sales strategies", and then describes averaging stage durations across opportunities. Neither publishes a benchmark. The dashboard vendor and the glossary entry in the same set publish no date of their own either, so a reader cannot tell how old their definitions are.
That is not a gap in their pages. It is the correct behaviour for a publisher without a measured population, and it is worth noticing how many of the pages that do print a number are the ones with the least to say about where it came from.
What the counting rule does to the number
Three choices separate two honest publishers by more than any tactic changes a real cycle, and only the first of them is usually stated.
The first is the pair of events the clock runs between. One figure here runs from a lead arriving; another runs from an opportunity being created; a third runs to signature. The gap between the first and second of those, on the one page that reports both legs, is larger than the second leg itself.
The second is whether losses are counted. A stage table derived from won deals describes the route successful deals took. Deals that stalled for months and then died are absent, and they are usually the slow ones, so a won-only average runs shorter than the experience of the team that lived through the quarter.
The third is whether the published spread is a range of extremes or a middle band. The one study here that says which reports percentiles, so a quarter of its population sits outside each end of every band it prints. A reader who treats the top of a band as a worst case will be wrong about a quarter of their deals.
Those three are what make a single blended average almost useless for planning, and they are why the segmented figures are worth more than the headline. The arithmetic that turns a cycle length into a headcount plan is in sales capacity planning, and the approvals that quietly add days at the end of an enterprise deal are the subject of the deal desk.
- Yes: The start event is named: a lead arriving, or an opportunity created
- Yes: The end event is named, and it is the same one your report uses
- Yes: The population is counted, not described
- Yes: The page says whether lost deals are in the calculation
- Yes: Any range is labelled as a spread or as extremes
- Yes: Segmented by deal size, because the bands do not overlap
- No: A single blended average across every industry
Where we differ from standard practice
Two things about how we run outbound change which of these figures applies.
The first is that cold outbound adds a leg that none of the studies read for this page measures. The published cycles here begin at a lead arriving or at an opportunity being created, and both of those assume the buyer has already raised a hand. A campaign that starts from a list has to get from a first message to a reply to a meeting before any of these clocks start, and that stretch is not inside any figure on this page.
The second is our own policy, which is one message per campaign, with no bumps and no thread replies, and a later approach to the same audience treated as a separate campaign on a different premise. A repeat message reaches the people who already saw the first and chose not to reply, and the reputation cost of that lands on the sending domain across everything else it sends. The practical effect on timing is that the pre-opportunity leg is short and discrete rather than a long sequence: a campaign either produces replies or it does not, and the next test is a new premise rather than a longer wait.
Meetings are qualified against criteria agreed in writing before launch, which also changes what a cycle length measures on our side. A cycle that begins at a meeting which met a written standard is not the same object as one that begins at any logged opportunity, and mixing the two is the same error this whole page is about.
How to use the catalogue
Pick the figure whose legs match your report. If your dashboard measures from opportunity creation, the whole-cycle median is the comparable number and the lead-to-opportunity figure is not, even though both read as 84 days.
Prefer the segmented bands to the blended average. The published bands by deal size do not overlap, so the average across all of them describes a company with a deal-size mix nobody actually has, and the one publisher that states a company count publishes its bands as a middle-half spread rather than as limits.
Ask whether losses are in. Any figure built from won deals is a description of the successful route, and a team planning capacity against it will under-provision for the deals that take a year to die. The general version of this discipline, applied to any published figure, is in sales benchmarking, and tracing a number back to its originator rather than to the page repeating it is worked through in sales statistics.
The short version
One published cycle-length figure in this set states a company count, a four-quarter window and its counting rule, and it reports a median with bands by deal size given as a middle-half spread. One more names both legs it measured and describes its population. One compiles twenty industries from other people's data and publishes its source list. One publishes month ranges with no population at all, and two publish the formula and no figure.
The trap is the collision at 84 days: the same number is a whole-cycle median in one study and a lead-to-opportunity leg in another. Match the legs before you compare, prefer bands to blends, and check whether lost deals were counted.
If the constraint is that too few of the right conversations are starting for any cycle to run, see what a first campaign produces against your market, with the qualification criteria agreed in writing before anything sends.
Frequently asked questions.
Frequently asked questions- What is the average B2B sales cycle length?
- It depends entirely on what the figure counted. One study with a stated company count reports a median of 84 days across business-to-business software, with bands running from a fortnight for small deals to six months or more at enterprise size. A compiled table across twenty industries reports an average nearer 118 days. Both are on the record and neither is universal.
- Why do published sales cycle benchmarks disagree?
- Three counting choices separate them. Which two events the clock runs between, since one figure starts at a lead arriving and another at an opportunity being created. Whether lost deals are included, because a table built from won deals describes the successful route only. And whether a published range is a spread of the middle half or a pair of extremes.
- How is sales cycle length calculated?
- The formula published by the vendors is the total number of days it takes for deals to close divided by the total number of closed deals, computed over a period you name. The stage version averages the time opportunities spend in each stage. Neither formula says which event starts the clock, which is why two teams using the same formula can report very different numbers.
- Should cycle length be segmented by deal size?
- Yes, because the published bands by deal size do not overlap. Small deals close in weeks, mid-market in one to three months, and enterprise in three to six months or longer in the study that states its population. An average across all of them describes a company with a deal-size mix that few organisations actually have.
About the author.

B2B cold email experts helping companies generate qualified leads through done-for-you outreach campaigns.
RevenueFlow Team
Explore more.
Ready to scale your outreach?
We build GTM engines that book real meetings. See the receipts.
Related articles.
Win Rate Benchmarks: Which Figures State a Population
A catalogue of the published average sales win rates, sorted by whether the page names the population behind its own number. Most do not.
Sales Kickoff Agendas: Five Published, Session by Session
Five publishers print a sales kickoff agenda. They agree on four blocks and disagree on session length, rehearsal and where the agenda comes from.
Sales Enablement Charters: What the Published Ones Ask For
Six publishers set out what a sales enablement charter should contain. Five describe a document nobody can check, and one writes a definition with inspection in it.
Sales Comp Plan Design: What the Publishers Prescribe
Four publishers set out how to design a sales compensation plan. Here are their procedures, their components, and which of their ratios carry a population.
Cold Calling for Consulting Firms: The Partner's Hour
Cold calling for a consulting firm: who it dials and who picks up, why partner-led economics argue against the phone, the client's fiscal year, and when to skip it.
Cold Calling for Chemical Companies: Who Picks Up
A chemical cold call rarely arrives first. It reaches a formulator who has already been comparing suppliers on a screen, for one of three published reasons.