Sales Capacity Planning: The Headcount a Target Implies
A capacity model turns a revenue target into a number of sellers. Ramp, attrition and a measured attainment figure decide whether that number is real.

Sales capacity planning works out how much revenue a sales team can produce and how many sellers a target requires. The formula is selling units multiplied by quota multiplied by measured attainment, adjusted for ramp and attrition. Run it top down from the target and bottom up from the roster, and treat the gap as the output.
Key takeaways
- Sales capacity is the number of selling units multiplied by quota multiplied by attainment, and the attainment input moves the output more than headcount does.
- Count fully ramped sellers at full weight and new hires at part weight, and subtract expected attrition as an input, so headcount and selling units are different numbers.
- Run the model top down from the target and bottom up from the roster, because the gap between the two is the only part that requires a decision.
- Hiring is the slowest way to close a capacity gap, and a gap that is really a shortage of qualified conversations is a supply problem that headcount does not fix.
Reviewed and updated September 18, 2026
A board sets next year's revenue number in October. By November it has been divided by a quota and turned into a hiring plan, and by the following September the team is short and nobody can say which assumption broke. The plan was arithmetic all along, and the arithmetic was mostly assumptions wearing the clothes of measurements.
Sales capacity planning is the model that produces that hiring number, and the useful version of it is less about the formula than about which of its inputs anybody has actually measured.
What is sales capacity planning?
Sales capacity planning is working out how much revenue a sales team can actually produce in a period, and how many sellers a revenue target therefore requires. The core sum is the number of selling units multiplied by quota multiplied by the share of quota sellers really reach. It turns a target into a hiring plan, which is why the inputs matter more than the formula.
What the model computes
Salesforce's sales capacity planning guide defines it as the process of identifying and forecasting the number and type of sales representatives needed to achieve a given revenue goal, and notes that it is also called sales force planning or sales capacity forecasting. The basic formula it publishes is short enough to hold in your head: the number of reps, multiplied by individual quota multiplied by average quota attainment, gives sales capacity.
That page is honest about what the short version leaves out. It says the basic formula does not account for ramp times, churn, or new hire plans, and recommends mapping the reps you start each quarter with, plus planned hires, minus average churn. For the ramp adjustment it recommends counting fully ramped reps at full weight and new hires at half, and its published worked example runs a team entering a quarter with twenty fully ramped reps, expecting two hires and typically losing two reps a quarter, to a capacity of nineteen complete reps. The inputs in that example are Salesforce's own illustration rather than a measurement of any real team, and the shape is what matters: the number of bodies and the number of selling units are different quantities, and the plan is built on the second.
The same page lists what a real model has to take in, and the list is the reason capacity planning belongs to whoever holds the data rather than to whoever holds the target: team size and roles, inbound lead volume, the pipeline required to hit the goal, average sales cycle length, average deal size, average quota attainment across teams and individuals, average ramp times, the number of reps ramping at any moment, and average turnover.
How to work out sales headcount from a revenue target
Work it in both directions with the same three inputs. The figures below are invented for the illustration and describe no real company. They use the convention from the Salesforce page above: a fully ramped seller counts as one selling unit, a new hire as half, and expected leavers are subtracted.
| Step | The sum | Result |
|---|---|---|
| What one selling unit produces | Quota 600,000 x measured attainment 0.7 | 420,000 |
| Top down: units the target implies | Target 6,000,000 / 420,000 | 14.3 selling units |
| Bottom up: units the roster holds | 10 ramped + half of 4 new hires - 1 expected leaver | 11 selling units |
| The gap | 14.3 - 11 | 3.3 selling units, or 1,380,000 of the target |
| The same gap at assumed full attainment | 6,000,000 / 600,000 = 10 units, against 11 | No gap shown |
The last row is the reason to do the sum with a measured attainment figure. At an assumed hundred percent the same roster looks one unit over-staffed, and the plan reports no gap at all. Note also that sales headcount and selling units are different numbers: this plan lists fourteen people and counts eleven units.
Two directions, and the gap between them is the plan
A capacity model is worth building twice, in opposite directions, because each direction answers a question the other cannot.
Run it top down and the target tells you the headcount it implies: this number, divided by a quota that a person at this attainment level can carry, requires this many selling units. Run it bottom up and the current team plus the hiring plan tells you what can actually be produced: these people, at these ramp states, at their measured attainment, produce this much.
Neither number is the plan. The difference between them is, and the value of doing both is that the difference is a quantity somebody has to decide about rather than a surprise that arrives in month nine.
The gap this decision exposes usually crosses team lines, and decision ownership across go-to-market teams maps where those handoffs typically leak.
Three adjustments decide whether the model is honest
High turnover in a BDR team is the version of this most teams actually meet, and it compounds through the ramp rather than through the headline number: each replacement restarts a ramp the plan already treated as spent, so a team can hold its seat count steady all year and lose capacity anyway.
What that seat owns is worth pinning down before modelling it, since the boundary between opening and closing conversations is where the letters stop settling the job.

Ramp is a discount on new hires, not a delay before they count. A seller hired in month two of a quarter is not a seller for that quarter, and the convention of counting them at part weight exists because counting them at full weight is how a plan promises capacity that has not arrived. The corresponding number is ramp time, and it is worth measuring for your own segments rather than borrowed, because a longer cycle and a more technical product both push it out.
Attrition is not a risk, it is an input. A model that treats turnover as an unfortunate exception plans a full roster and staffs a smaller one every period. Subtracting an expected loss looks pessimistic on the page and is simply what the last several quarters did.
Attainment is the input that decides everything and the one most often set to a hundred percent. A capacity model built on the assumption that every seller hits quota is a model of a team that does not exist, and it will overstate capacity by exactly the amount by which the assumption is wrong.
That third one is where the model quietly lies, and it is worth being specific about the mechanism with arithmetic. Suppose a plan carries ten fully ramped sellers on a quota of six hundred thousand each, and the model assumes full attainment. It reports six million of capacity. If the team's measured attainment is closer to seven tenths, the same roster produces four million two hundred thousand, and the plan is short by one million eight hundred thousand before a single thing has gone wrong. Every figure in that paragraph is invented for the illustration and describes no real company. The point that survives the invented numbers is that the attainment assumption moves the output more than the headcount does, and it is the input least likely to have been measured.
Our quota attainment entry carries the position that matters here: a broad team miss is usually evidence about the plan rather than about the sellers. A capacity model is where that evidence should have been used, because attainment is an input to it and the plan that produced the miss was built on the optimistic version of the same number.
Capacity and coverage are two different constraints
A capacity model says how many selling units the number requires. It says nothing about whether the market can be reached by those units, and treating one as the other is the most common way a plan is wrong while every number in it is correct.
The territory carve is where the second constraint lives, and the live position there is worth restating: a plan can show every account owned and zero accounts abandoned while most of the market sees nothing all year, because assignment gets recorded as coverage and the two are different facts. A coverage model assigns customers to segments, segments to roles and roles to people. A capacity model assumes those people can produce. Both can be internally consistent and jointly wrong.
SMB sales boundary explained clarifies why segment size labels rest on who actually holds the budget and signing authority, not headcount alone.
The practical version is that a capacity plan should be read against a workload number as well as a revenue number. Take an invented pair of figures purely to make the shape visible: a model that says fourteen sellers, against a carve that gives each of them six hundred accounts. Neither number describes a real company. The plan has answered how many people the target needs and left unanswered whether the target is reachable by fourteen people working the way this team works, and only the first of those two questions has an owner.
How many leads a sales rep can handle is the workload half of that pair, and it is derived rather than looked up: available selling hours divided by the touches your own process requires per lead, checked against the accounts already assigned. Published figures for leads per rep describe somebody else's process and cannot stand in for that arithmetic.
Selling hours are harder to observe once nobody shares a floor, and what replaces line of sight puts that weight on the activity record.
The gap has two answers and only one of them is hiring
When a small SDR team is the constraint on growth the model is worth running before the requisition, because it distinguishes a team that is too small from a target that was never reachable at any plausible headcount, and those two produce the same complaint.
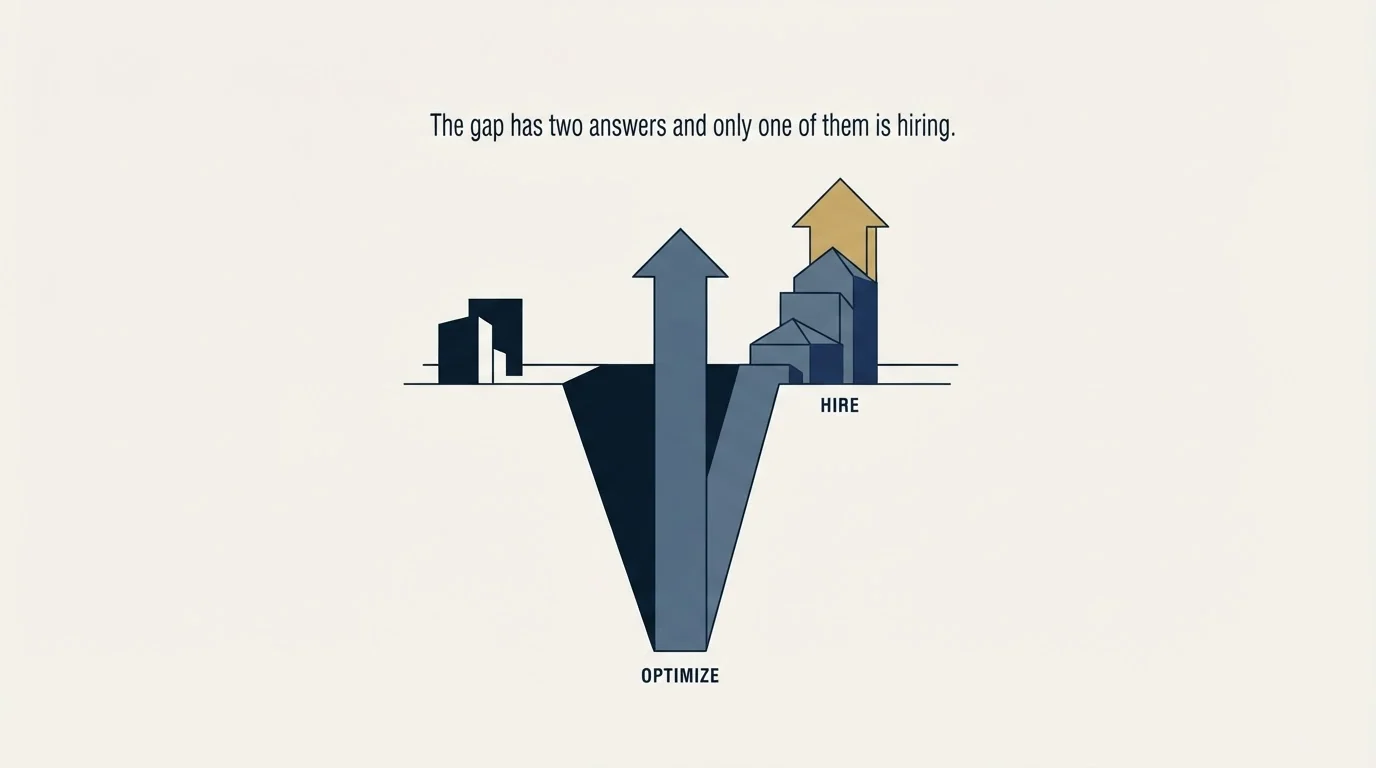
Every capacity model on the shelf resolves its gap the same way, by adding heads, because that is the variable the model exposes. It is also the slowest and most expensive lever, and it compounds: a hire is a fixed cost that arrives immediately, produces on a ramp, and carries the same attrition probability as everyone else.
The same model read in the other direction answers a team that cannot absorb the qualified demand it already has: the gap is negative, and hiring is still the slowest of the available responses.
Our note on why hiring more reps is usually the expensive answer argues the case in full, and the fully loaded cost of a sales development seat is the worksheet that prices the option properly before it is chosen. The other answers to the same gap are less visible in the model and often faster: raising conversion inside the funnel the team already has, changing the segment mix so the same effort meets larger contracts, or moving part of the market to a motion that does not consume a seller's personal attention.
Measured, not assumed
- The attainment figure is measured from your own last four periods, not borrowed
- Ramping sellers are discounted, and the ramp length comes from your own segments
- Expected attrition is subtracted as an input rather than noted as a risk
- The model was run top down and bottom up, and the gap is stated as a number
- The workload per seller is stated beside the revenue per seller
- Every answer to the gap was priced, not only the hiring one
Still to settle
- Quota per head has been checked against what the current team actually reaches
- A plan whose only variable is headcount, presented as arithmetic
Where this sits against outbound
A capacity plan describes selling capacity, and selling capacity is downstream of conversation supply. A model that produces a headcount has assumed each of those sellers will have enough qualified conversations to work, and that assumption sits outside the model entirely. Where it fails, the visible symptom is an attainment miss, which then feeds back into the next capacity plan as evidence about the team.
So a request for more meetings to fill a team's capacity is a supply question wearing a headcount question's clothes, and the two are answered by different work.
That is the loop worth breaking, and it is a supply question rather than a headcount question. Counting pipeline at the top against counting it at acceptance is where the supply number gets defined honestly, and pipeline coverage is the ratio that turns a revenue target into a pipeline requirement before any of it is divided by heads. Where the crediting rule is what determines which of several roles gets recognised for that pipeline, the crediting policy is the neighbouring decision, and it is worth settling before two roles are pointed at the same accounts.
RevenueFlow is paid on attended meetings that meet criteria agreed in writing before launch, which prices the supply side in the same unit a capacity model is built from. See what a first campaign produces before a gap is closed with headcount that takes two quarters to produce anything.
The short version
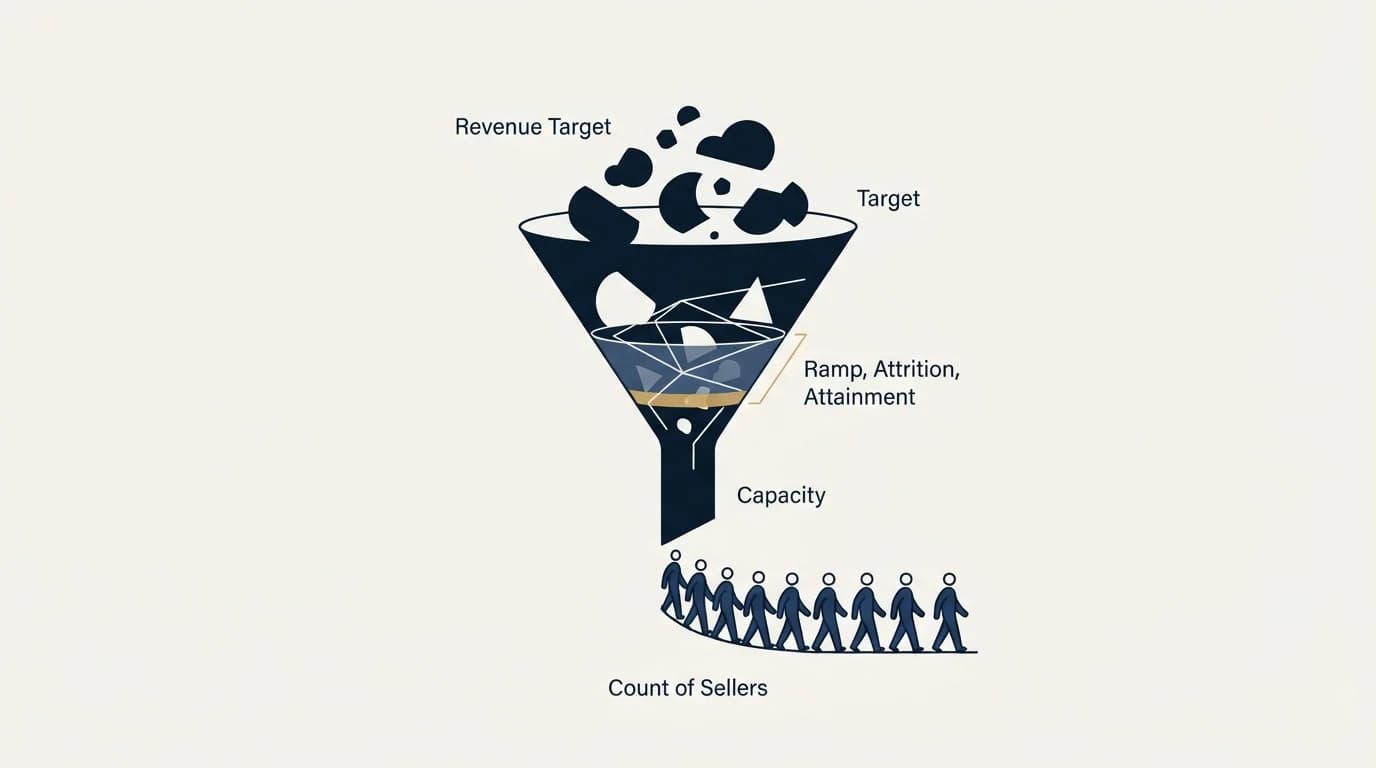
Capacity planning turns a revenue target into a number of selling units. The formula is reps multiplied by quota multiplied by attainment, and the adjustments that make it honest are ramp, attrition and a measured attainment figure rather than an assumed one.
Build the model in both directions and treat the gap as the output. Read the result against a workload number as well as a revenue number, because a plan can be right about how many people the target needs and wrong about whether those people can reach the market. Then price every answer to the gap rather than the only one the model makes visible, since hiring is the slowest lever in a plan whose problem is usually the supply of conversations rather than the supply of sellers.
Definitions, the formula and the ramp convention above are quoted from the Salesforce page linked in the text, fetched and verified 21 August 2026. Its worked example uses its own illustrative inputs. Verify current guidance against the source before relying on it.
Frequently asked questions.
Frequently asked questions- What is sales capacity planning?
- Sales capacity planning is the process of identifying and forecasting the number and type of sales representatives needed to reach a revenue goal, in Salesforce's definition. In practice it is a model: selling units multiplied by quota multiplied by measured attainment, adjusted for ramp and attrition, which turns a revenue target into a hiring plan.
- How do you calculate sales headcount from a revenue target?
- Divide the target by what one fully ramped seller really produces, which is quota multiplied by measured attainment. That gives the selling units the target implies. Then count the roster bottom up: ramped sellers at full weight, new hires at about half, less expected leavers. The difference between the two numbers is the gap to decide about.
- What is the sales capacity formula?
- The basic formula Salesforce publishes is the number of reps multiplied by individual quota multiplied by average quota attainment. Its guide adds that this leaves out ramp times, churn and new hire plans, and recommends counting fully ramped reps at full weight and new hires at half, then subtracting the reps you typically lose in a quarter.
- Why do sales capacity plans come up short?
- Usually because attainment was assumed at a hundred percent when the team's measured figure is lower, so capacity is overstated by exactly that difference. Ramping hires counted at full weight and attrition treated as an exception add to it. A plan can also be right on headcount and still fail because sellers lack enough qualified conversations.
About the author.

B2B cold email experts helping companies generate qualified leads through done-for-you outreach campaigns.
RevenueFlow Team
Explore more.
Ready to scale your outreach?
We build GTM engines that book real meetings. See the receipts.
Related articles.
Sales Enablement Charters: What the Published Ones Ask For
Six publishers set out what a sales enablement charter should contain. Five describe a document nobody can check, and one writes a definition with inspection in it.
Win Rate Benchmarks: Which Figures State a Population
A catalogue of the published average sales win rates, sorted by whether the page names the population behind its own number. Most do not.
Sales Kickoff Agendas: Five Published, Session by Session
Five publishers print a sales kickoff agenda. They agree on four blocks and disagree on session length, rehearsal and where the agenda comes from.
Sales Cycle Length Benchmarks: What Each Figure Counts
The published B2B sales cycle benchmarks, sorted by what each page says it counted. The same number means two different things in two of them.
Sales Comp Plan Design: What the Publishers Prescribe
Four publishers set out how to design a sales compensation plan. Here are their procedures, their components, and which of their ratios carry a population.
Cold Calling for Higher Education Vendors: Who Picks Up
Who a published campus number really reaches, what university purchasing pages permit a sales call to do, the quiet period around a bid, and when a campus can talk.