SDR Salary and the Fully Loaded Cost: The Real Number
A worksheet rather than a benchmark. Seven inputs, the order to combine them in, and the two adjustments that move the answer more than base pay does.
Build the number from your own market rather than a published median. Total base and variable at a stated attainment assumption, add your payroll provider's actual burden rate, add per-seat tools, management time and hiring cost spread across expected tenure, then divide by productive months rather than by twelve.
Key takeaways
- A national median applied to your market produces a number with the appearance of precision and none of the substance.
- The Bureau of Labor Statistics blocks automated retrieval, so its wage data could not be verified at source and circulating aggregator figures are unchecked.
- Dividing by productive months rather than by twelve usually moves the per-month figure further than any argument about base salary.
- A salary compared against a vendor retainer is a partial cost against a complete one, so load both sides or load neither.
Reviewed and updated September 1, 2026
A hiring plan goes to the board with one number in the SDR row, and that number is a base salary somebody found in a compensation guide. The seat gets approved. Nine months later finance asks why the sales development line is running over, and the answer is that the approved number was one of seven inputs, and the other six were never written down anywhere.
This article does not contain a salary figure, and the reason is worth being blunt about. Sales development pay swings enormously by city, by industry margin, by seniority within the same title, and by how much of the package is variable. A national median applied to your market produces a number with the appearance of precision and none of the substance. The authoritative public source is the Bureau of Labor Statistics, which blocks automated retrieval, so nothing here has been verified at source. Quoting an aggregator figure we cannot check, and that would be wrong for most readers anyway, is worse than giving you the structure and telling you where to get your own inputs.
So this is the worksheet. Seven inputs, the order to combine them in, where each one comes from, and the two adjustments that move the answer more than the salary does.
Why the salary cell is the smallest part of the problem
The instinct is to treat everything past base salary as overhead, a percentage uplift you apply at the end. That works until you compare against something. The moment the in-house number sits next to an agency retainer or an automation stack, every line you left out is a line the other option quietly includes, and the comparison inverts.
Run through what the other options bundle. An agency retainer includes the rep, the person managing the rep, the data, the sending infrastructure, the recruiting cost of finding them, and the cost of replacing them when they leave. A software stack includes the tooling and none of the people. If your in-house figure is a salary, you are comparing a partial cost against two complete ones, and the salary always wins that comparison because it was never the whole cost.
The virtual SDR breakdown separates the vetted remote hire from the AI software billed monthly, and shows where each one quietly fails.
- Yes: Base salary for your city, your industry and the seniority you will actually hire
- Yes: Variable compensation, and the attainment assumption you are budgeting at
- Yes: Employer payroll taxes, insurance, retirement contribution and paid leave
- Yes: Tools, data credits, mailboxes, domains and CRM seat, per person per month
- Yes: Management and coaching time, valued at the manager's own loaded cost
- Yes: Cost to hire, spread across the tenure you actually expect
- Yes: Ramp, expressed as productive months rather than calendar months
Input by input, and where to get each one
Base salary. Three sources beat any published median. Job postings in your market that disclose a range, because pay disclosure requirements have made that readable in more places than it used to be. Two recruiter conversations, which cost an hour and give you the number people are actually accepting rather than the number being advertised. And your own last two offers, including anything you had to add to close them. For a public reference point, the Bureau of Labor Statistics publishes wage data by occupation and by metropolitan area through its Occupational Employment and Wage Statistics programme at bls.gov/oes. Read the occupation definition before trusting the match, because standard occupational categories are broader than job titles and sales development sits inside a wider sales category rather than having one of its own.
Variable compensation. Two decisions here, and confusing them is the most common modelling error in this whole exercise. The first is the size of the variable component at full attainment. The second is what attainment you are budgeting. Model at full attainment and you will overstate cost and understate the risk of a rep who is not hitting it. Model at expected attainment and you have quietly built a plan that breaks the moment somebody performs. Pick one, write it in the cell as an assumption, and use the same assumption on both sides of any comparison.
Employer taxes and benefits. Do not use a rule of thumb. Your payroll provider or your finance lead can tell you the actual burden rate you pay, and it varies by country, by state, by headcount band and by what you offer. This is a five-minute question with an exact answer, which makes it the cheapest accurate input on the list.
Tools and data. Add up what the seat consumes: the sequencing platform, enrichment or contact data credits, the mailboxes and sending domains, a dialer if the motion includes phone, and the CRM licence. The honest way to get this is to take last quarter's invoices for those categories and divide by seats, rather than by listing sticker prices. Most teams find the real per-seat figure is higher than the plan assumed, because credits get consumed unevenly and somebody always tops them up.
Management and coaching. A rep who is not coached produces a fraction of a rep who is, so this line is not optional and it is not free. Estimate the hours a manager will genuinely spend each week on this one person, and value them at the manager's own loaded cost rather than their base salary. The tell that this line is being fudged is a plan where a manager somehow coaches six reps in the same hours they were coaching two.
Cost to hire. Agency fee or internal recruiting time, plus interview hours across everyone involved, plus equipment and onboarding. Getting that total is straightforward. The consequential decision is what you divide it by, which is the next section.
The two adjustments that move the answer

Everything above produces an annual cost. It is still the wrong number, because it assumes twelve months of output from twelve months of pay.
Ramp. A new rep produces very little in their first weeks, and this is not a performance issue. They are learning the product, the objections, which titles actually own the decision, and what a real reply from your market looks like. Sending infrastructure needs warming before it carries volume. Estimate the productive months honestly by asking your existing team how long it took them, then divide your annual cost by productive months rather than by twelve. That single division usually moves the per-month figure further than any argument about base salary.
Deciding which platform handles that warming period is its own research project, and a comparison of warmup tools for SDR teams lays out the current options.
Attrition. Sales development has short tenure almost everywhere, which means the hiring cost and the ramp are not one-time items. They are a recurring cycle. Spread the cost to hire across the tenure you actually observe rather than across a full year, and model the ramp again each time the cycle repeats. A seat you expect to refill in eighteen months carries a materially different cost per productive month than the same seat modelled as permanent.
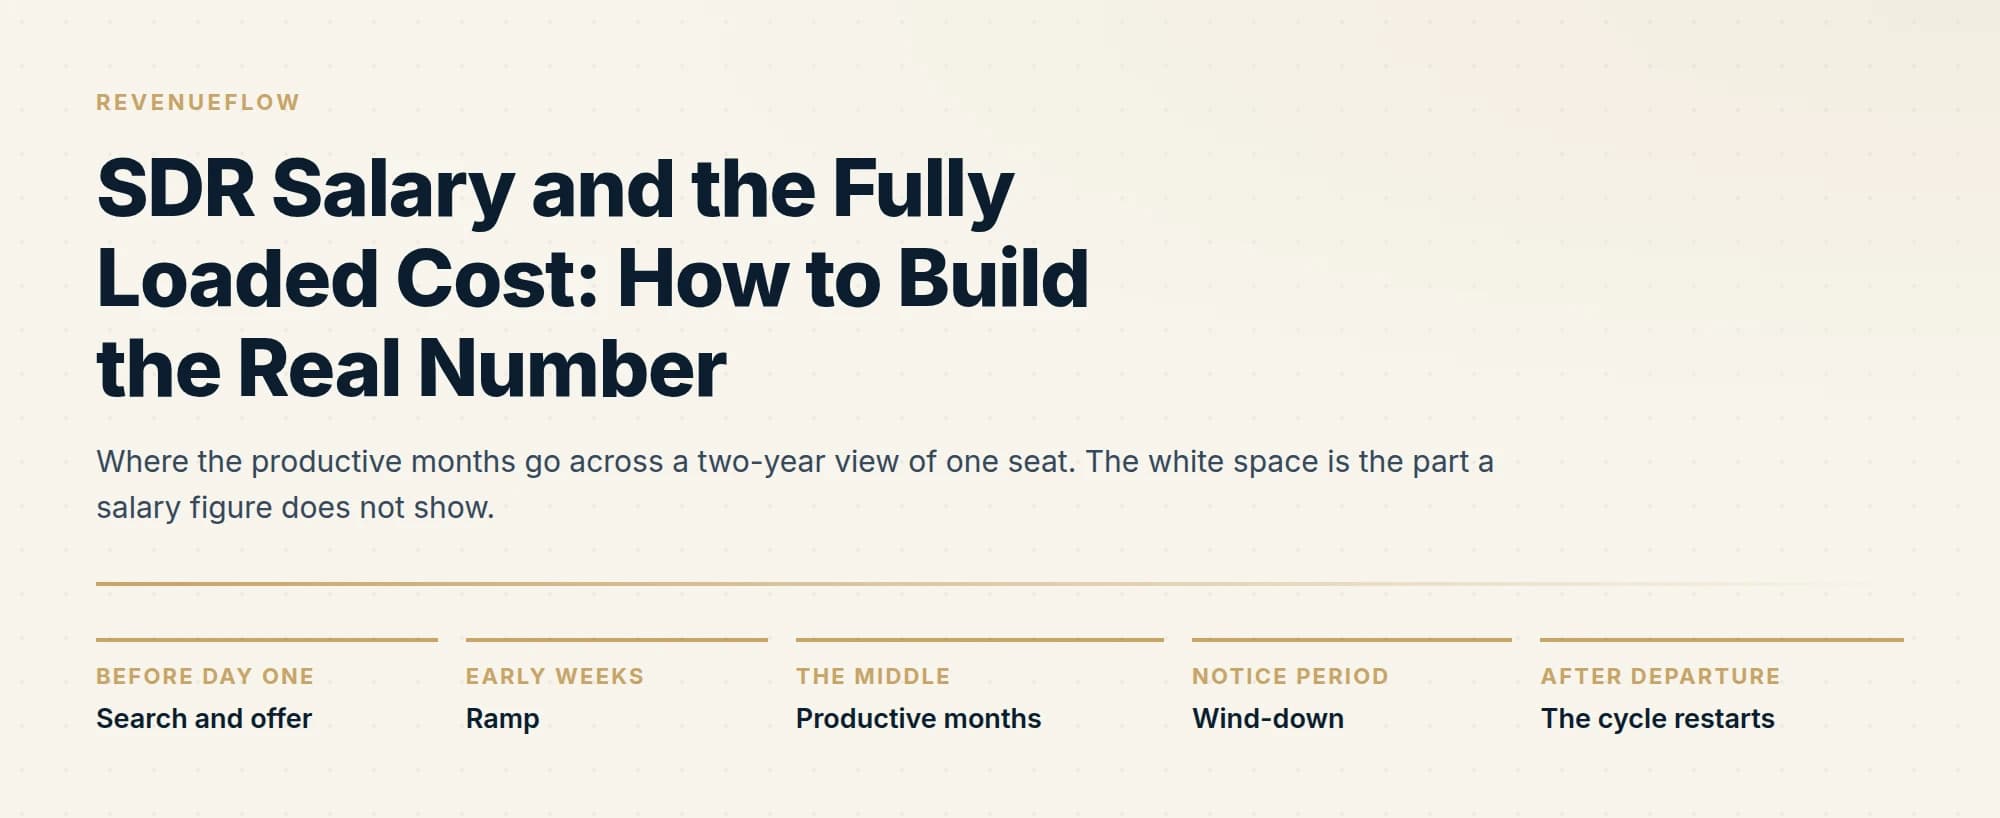
- Before day oneSearch and offer
Recruiting spend and interview hours accumulate against a seat producing nothing yet.
- Early weeksRamp
Product education, objection handling, list and ICP context, sending infrastructure warmed. Output is deliberately low.
- The middleProductive months
The only period where output is a fair measure of the seat. This is the denominator in your cost per productive month.
- Notice periodWind-down
Pipeline handover, and in most teams a drop in output well before the last day.
- After departureThe cycle restarts
Recruiting spend and ramp are paid again. Whatever the departing rep learned about your market leaves unless it was written down.
The order to combine them in
Sequence matters, because each step answers a different question and stopping early gives you a number that answers none of them.
- Step 1Total the cash
Base plus variable at your stated attainment assumption. Write the assumption next to the number so nobody has to guess later.
- Step 2Add employer cost
Apply your payroll provider's actual burden rate. This gives you what the person costs before they have any tools or a manager.
- Step 3Add the seat
Per-seat tools and data, plus management time at the manager's loaded rate, plus hiring cost spread across expected tenure.
- Step 4Divide by productive months
Not by twelve. The result is cost per productive month, which is the only figure that compares cleanly to anything else.
Cost per productive month is the output. From there you can get to cost per meeting if you have a defensible meetings-per-month figure, though be careful: use a number your own team has produced, not a number from a vendor's case study, and hold the same standard for what counts as a meeting on both sides.
The three ways this comparison gets rigged, usually by accident
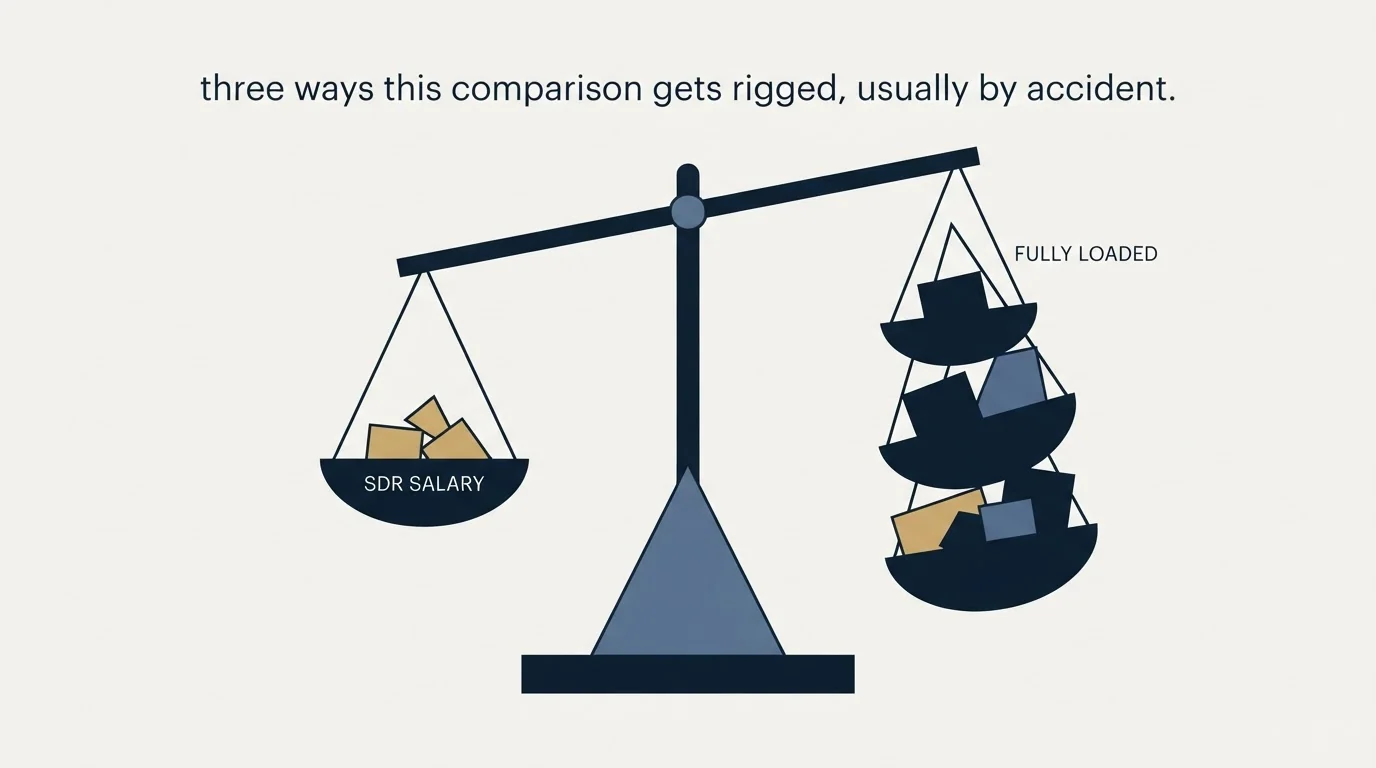
Loaded against unloaded. The in-house column gets the full treatment above and the vendor column gets a retainer figure. Vendor retainers already include recruiting, management, tooling and turnover. Either load both sides or load neither.
Management counted once. Teams add coaching time to the in-house column and then forget that an outsourced programme also needs somebody on your side reviewing copy, reading replies and approving targeting. It is less time, and it is not zero.
Year one against steady state. Year one carries recruiting and onboarding, steady state does not. Both are legitimate numbers and they answer different questions. Say which one you are showing, and use the same one on every column.
There is also a quieter version, which is comparing a fully loaded seat against an automation stack while pricing only the software. Somebody operates that stack, and their time is a line item on the same worksheet. The build-versus-buy version of this arithmetic, with the alternatives priced out, is in outsourced SDR versus in-house and SDR cost versus an automation stack. If the comparison is against a vendor, the billing unit changes what you are comparing before any figure is involved, which is covered in outsourced SDR pricing, and the staffing shapes behind those quotes are in SDR outsourcing.
What the number is actually for
A fully loaded figure is not a reason to avoid hiring. Plenty of teams run this worksheet and hire anyway, because they want a bench to promote from, or because their sales cycle needs the same person from first touch to close, or because their market is small enough that relationship depth beats volume. Those are good reasons and they survive an honest cost model.
What the worksheet prevents is the specific failure of approving a seat against a partial number and then discovering the rest of it a quarter later, at which point the decision has already been made and the only remaining options are bad ones. Build the number before the decision, with your own inputs, and write the assumptions in the cells so the next person can argue with them.
The short version

There is no useful national SDR salary number, and the source that could give you one blocks automated access, so build your own from postings that disclose ranges, two recruiter conversations and your last two offers. Then add the six things a salary cell leaves out: variable compensation at a stated attainment assumption, your payroll provider's actual burden rate, per-seat tools and data taken from real invoices, management time at the manager's loaded cost, and hiring cost spread across the tenure you actually observe. Divide the total by productive months rather than by twelve, because ramp and turnover remove months you paid for. Then compare only against equally loaded alternatives, on the same year-one or steady-state basis.
If the comparison sends you toward buying meetings rather than building a team, RevenueFlow is paid on attended meetings that meet criteria agreed in writing before launch. You can see what a campaign would look like for your market.
No salary or compensation figures are stated in this article. The Bureau of Labor Statistics returns HTTP 403 to automated requests, so its wage data could not be verified at source as of mid-2026. Build your figures from your own market and confirm them directly.
Frequently asked questions.
Frequently asked questions- What is a fully loaded SDR cost?
- Everything a seat consumes rather than pay alone. Base salary, variable compensation at a stated attainment assumption, employer payroll taxes and benefits, per-seat tools, data credits, mailboxes and a CRM licence, management and coaching time valued at the manager's own loaded cost, and the cost to hire spread across the tenure you actually observe.
- Why does this article not give a salary figure?
- Because sales development pay swings by city, by industry margin, by seniority within the same title, and by how much of the package is variable. The authoritative public source, the Bureau of Labor Statistics, blocks automated retrieval, so nothing could be verified at source. Quoting an unchecked aggregator figure that would be wrong for most readers is worse than giving the method.
- Where do you get the inputs?
- Base pay from job postings in your market that disclose a range, from two recruiter conversations, and from your own last two offers. Burden rate from your payroll provider, which is a five-minute question with an exact answer. Tools and data from last quarter's invoices divided by seats. Ramp and tenure from asking your existing team how long theirs took.
- How do you compare a hire against an agency?
- Load both sides or neither. A retainer already includes the rep, the person managing them, the data, the sending infrastructure, recruiting and the cost of replacement. Count management on both sides, since an outsourced programme still needs someone reviewing copy and approving targeting. And say whether you are showing year one or steady state, then use that basis in every column.
About the author.

B2B cold email experts helping companies generate qualified leads through done-for-you outreach campaigns.
RevenueFlow Team
Explore more.
Ready to scale your outreach?
We build GTM engines that book real meetings. See the receipts.
Related articles.
SDR Role Definition: The Work Automation Left
List building, enrichment, sequencing, data entry and first-draft personalisation have moved. What remains is judgment, which changes how you scope the seat.
Inbound vs Outbound Sales: How the Two Motions Differ
Inbound and outbound sales compared as motions: what the rep knows at first touch, what each costs, the team each needs, and the metrics that belong to each.
Readymode Pricing: The Seat Is Dear for What Is Inside It
Readymode publishes $199 and $249 per licence per month, near the top of the dialer range. What the seat includes that others bill separately, and when that pays.
PhoneBurner Pricing: What the Seat Price Covers
PhoneBurner publishes all three seat prices in both billing states. The metered resource is contact imports, not minutes, and the spam layer is an add-on at every tier.
Multi-Threading in Sales: Who the Second Contact Should Be
Six contacts on an opportunity and one real relationship is still single-threaded. Which second person to add, when to ask, and how to tell whether it worked.
Koncert Dialers: Line Counts Published, Price Is Not
Koncert publishes the parallel line ceiling on every tier, which most of this category will not. It publishes no price. What its pages state, and what the quote decides.