Sales KPI Meaning: Which Numbers Change a Decision
A KPI is a metric with a decision, a target and an owner attached. The admission test, the leading and lagging split, and why most disputes are about denominators.
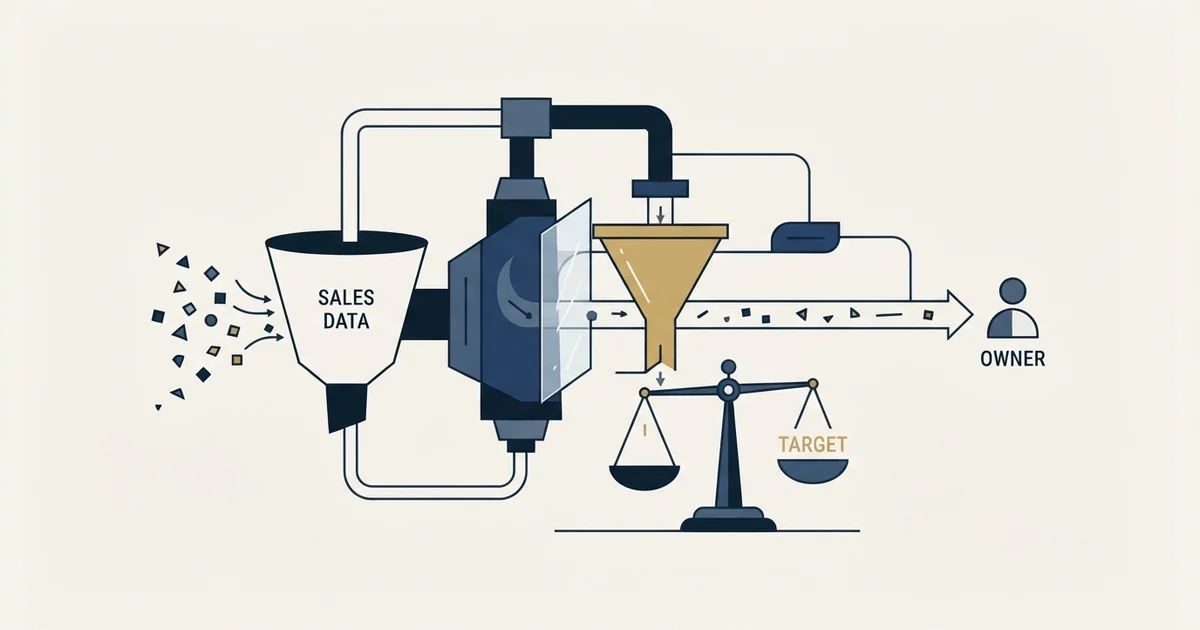
A sales KPI is a metric promoted because somebody acts on it, which means it carries a decision, a target and a named owner. Everything else is a metric and belongs in a report. A workable set spans leading, lagging and diagnostic numbers, and each one is read beside a companion figure.
Key takeaways
- A metric is any number you can compute. A KPI has a decision attached, a target that came from somewhere, and one named owner. Adding a metric costs nothing and adding a KPI costs attention, which is why undisciplined dashboards grow until nobody reads them.
- Carry leading, lagging and diagnostic numbers together. A set of lagging figures reports history accurately and arrives a full sales cycle after the decisions that produced it, which is too late to change the quarter it describes.
- Most disagreements about a sales KPI are disagreements about its denominator. Conversion measured from contacts reached, contacts who replied, meetings booked and meetings held produces four defensible numbers, and the spread is usually wider than any improvement a team could deliver.
- Targets should come from your own history on a stable definition, or from the arithmetic of the plan. Benchmark tables aggregate companies whose definitions you cannot inspect, and the definitional variation is normally wider than the differences the table claims to show.
Reviewed and updated September 2, 2026
A sales dashboard with twenty-two numbers on it is read the same way every week: somebody scans for whichever figure moved most, says something about it, and the meeting moves on. The number that would have explained the quarter is on the second screen, because it moves slowly and nobody put it near the top.
The word KPI is doing quiet work in that sentence. Key performance indicator means a metric that has been promoted, out of the hundreds a CRM can produce, because somebody will act on it. Most dashboards have never made that promotion explicitly, which is why they grow.
Sales KPI metrics and sales KPIs are the same request, and the useful answer is not a longer list but the small set that survives contact with a team compensated on them.
The distinction the acronym is carrying
A metric is any number you can compute. A KPI is a metric attached to a decision, a target and an owner. The gap between those two definitions is where dashboards go wrong, because adding a metric costs nothing and adding a KPI costs attention, which is finite.
Three things have to be true before a number earns the label.
Somebody acts on it. Not reviews it. Acts on it, differently, depending on what it says.
It has a target that came from somewhere. A number with no expected value cannot be missed, so it cannot prompt anything.
Deciding where that expected value may come from is a separate question, and the test separating a goal from a wish sets the bar it has to clear.
One person owns it. A KPI owned by a team is owned by nobody, and it will be explained rather than moved.
- Yes: Name the decision that changes if this number is high rather than low
- Yes: State the target, and where the target came from
- Yes: Name the one person who owns it
- Yes: Write the definition, including the exact denominator
- Yes: Say how often it is read, and how fast it could plausibly move
- Depends: Name the companion figure that stops it being read alone
- Depends: Name the behaviour it will produce if somebody optimises it directly
The last line is the one most worth writing down. Any number that decides pay or status will be optimised, including in ways nobody intended, and the time to notice that is while choosing the number rather than two quarters later.
Leading, lagging, and the diagnostic in between
Sales numbers fall into three jobs, and a dashboard carrying only one job is blind in a specific way.
- New pipeline created in the period
- Qualified conversations booked
- Accounts newly worked
- Tells you about next quarter, not this one
- Weak as a judgement of a person, strong as an early warning
- Closed revenue and quota attainment
- Win rate over a completed cohort
- Average deal size realised
- The numbers the business is actually judged on
- Arrive a full sales cycle after the decisions that produced them
- Stage conversion and time in stage
- Loss reasons from a fixed list
- Meeting-to-opportunity conversion
- Rarely targeted, frequently decisive
- The set that says which of the other two to act on
The pairing is what makes any of them readable. Closed revenue alone says a quarter was short. Closed revenue beside pipeline created says whether the shortfall started this quarter or three months ago, which decides whether the response is a selling problem or a supply problem. Win rate beside average deal size says whether a rising conversion rate reflects better selling or a quiet drift down-market. Pipeline coverage beside win rate says whether a coverage ratio that looks healthy actually is, since the conventional multiple is a claim about a conversion rate that varies enormously between teams.
Activity numbers, and where they turn into theatre

Activity counts are the easiest numbers to produce and the easiest to satisfy without anything happening. They have a genuine job: they are the only numbers available for a seller who has not been in the seat long enough to produce outcomes, and they are a fast read on whether a new motion is being executed at all.
They stop working the moment they become the thing being rewarded. A count of logged contact attempts is satisfied by logged contact attempts. A count of accounts worked is satisfied by opening records. The failure is not laziness; it is that the instruction was literal and the person followed it.
Where activity numbers are carried, the useful form is a ratio rather than a count. Attempts per qualified conversation says something about targeting and message quality. Attempts alone says something about the number of hours in a week. Our own position narrows this further: we run one message per campaign and treat a later approach as a new campaign with its own reason to exist, so repeated attempts on the same contact are not a lever available to us, and volume has to come from coverage and targeting instead. A KPI counting repeat attempts on a worked list is measuring a practice we do not run.
Most KPI arguments are denominator arguments
Two people quoting the same KPI at different values are usually both computing correctly, over different populations.
Conversion rate is the clearest case. Conversion from what: every contact reached, every contact who replied, every meeting booked, or every meeting held. Each is defensible, each produces a different number, and the gap between the widest and narrowest reading is normally larger than any improvement a team could deliver in a quarter. The same problem sits inside conversion rate as a concept and inside every cost-per metric that divides spend by a count of something whose definition is local. Cost per lead is the version of this that costs companies real money, because a cheaper number is often just a looser definition of lead.
Deciding which conversion stage to trust gets harder when a lead clears every filter yet never buys, the exact pattern examined in the tire kicker prospect problem.
The defence is unglamorous and it works: write the definition, date it, and version it. When a KPI moves, the first question is whether the population changed or the ruler did, and a dated definition answers it in seconds instead of in a meeting.
Where the target comes from

A KPI without a target is a chart. The temptation is to take the target from a published benchmark table, and that is where most of the value leaks out. Benchmark tables aggregate companies with different segments, contract sizes, cycle lengths and definitions, and the definitional variation alone is usually wider than the differences the table is claiming to show. No benchmark figures are published here for that reason.
Targets that survive scrutiny come from one of two places. The first is your own history, read as a trend on a stable definition: the question is whether this is better than the same team measured the same way last period. The second is derivation from the plan: if the business needs a given number of new customers, and the conversion chain is known, the required volume at each stage falls out of the arithmetic rather than out of a comparison. That derivation is also the honest way to discover that a plan requires a conversion rate the team has never achieved.
What qualified has to mean when money depends on it covers the definitional half of this at the point where it is most contested, which is the boundary between a meeting and a qualified meeting.
A workable set
An inside sales team asking which KPIs to track is asking this question under another name, and the answer does not change with the seat: the set below is the workable one, and activity counts stay diagnostic rather than becoming the target.
Most sales teams can operate on a handful of numbers, carried consistently, and read in pairs.
One leading figure on supply, which is new qualified pipeline created. One lagging figure on outcome, which is closed revenue against plan, read beside quota attainment to keep the plan itself in view. One diagnostic on movement, which is stage conversion held against time in stage. One quality figure on the front of the funnel, which is meeting-to-opportunity conversion, and one cost figure, which is the fully loaded cost of a booked meeting rather than the platform's version of it.
That set fits on one screen, each number has an owner, and each has a companion. Adding a twelfth number to it should require removing one, which is the only rule that reliably keeps a dashboard readable.
Asked for examples of KPIs for a sales team, that is the list, and its shortness is the point rather than an omission: every addition spends attention, which is the finite resource a dashboard is actually rationing.
The reading interval matters as much as the selection. A metric read weekly that can only move quarterly produces noise and a standing invitation to explain variance that is not there. Read leading indicators weekly, lagging ones per period, and diagnostics when a gap needs explaining rather than on a schedule.
Where the numbers come from and who owns them is the design question underneath all of it, and it is worth settling before any tooling is bought, since a platform installed over unclear definitions reports the same confusion more attractively.
Reading them for outbound specifically

Outbound sits at the leading end, which changes what a gap means. Conversations started this week are next quarter's closed revenue in any business whose cycle runs longer than the period, so treating outbound as an in-period repair produces rushed targeting and a set of opportunities that raise the ratios without closing.
The two numbers that connect it to everything downstream are meeting-to-opportunity conversion and the reason distribution for meetings that do not convert. The first says whether the meetings are the right meetings. The second says what to change, and only when the reasons come from a fixed list, because free-text reasons cannot be counted. Reasons that concentrate on seniority or company fit are an instruction for the targeting. Reasons that concentrate on timing are usually an instruction about the segment.
When sales assist should intervene explains the human layer that removes friction from a purchase already forming inside product-led accounts.
What a qualified meeting actually costs is the benchmark worth holding against your own figure, computed on your definition rather than on a table. Where the reading says the constraint is supply, that is the half we run, priced on attended meetings that meet criteria agreed in writing before launch. See what a first campaign produces.
The short version
A KPI is a metric with a decision, a target and an owner attached. Everything else is a metric, and metrics belong in reports rather than on dashboards.
Carry a small set that spans leading, lagging and diagnostic, and read each one beside a companion, because almost every sales number is ambiguous alone. Write and date every definition, since most disagreements about a KPI are disagreements about its denominator. Derive targets from your own history or from the plan rather than from a benchmark table built on definitions you cannot see. Treat activity counts as ratios rather than volumes, and assume that any number attached to pay will be optimised exactly as written.
Frequently asked questions.
Frequently asked questions- What is the difference between a sales KPI and a sales metric?
- A metric is any number the system can produce. A KPI is one that has been promoted because a person will act on it, which means it needs a decision it changes, a target it can be missed against, and a single owner. A number failing those tests belongs in a report rather than on a dashboard.
- How many sales KPIs should a team track?
- Few enough to fit on one screen and be read in pairs, which for most teams means around five. One leading figure on supply, one lagging figure on outcome, one diagnostic on movement, one quality figure at the front of the funnel and one cost figure. Adding another should require removing one.
- Are activity metrics good sales KPIs?
- They are useful as early signals and for sellers too new to produce outcomes, and they turn into theatre the moment they decide pay. A count of touches is satisfied by touches. Where activity numbers are carried, express them as ratios such as attempts per qualified conversation rather than as raw volumes.
- Where should sales KPI targets come from?
- From your own trend on a dated definition, or derived from the plan. If the business needs a given number of new customers and the conversion chain is known, the required volume at each stage falls out of the arithmetic. That derivation also exposes when a plan assumes a conversion rate the team has never achieved.
About the author.

B2B cold email experts helping companies generate qualified leads through done-for-you outreach campaigns.
RevenueFlow Team
Explore more.
Ready to scale your outreach?
We build GTM engines that book real meetings. See the receipts.
Related articles.
Win Rate Benchmarks: Which Figures State a Population
A catalogue of the published average sales win rates, sorted by whether the page names the population behind its own number. Most do not.
Sales Cycle Length Benchmarks: What Each Figure Counts
The published B2B sales cycle benchmarks, sorted by what each page says it counted. The same number means two different things in two of them.
Sales Enablement Charters: What the Published Ones Ask For
Six publishers set out what a sales enablement charter should contain. Five describe a document nobody can check, and one writes a definition with inspection in it.
Sales Kickoff Agendas: Five Published, Session by Session
Five publishers print a sales kickoff agenda. They agree on four blocks and disagree on session length, rehearsal and where the agenda comes from.
Sales Comp Plan Design: What the Publishers Prescribe
Four publishers set out how to design a sales compensation plan. Here are their procedures, their components, and which of their ratios carry a population.
MEDDIC vs BANT: What Each Qualifies and When to Use Which
MEDDIC and BANT from the originators' own text: IBM's BANT form as a gate after the first call, PTC's six themes as an audit of a live deal, and when to run each.