Cost Per Lead B2B: How to Calculate It and Why It Misleads
Both terms in the formula are choices. How to pick a numerator tier and a lead definition, and why the metric still rewards cheap leads over good ones.
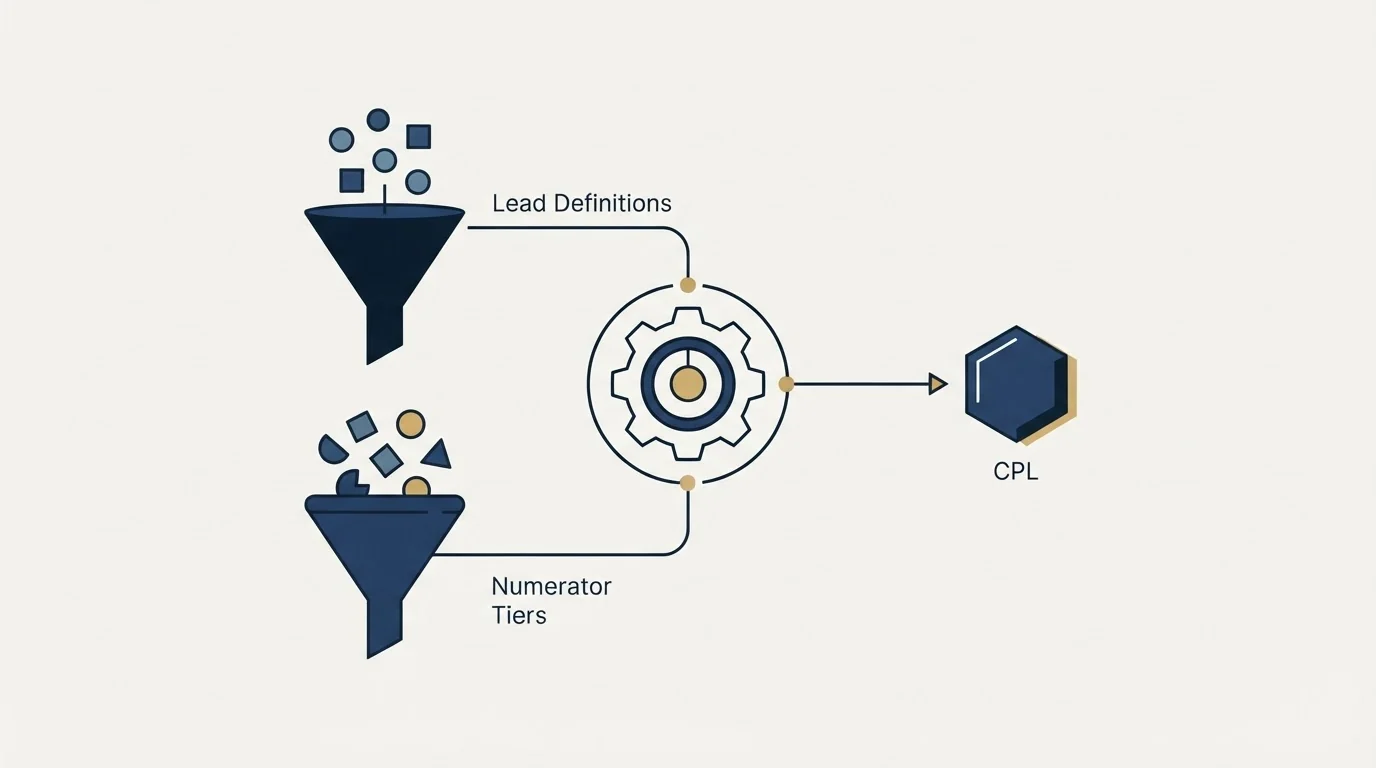
Cost per lead is total cost divided by lead count over a period, and both terms are choices rather than facts. Pick a numerator tier, direct spend, spend plus vendors and tools, or fully loaded, write it next to the number, and filter the denominator against written criteria.
Key takeaways
- Three numerator tiers are defensible, and reporting one while implying another is the most common way a cost-per-lead figure misleads its own author.
- The denominator should count only leads that would survive the same filter you apply before handing one to a rep.
- Any action that raises the lead count faster than the cost improves the metric, which is why lowering the qualification bar looks like progress.
- Cost per meeting held and cost per opportunity resist gaming, because the qualifying event depends on something the buyer did.
Reviewed and updated September 2, 2026
A board asks for cost per lead. Two people produce the number from the same quarter and the answers differ by a factor of four. One divided media spend by form fills. The other divided total go-to-market cost, including salaries, by the leads a rep actually accepted. Neither of them did anything dishonest, and both numbers were labelled "CPL" in a slide.
That gap is the whole story of this metric. The formula has two terms and both of them are choices, so a CPL figure without its definition attached carries almost no information. This piece covers how to compute it so that it means something, the ways both terms drift without anyone intending it, why the metric misleads even when computed carefully, and which measures survive the same scrutiny.
An average cost per lead published by industry is an average over lead definitions you cannot inspect, which is why two companies quoting the same figure are rarely buying the same thing.
The cost per lead formula is total spend over lead count for the same period, and everything contested about the metric sits inside those two words rather than inside the division.
Cost per lead marketing reporting fails in the same place whatever channel produced the lead, because the numerator tier and the lead definition are both choices rather than facts.
A published cost per lead benchmark was computed on somebody else's definitions, cost tiers and funnel positions, none of which you can see, so comparing against one tells you about the two definitions rather than about the two programmes.
Published cost per lead by industry tables are the most requested version of this number and the least usable one, because every row was computed on a different company definition of both terms.
An average cost per lead by industry is therefore an average of averages taken over populations nobody described, which is why what follows is the arithmetic for building your own figure rather than a table to copy.
A cost per lead programme run through an affiliate or partner network inherits both problems in this page at once, because the network sets the lead definition and you inherit the denominator.
Cost per lead for SaaS is the most commonly benchmarked version of this number, and it varies more with where a company draws the lead line than with the fact that it sells software.
Cost per acquisition is the same arithmetic with the qualifying event moved further down that chain, which is why the two numbers are not comparable and are routinely reported as if they were.
The formula, and the two arguments hidden inside it
Cost per lead is total cost divided by number of leads over a period. The arithmetic is trivial. The arguments are about what goes in each term.
An average cost per lead is that same division taken across a period or a population rather than a single campaign, which inherits both arguments below and adds a third, since averaging over channels with different lead definitions produces a figure describing none of them.
What belongs in the numerator
There are three defensible answers, and the trouble starts when a company uses one of them and reports it as though it were another.
Direct spend only. Media, data, list purchases, the cost of the specific channel activity. Cheap to compute and comparable month to month within one channel. It says nothing about whether the channel is affordable, because it excludes the people running it.
Direct spend plus tooling and vendor fees. Adds the sending platform, the data provider, the agency retainer, the contractor. This is the most common tier in practice and the most commonly misreported, because tooling shared across channels has to be apportioned somehow and the apportionment is usually a guess nobody wrote down.
Fully loaded. Everything above plus the people cost of the time spent on that channel, plus the amortised cost of content produced for it. This is the only tier that supports a decision about whether to keep running a channel, and it is the one that makes internally-run channels stop looking free.
Building the people component honestly is mechanical. Take base compensation for the role in your market, add payroll taxes and benefits, add the tooling seats and the share of management time that role consumes, then multiply by the fraction of that person's time genuinely spent on the channel. Use wage data for your own market rather than a figure from a blog; in the United States the Bureau of Labor Statistics Occupational Employment and Wage Statistics programme is the authoritative free source. The multiplier over base pay varies by country and by benefits structure, which is exactly why you compute it from your own payroll rather than borrowing somebody's rule of thumb.
- Includes: ad spend, list and data costs
- Excludes: tools, people, content
- Good for: week-to-week movement inside one channel
- Fails at: telling you whether the channel is affordable
- Bias: makes people-heavy channels look free
- Adds: platform subscriptions, agency retainers, contractors
- Excludes: internal salaries and content production
- Good for: comparing an outsourced channel against its own history
- Fails at: comparing outsourced against in-house
- Bias: penalises anything with a visible invoice
- Adds: salaries and benefits, apportioned management time, amortised content
- Excludes: nothing material
- Good for: keep-or-kill decisions and build-versus-buy
- Fails at: being quick to produce
- Bias: none worth naming, but it needs discipline to keep stable
Whichever tier you pick, the rule is the same: name it, write it next to the number, and do not change it mid-year. A CPL that improved because the definition narrowed is the most common false victory in marketing reporting.
What counts in the denominator
The denominator is where the real damage happens, because "lead" is not a defined term and every company defines it slightly differently.
The workable rule is that the denominator counts leads that survive the same filter you would apply before handing one to a rep. That means removing duplicates, existing customers, active opportunities, competitors, students and job seekers, obviously fake submissions, and anyone outside the segment you sell to. If a record would embarrass you when a rep opened it, it should not be inflating the denominator.
This is where the metric collides with the MQL and SQL vocabulary, and the collision is worth handling explicitly rather than by convention. Cost per form fill, cost per MQL and cost per sales-accepted lead are three different metrics with the same name, and they can differ by an order of magnitude on the same quarter's data. The definitions and the acceptance step that separates them are worked through in MQL versus SQL. Pick the point on that sequence you are measuring, say which one it is, and keep it fixed.
Since the MQL and lead-quality collision is even sharper in product-led motions, see how SaaS demand generation strategy reframes the goal as activation rather than sign-up volume.
The filter itself should come from written criteria rather than from judgement applied after the fact, which means it comes from the same ideal customer profile your targeting uses. A denominator filtered by whoever is building the report this month is not a measurement.
How both terms get gamed without anyone intending it
Nobody sets out to corrupt this number. It happens through ordinary incentives.
The denominator inflates because inflating it is easy and looks like a win. Remove two fields from a form, gate a popular asset that has nothing to do with your product, run a giveaway, or start counting newsletter subscribers as leads. CPL drops, the chart looks good, and the sales team's opinion of lead quality drops with it. This is the single most reliable way to improve the metric and the single most reliable way to damage the business while doing so.
The numerator shrinks because internal effort has no invoice. A channel run by two people already on payroll produces no line item, so it appears cheaper than an outsourced channel of identical output that arrives as a monthly bill. Any build-versus-buy comparison run on unloaded costs will conclude that building is cheaper, every time, before anyone looks at output. The comparison is only meaningful once both sides are fully loaded and both include ramp time, which is the arithmetic laid out in outsourced SDR pricing.
The time bases do not match. This month's spend produced some of this month's leads and will produce more of next quarter's. Content commissioned last year is generating leads now against a numerator that no longer contains it. Longer sales cycles make the mismatch worse. Fixing it perfectly requires cohort tracking; fixing it adequately requires using a period long enough that the lag is small relative to it, which for most B2B companies means a quarter rather than a month.
Attribution assigns shared leads to one channel. A prospect who saw a webinar, read three articles and then replied to an email gets counted once, usually to whichever touch the model favours. Every channel's CPL is then computed from a denominator that a different model would allocate differently. This is unfixable in a strict sense, and the practical response is to treat cross-channel CPL comparisons as directional at best.
Some of those touches never reach a system at all, and buyer conversations that carry no identifier explain why the missing share is structural rather than a tracking failure.
Why the metric misleads even when you compute it honestly
Assume you have done everything above correctly. Three problems remain, and they are properties of the metric rather than of your implementation.
It rewards cheap leads over good ones. CPL is a cost divided by a count, and nothing in it refers to quality. Any action that increases the count faster than the cost improves the metric, and lowering the qualification bar does exactly that. A team managed on CPL will drift towards cheaper, worse leads while every reported number improves. That drift is the metric working exactly as designed, which is what makes it dangerous as a target.
It hides the conversion rate that actually decides the outcome. CPL is one term in a chain, and the terms downstream of it have far more leverage. A channel with double the CPL and triple the meeting rate is cheaper per meeting, and the CPL report says the opposite.
It is not comparable across channels or across companies. A webinar registration and a demo request are both "leads" and they sit at completely different distances from a purchase. A published CPL from another company was computed on their definitions, their cost tiers and their funnel positions, none of which you can see. Benchmarks for this metric are among the least reliable numbers in B2B marketing, and a comparison against one tells you about the two definitions rather than about the two programmes.
Following the arithmetic through
Buyers usually meet this arithmetic as a running total rather than as a rate: a per-lead fee accumulates every time the vendor delivers, so a number that reads as small against one lead reads very differently against a month of them, and the accumulation is what the invoice shows.
The clearest way to see the second problem is to run two channels all the way down. The numbers below are invented to show the shape of the arithmetic, and they are not drawn from our campaigns or from anybody's benchmark data.
| Channel A | Channel B | |
|---|---|---|
| Spend in the quarter | $30,000 | $30,000 |
| Leads | 600 | 200 |
| Cost per lead | $50 | $150 |
| Leads that pass qualification | 60 (10%) | 80 (40%) |
| Cost per qualified lead | $500 | $375 |
| Meetings held | 24 | 48 |
| Cost per meeting held | $1,250 | $625 |
| Opportunities created | 6 | 20 |
| Cost per opportunity | $5,000 | $1,500 |
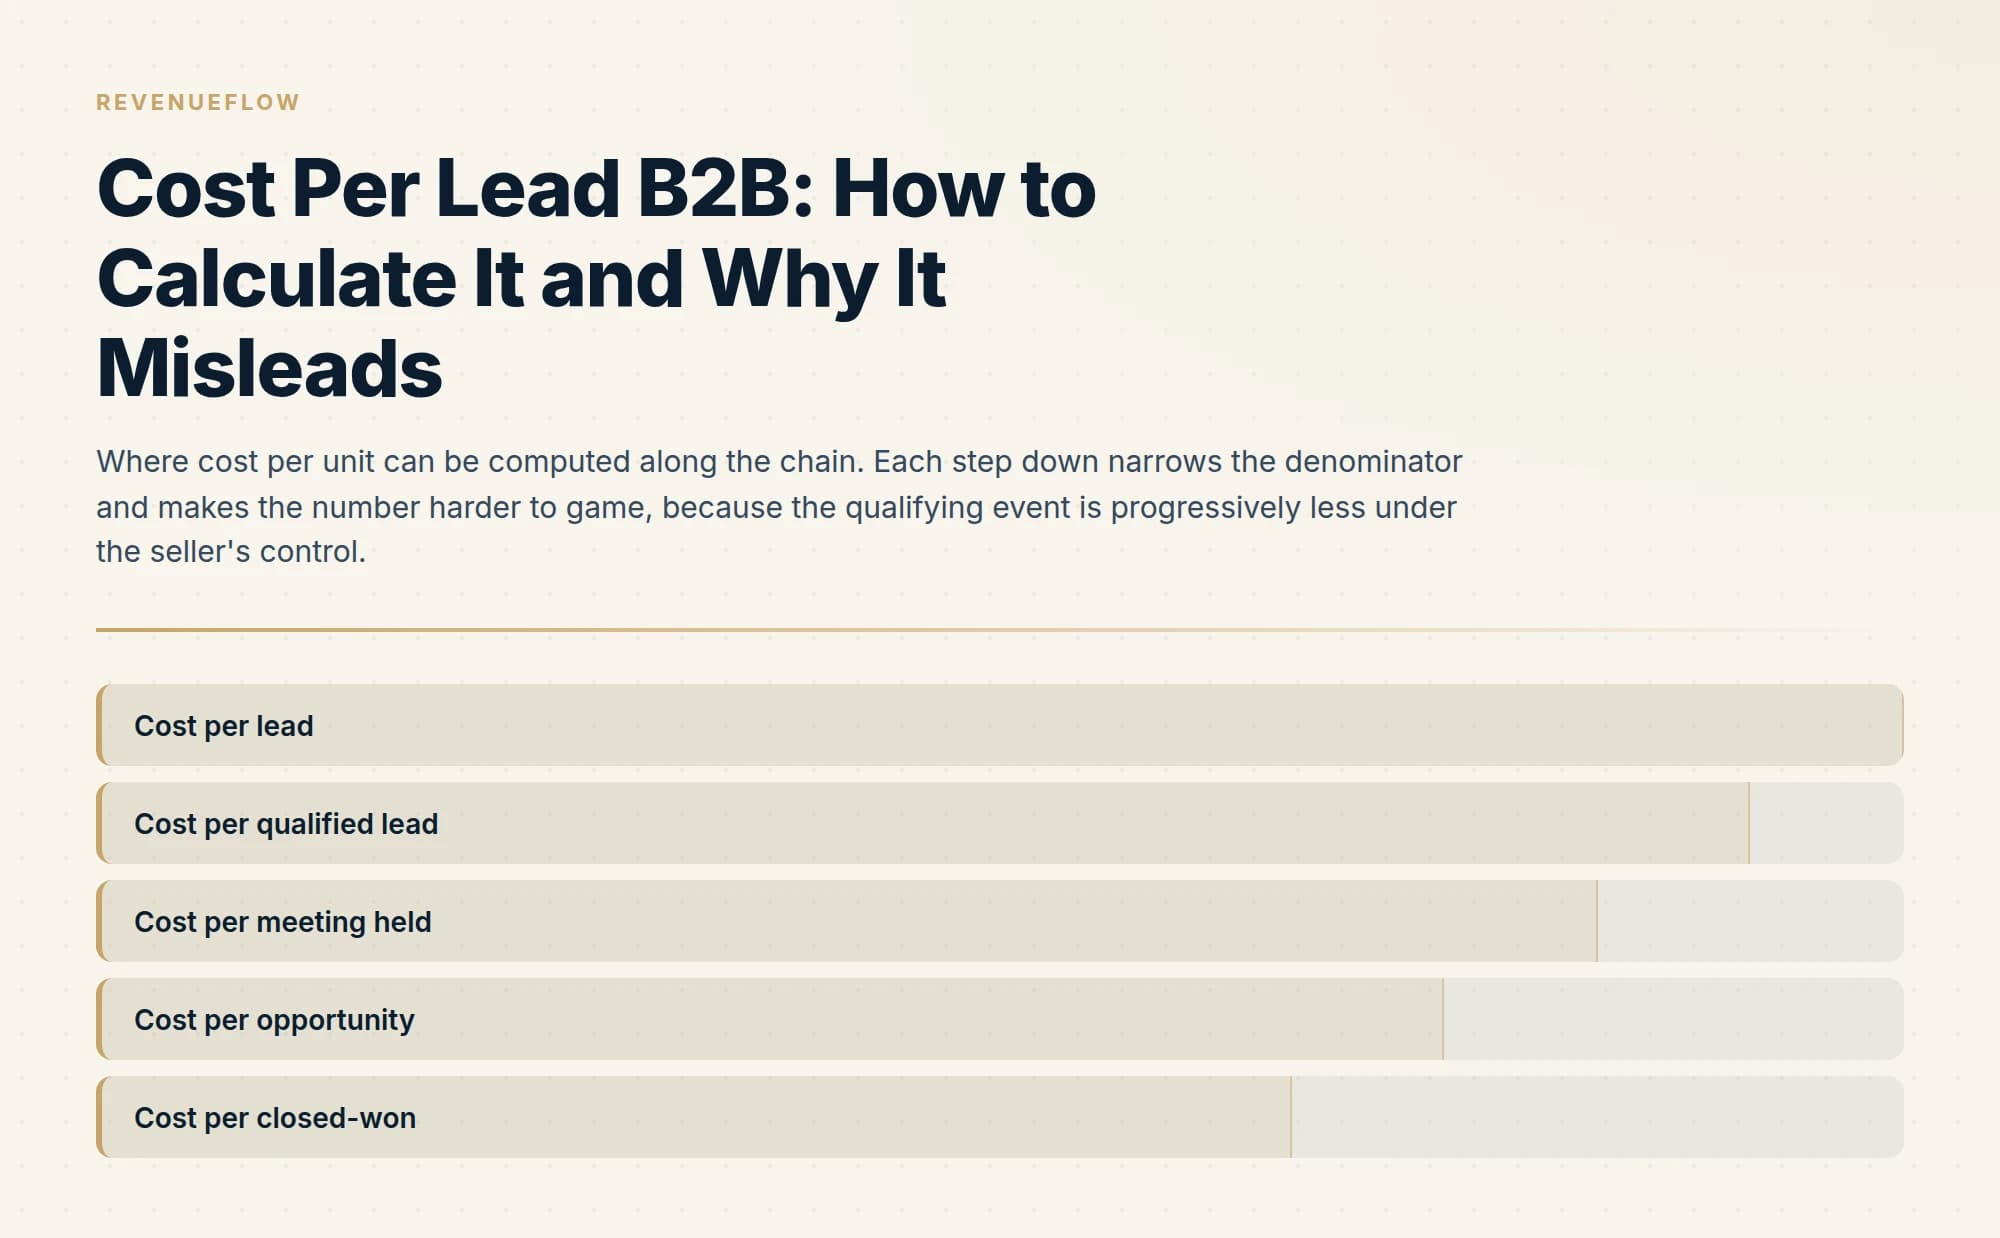
Channel A wins on cost per lead by three to one and loses on cost per opportunity by more than three to one. Every row in that table is arithmetic on the row above it, so nothing has been smuggled in. The reversal happens entirely because the qualification rate and the meeting rate differ, and CPL cannot see either of them.
The general point holds beyond the invented numbers. CPL is the first term in a product, and every subsequent term is a conversion rate. Optimising the first term while ignoring the rest is only rational if the rates are equal across your options, which they almost never are.
Denominator set by your own lead definition. Easiest to compute and easiest to move by changing the definition.
Denominator filtered against written criteria. Removes most of the volume gaming.
Requires the prospect to turn up, which is an event neither you nor a vendor can manufacture.
Requires a rep to accept the deal into pipeline against stage criteria. Comparable across channels.
The honest measure. Arrives one sales cycle too late to steer with, which is why the stages above exist.
The measures that survive scrutiny
Report CPL if you like, and never report it alone. Two companions make it honest.
Cost per qualified meeting, or cost per opportunity. Both push the qualifying event out of the seller's control and onto something the buyer did, which is what makes them resistant to gaming. Cost per meeting held is the earliest point in the chain with that property, and it is available within weeks rather than quarters. Whether you should be buying at that unit at all, and what it does to a vendor's incentives, is the substance of appointment setting versus lead generation, and the market rates involved are covered in the lead generation agency cost guide.
The conversion rate to the next stage, reported in the same row. CPL beside lead-to-meeting rate is a complete statement. CPL alone is half of one. Any presentation that shows a CPL trend without the adjacent conversion trend has made it impossible for the audience to tell improvement from dilution.
- Yes: The numerator tier is written down next to the number
- Yes: The denominator uses a lead definition someone else could apply
- Yes: Duplicates, current customers and out-of-segment records are excluded
- Yes: The period is long enough that spend and leads roughly correspond
- Yes: The conversion rate to the next stage is reported beside it
- Yes: The definition has not changed since the last time it was reported
- No: It is being compared against another company's published figure
- No: It is a target that somebody is compensated on
The last item deserves its own sentence. The moment CPL becomes a target with money attached, the definition becomes a negotiation and the denominator starts growing. Measure it, do not compensate on it.
The short version

Cost per lead is total cost divided by lead count, and both terms are choices rather than facts. Pick a numerator tier, direct spend, spend plus vendors and tools, or fully loaded, and write it next to the number. Build the people component from your own payroll and your own market's wage data rather than a figure from a blog. Filter the denominator against written criteria so it counts only leads that would survive a handoff to a rep, and say which point on the lead-to-accepted sequence you are measuring.
Both terms drift without anyone intending it: denominators inflate because lowering the bar is easy and looks like a win, numerators shrink because internal effort produces no invoice, spend and leads sit on mismatched clocks, and shared leads get assigned to single channels.
Even computed carefully, CPL rewards cheap leads over good ones, hides the conversion rates that decide the outcome, and is not comparable across channels or companies. Follow the arithmetic down to cost per meeting held and cost per opportunity, where the qualifying event depends on something the buyer did, and always report CPL with its next-stage conversion rate beside it. Measure it. Do not pay anyone against it.
We are paid on attended meetings that meet criteria agreed in writing before launch, which puts our own commercial unit at the cost-per-qualified-meeting line of that table rather than the top one. You can see what a campaign would look like for your market.
Frequently asked questions.
Frequently asked questions- How do you calculate cost per lead?
- Divide total cost by the number of leads over a period, then make both terms explicit. Choose a numerator tier and name it: direct spend, spend plus vendors and tools, or fully loaded including salaries and amortised content. Count only leads that pass written criteria, with duplicates, existing customers, competitors and out-of-segment records removed.
- What is a good cost per lead in B2B?
- There is no transferable answer, and published benchmarks are among the least reliable figures in B2B marketing. Another company computed theirs on their own cost tier, their own lead definition and a different point in the funnel, none of which you can see. A comparison against one tells you about the two definitions rather than about the two programmes.
- Why is cost per lead misleading?
- Because it is a cost divided by a count, and nothing in it refers to quality. Anything that grows the count faster than the cost improves it, so a team managed on the metric drifts towards cheaper and worse leads while every reported number gets better. It also hides the conversion rates downstream, which carry far more leverage.
- What should you report instead of cost per lead?
- Report cost per qualified meeting or cost per opportunity, and put the next-stage conversion rate in the same row as any cost-per-lead figure. Both later measures push the qualifying event onto something the buyer did, which makes them resistant to gaming. Measure cost per lead if you want it, and do not pay anyone against it.
About the author.

B2B cold email experts helping companies generate qualified leads through done-for-you outreach campaigns.
RevenueFlow Team
Explore more.
Ready to scale your outreach?
We build GTM engines that book real meetings. See the receipts.
Related articles.
Win Rate Benchmarks: Which Figures State a Population
A catalogue of the published average sales win rates, sorted by whether the page names the population behind its own number. Most do not.
Sales Cycle Length Benchmarks: What Each Figure Counts
The published B2B sales cycle benchmarks, sorted by what each page says it counted. The same number means two different things in two of them.
Cold Calling for Chemical Companies: Who Picks Up
A chemical cold call rarely arrives first. It reaches a formulator who has already been comparing suppliers on a screen, for one of three published reasons.
Cold Calling for Manufacturers: The Desk and the Floor
Cold calling for a manufacturer calling plants and OEMs: who answers the main line, the buyer's desk against the floor, the show calendar, the channel map, the limits.
SDR Outsourcing for Agriculture Companies
Whether an outside sales development team can work for a company selling into agriculture: who already covers the account, which weeks exist, and the show rule.
LinkedIn Outreach for Banks: A Regulated Message
How a bank's relationship managers use LinkedIn to reach business owners: what the FFIEC guidance, FINRA's notices and LinkedIn's own rules require, and where to stop.