How to Build an ICP That Changes Your Target List
Most ICPs never change the target list. Here is the count test, the five inputs, a worked TAM, SAM and SOM example with full arithmetic, and an eight-field worksheet.
A usable ideal customer profile is a set of filters that returns a count from a data provider: firmographics, operational conditions, triggers, buying roles and explicit disqualifiers. TAM multiplies every theoretically addressable company by contract value, SAM narrows to who you can serve, and SOM applies real funnel rates to SAM.
Key takeaways
- An ICP that cannot be entered into a data provider and return a count cannot change the target list.
- Disqualifiers carry the highest return and are the section most teams skip; each one must be a filter or a suppression list.
- In the worked example, 11,000 companies at $24,000 average contract value give a $264 million SAM and a $552,000 first-year SOM, which is 0.2 percent of SAM.
- Adding a hiring trigger cut the list to 4,200 companies and 6,854 contacts, 38 percent of the volume, and produced $672,000 instead of $552,000.
- Score the profile against the last twenty closed-won accounts; if fewer than half would have passed, the profile is aspirational.
- Targeting is the one job automation has not made cheaper to get wrong, because an agent executes a bad list at full speed.
Reviewed and updated September 5, 2026
How to Build an ICP That Actually Changes Your Target List (With TAM Math)
Most ideal customer profiles fail one test: nothing about the target list changes after the document exists. The company still emails the same accounts, because the profile described a personality ("innovative mid-market companies who value growth") rather than a filter that resolves to names.
A working ICP is a set of conditions you can run against a data provider and get a count back. If you cannot get a count, you do not have an ICP yet. This page covers the five inputs that make one operational, the disqualifiers almost everyone skips, a full TAM, SAM and SOM worked example with the arithmetic shown, and a worksheet you can fill in this afternoon.
What follows is the ICP example most teams are looking for when they search for one: a filled-in worksheet with the arithmetic left visible, rather than a blank grid.
An ICP tool, whether a standalone generator or a builder inside a data platform, produces a first draft of fields one to seven. Field eight, the count, is still the deliverable and still yours to check.
ICP stands for ideal customer profile, and the definition worth holding is operational rather than descriptive: it is the set of filters a stranger could re-run to produce the same target list you would.
ICP in marketing and ICP in sales are the same acronym and the same artefact: the profile is a marketing object and a sales object at once, because the filters that build the campaign audience are the filters that build the target list.
The worked example below is the TAM SAM SOM example most searches are after, with the arithmetic left visible rather than summarised.
Teams searching for ICP sales, sales ICP or an ideal customer profile template are all looking for the same exercise, which is deciding in writing which companies are worth a seller's time before anyone builds a list.
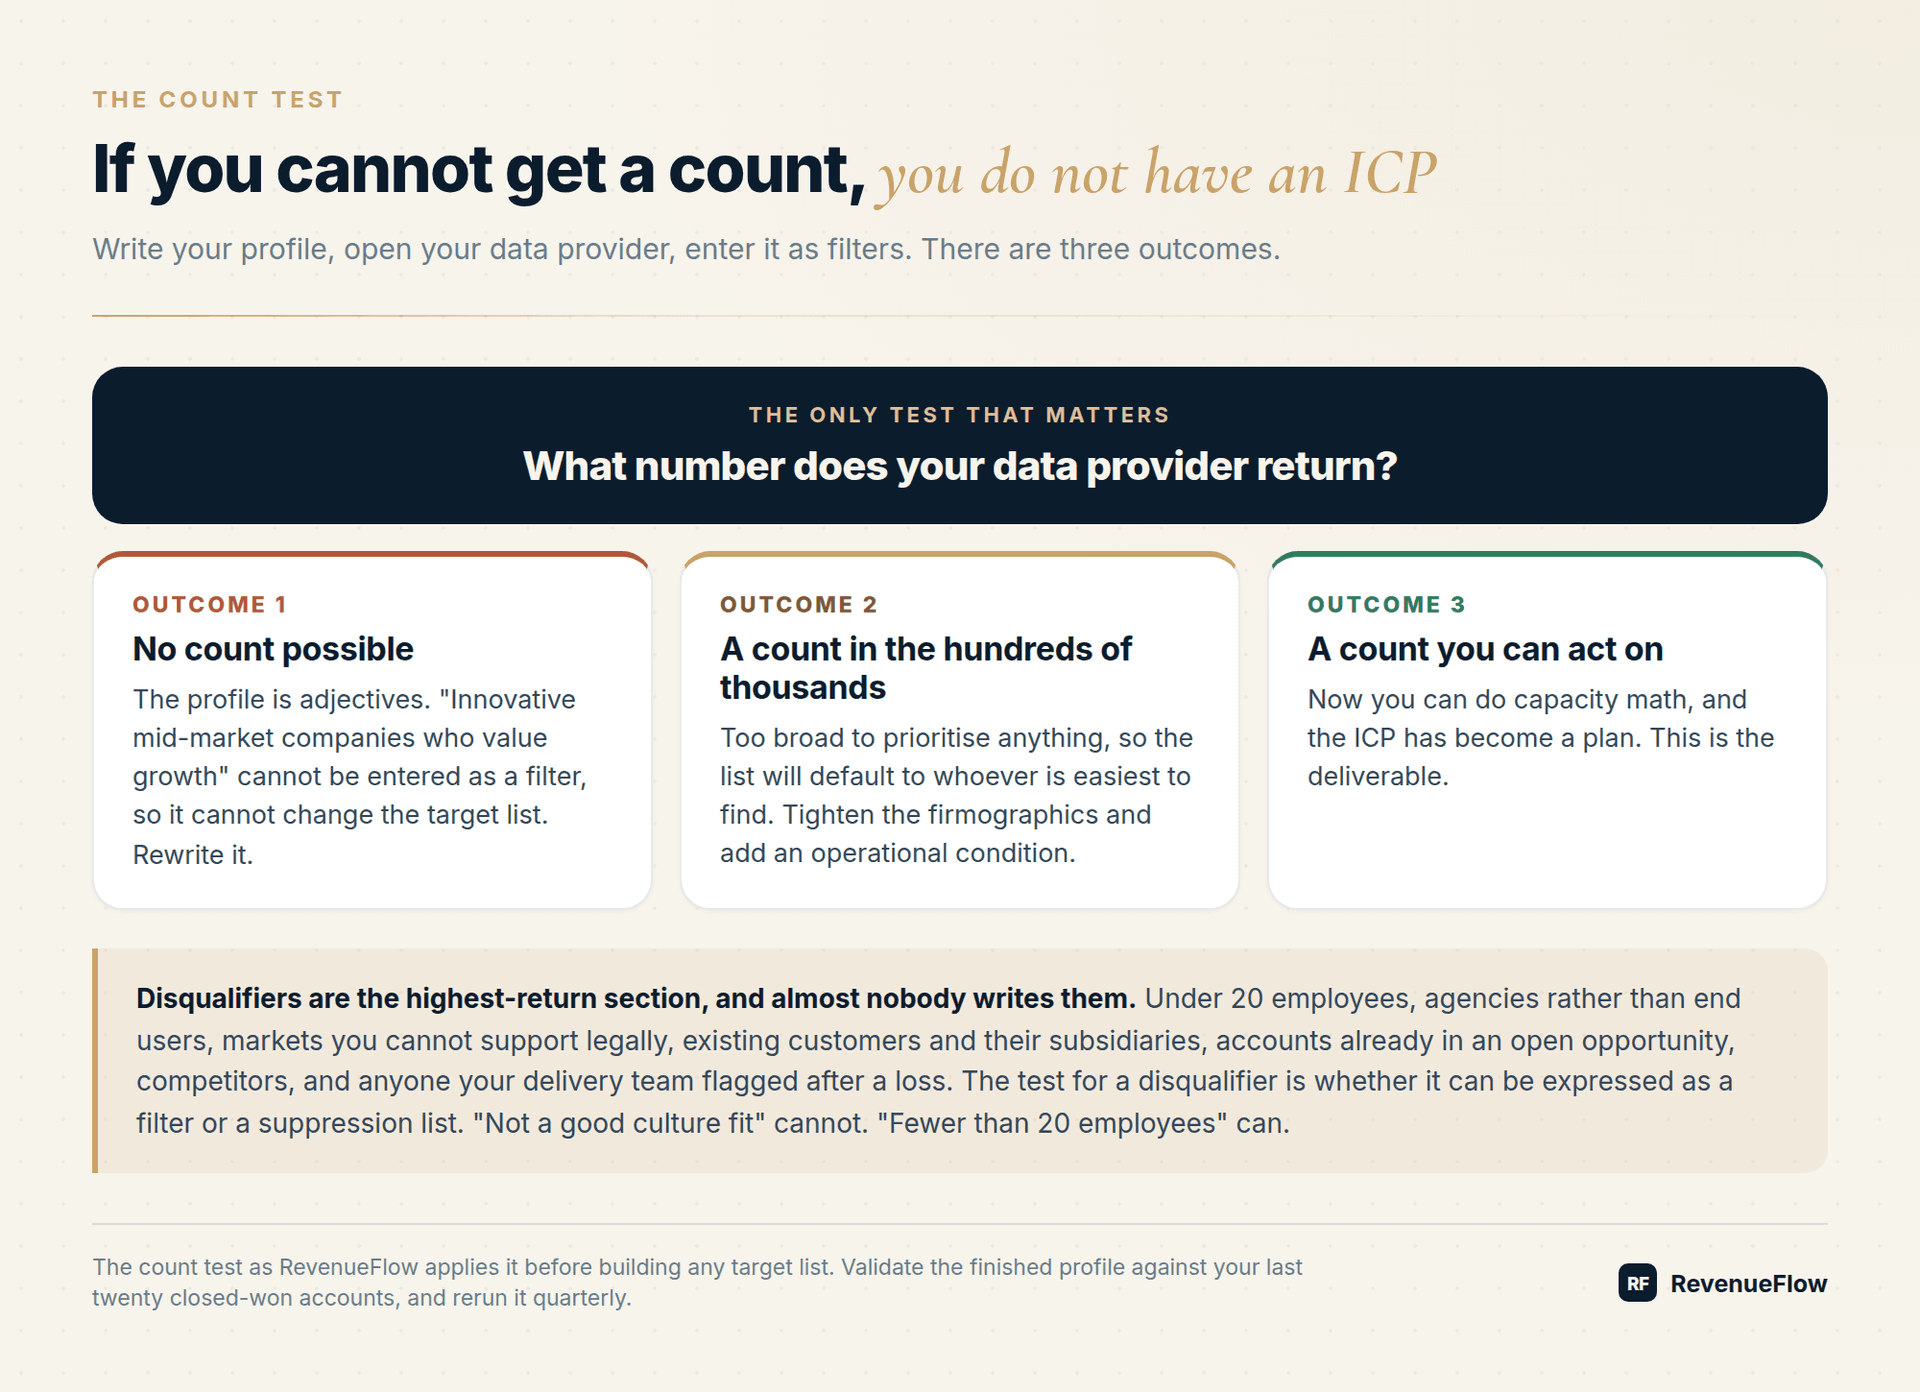
The count test
Write your ICP, open your data provider, and enter it as filters. Three outcomes:
- No count possible. The profile is adjectives. Rewrite it.
- A count in the hundreds of thousands. Too broad to prioritise anything, so the list will default to whoever is easiest to find.
- A count you can act on. Now you can do capacity math, and the ICP has become a plan.
The five inputs
- Yes: Firmographics. Industry, employee band, revenue band, geography, business model.
- Yes: Operational signals. What must be true about how the company works for your product to be relevant.
- Yes: Triggers. What makes this quarter the right quarter.
- Yes: Buying roles. The economic buyer, the champion, and the person who will block.
- Yes: Disqualifiers. The explicit list of who is out.
1. Firmographics. Industry, employee band, revenue band, geography, business model. These are the coarse filters, and they should be tighter than feels comfortable.
2. Operational signals. What must be true about how the company works for your product to be relevant. Runs an outbound motion. Sells to enterprise. Has a field sales team. This input separates a real ICP from a demographic sketch.
3. Triggers. What makes this quarter the right quarter: a hiring post for a role your product supports, funding, a leadership change, a new market. Triggers do not define the ICP, they order it.
4. Buying roles. The economic buyer, the champion, and the person who will block. Named by title, with the expectation that you will reach at least two of the three.
5. Disqualifiers. The explicit list of who is out, covered below.
Disqualifiers are the highest-return section
Every team writes the inclusion criteria. Few write the exclusions, and the exclusions are where most wasted spend lives.
- No: Under 20 employees
- No: Agencies rather than end users
- No: Companies in a market you cannot support legally
- No: Existing customers and their subsidiaries
- No: Accounts already in an open opportunity
- No: Competitors
- No: Anyone your delivery team has flagged as a poor fit after a loss
Useful disqualifiers are concrete: under 20 employees, agencies rather than end users, companies in a market you cannot support legally, existing customers and their subsidiaries, accounts already in an open opportunity, competitors, and anyone your delivery team has flagged as a poor fit after a loss. Each one removes volume that would have consumed sending capacity and produced the wrong meetings.
The test for a disqualifier is whether it can be expressed as a filter or a suppression list. "Not a good culture fit" cannot. "Fewer than 20 employees" can.
TAM, SAM and SOM with the arithmetic shown
This arithmetic is what answers the question buyers ask before signing, which is how many qualified meetings a programme should produce and what range to plan against. The meetings line in the table below is that number, computed from your own list size and your own rates rather than borrowed from a published per-rep band, and the honest output is a range because four estimated rates multiply.
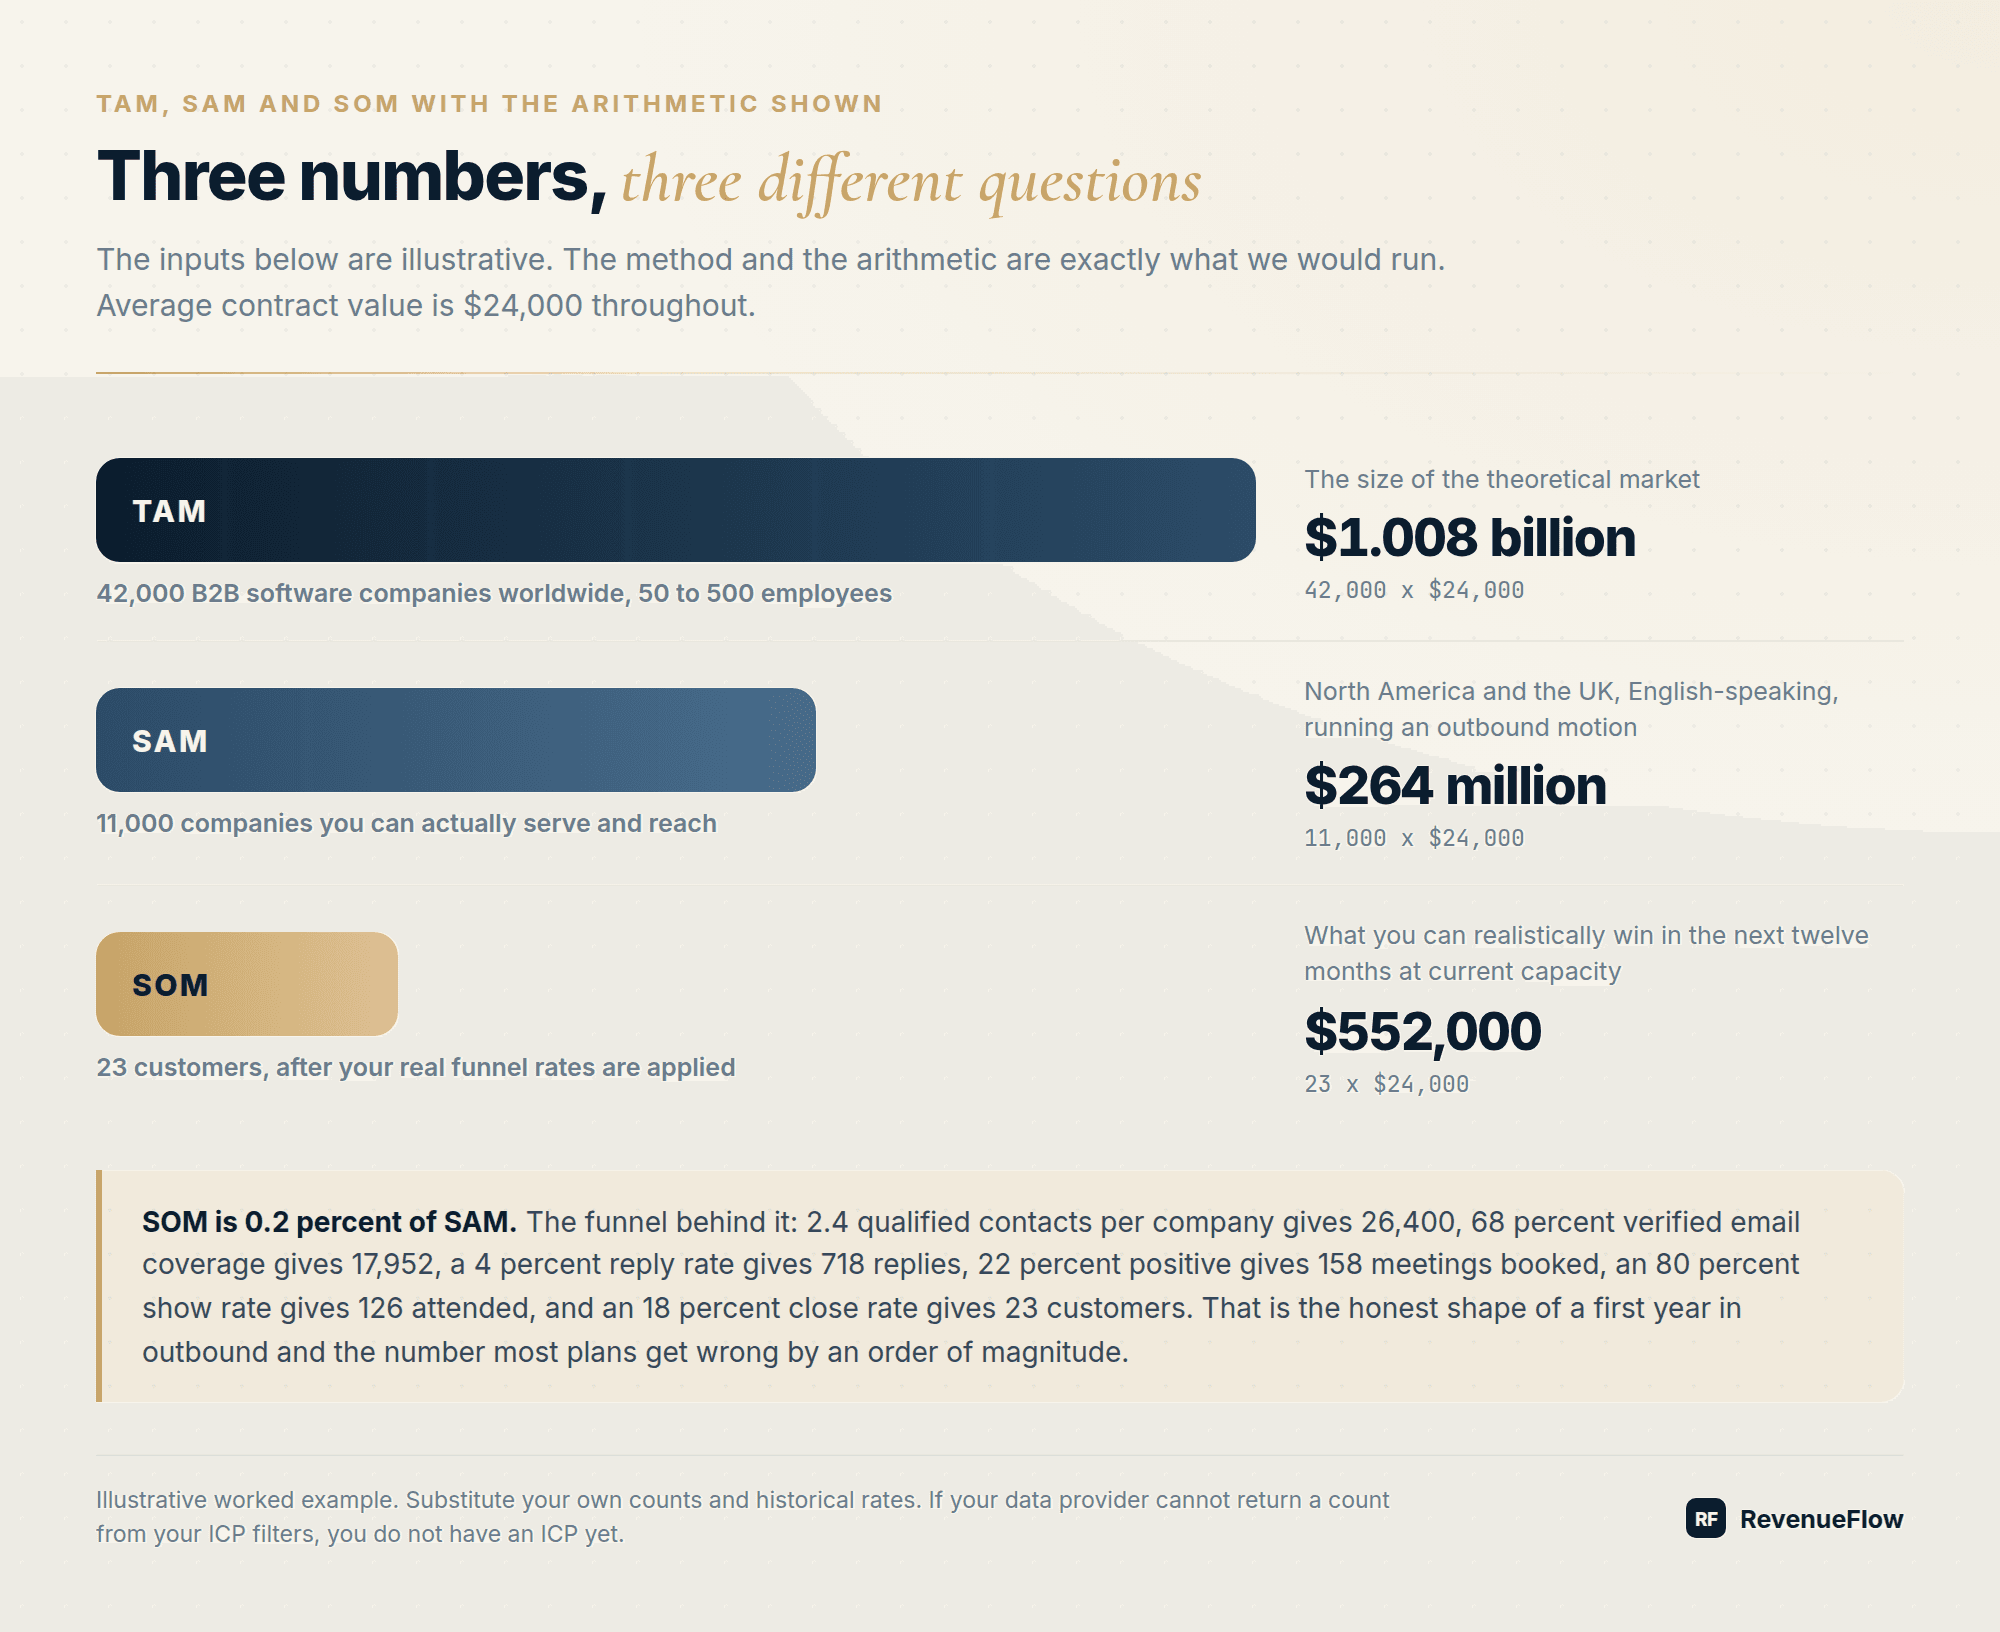
The three numbers answer different questions. TAM is the size of the theoretical market. SAM is the part of it you can actually serve and reach. SOM is what you can realistically win in the next twelve months at your current capacity and conversion rates.
The inputs below are illustrative, but the method and the arithmetic are exactly what we would run. Substitute your own counts and rates.
Step 1: TAM. Suppose your data provider returns 42,000 B2B software companies worldwide with 50 to 500 employees, and your average annual contract value is $24,000.
42,000 x $24,000 = $1.008 billion TAM
Step 2: SAM. Constrain to what you can serve: North America and the UK, English-speaking, and running an outbound motion (detectable through job posts and tooling signals). That filter set returns 11,000 companies.
11,000 x $24,000 = $264 million SAM
Step 3: SOM. Now the funnel arithmetic, using your own historical rates.
| Step | Rate | Result |
|---|---|---|
| Companies in SAM | 11,000 | |
| Qualified contacts per company | 2.4 | 26,400 |
| Verified email coverage | 68% | 17,952 |
| Reply rate | 4% | 718 replies |
| Positive share of replies | 22% | 158 meetings booked |
| Show rate | 80% | 126 meetings attended |
| Close rate | 18% | 23 customers |
| Average contract value | $24,000 | $552,000 SOM |
That is 0.2 percent of SAM, which is the honest shape of a first year in outbound and the number most plans get wrong by an order of magnitude.
The lever the math reveals
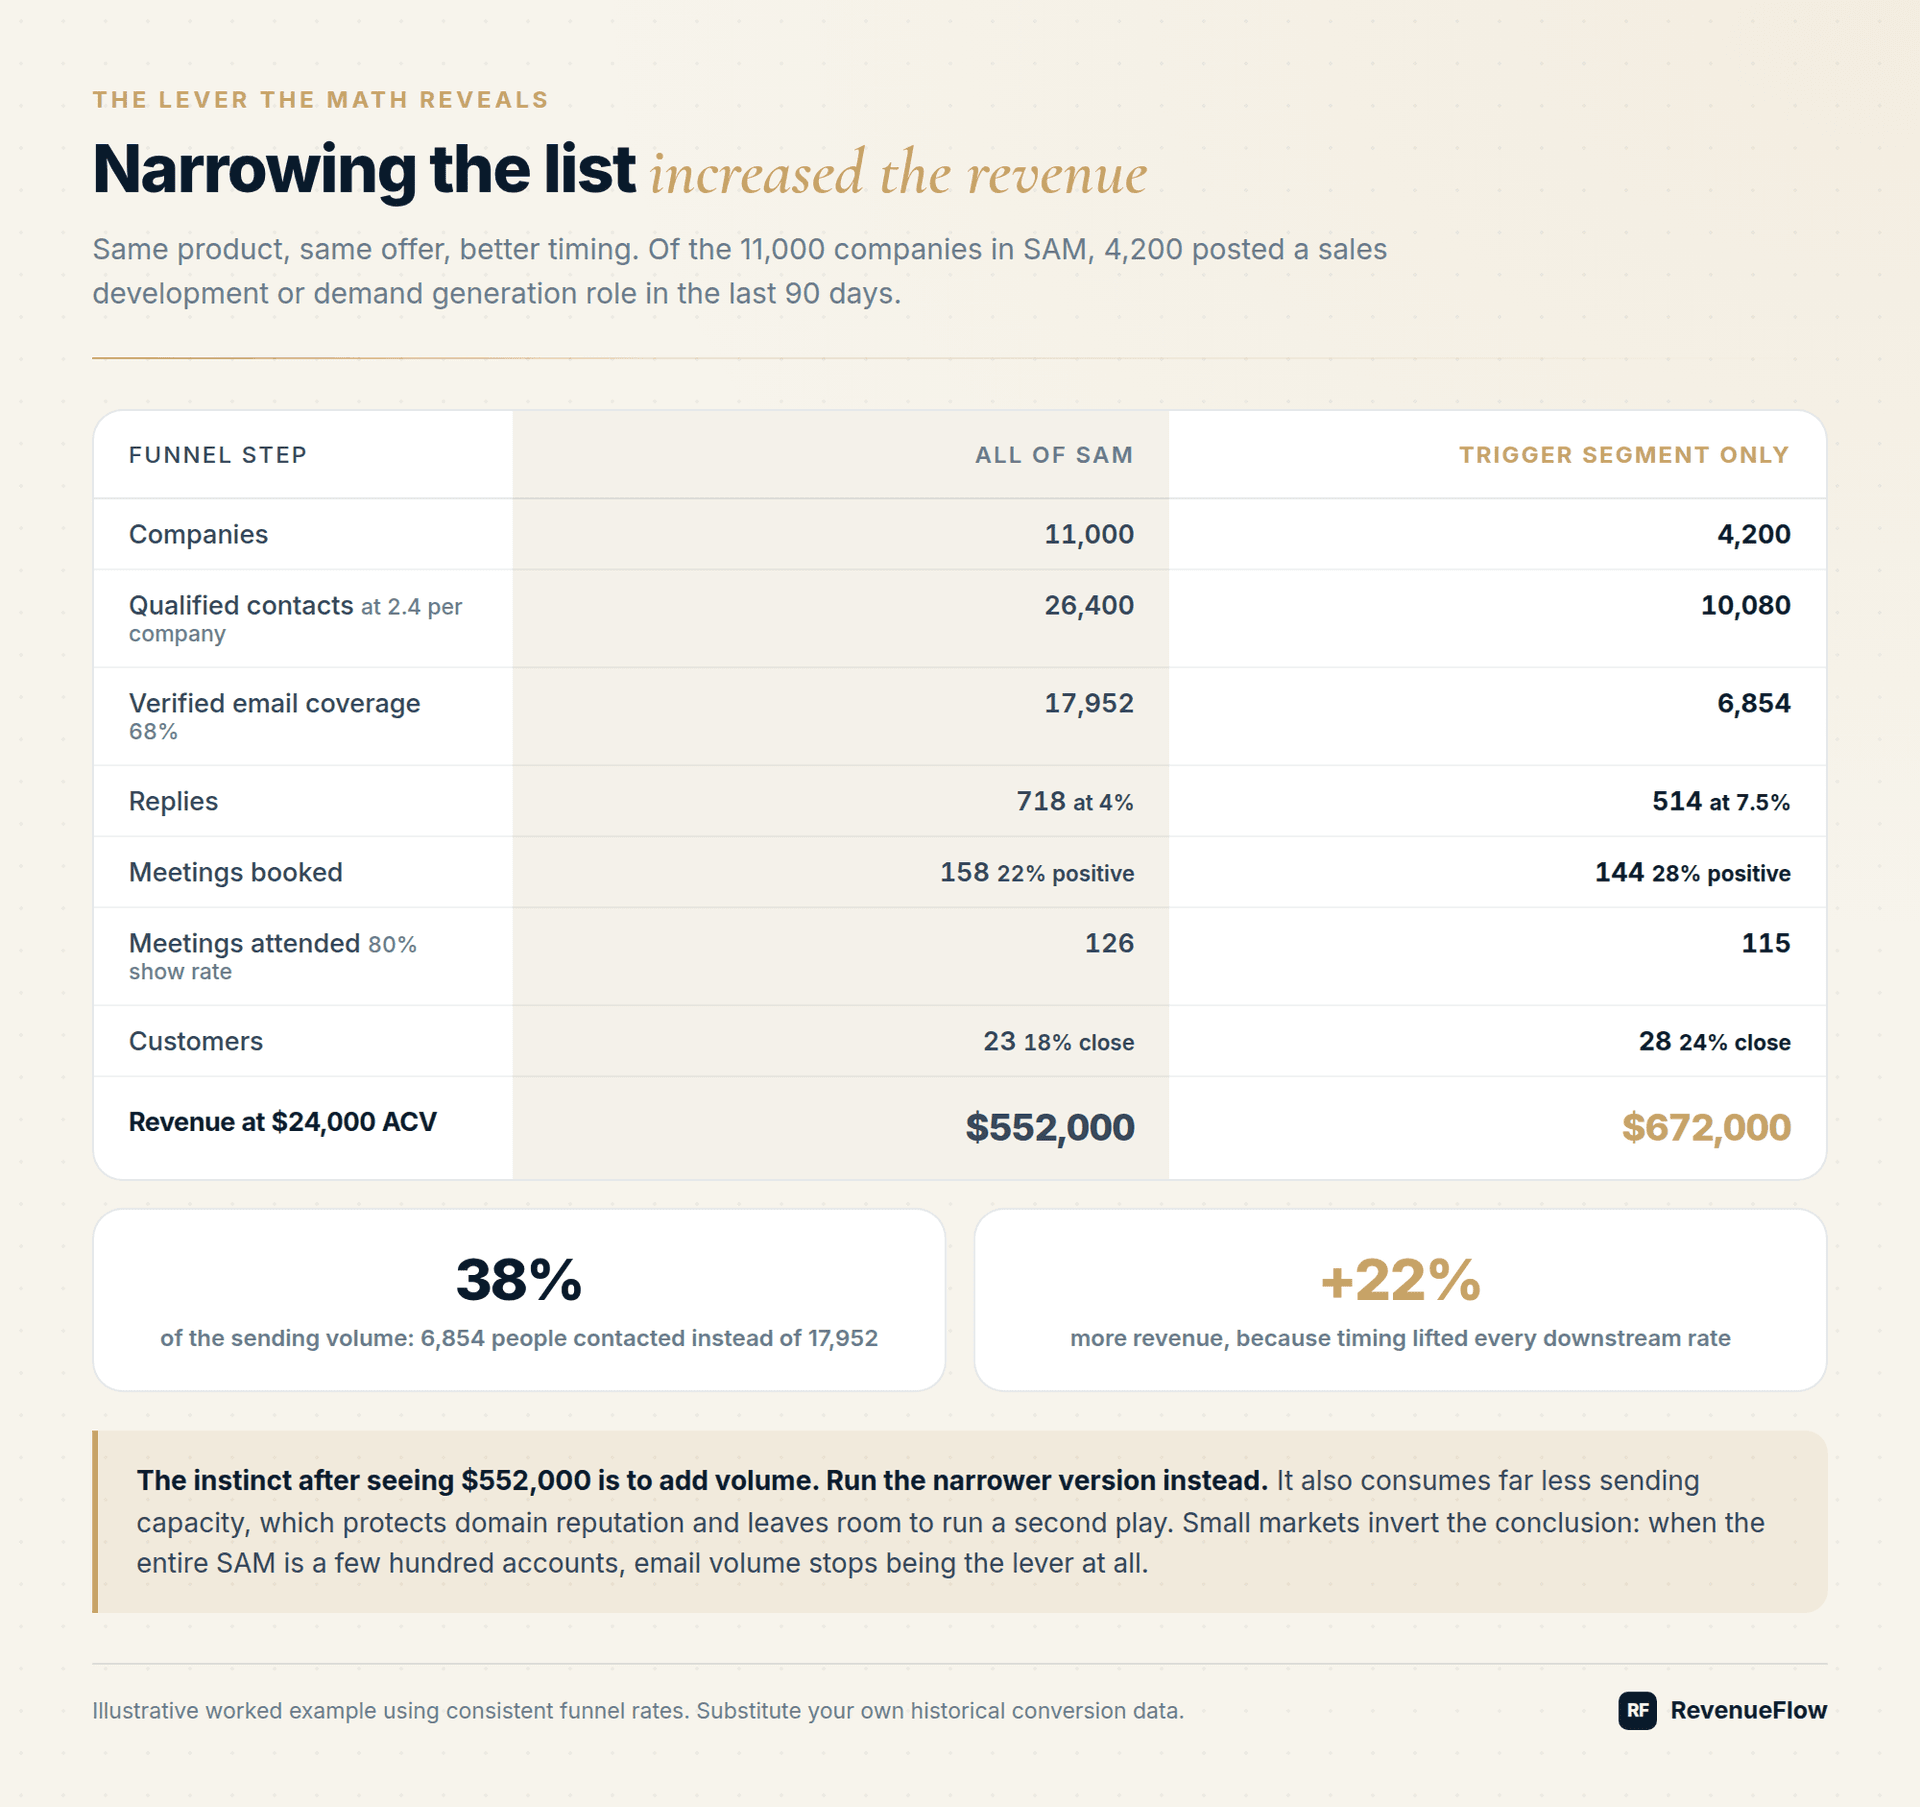
The instinct after seeing $552,000 is to add volume. Run the narrower version instead.
Of the 11,000 companies in SAM, suppose 4,200 posted a sales development or demand generation role in the last 90 days. That is your trigger segment. Same product, same offer, better timing, so the conversion rates move.
| Step | Rate | Result |
|---|---|---|
| Companies in trigger segment | 4,200 | |
| Qualified contacts per company | 2.4 | 10,080 |
| Verified email coverage | 68% | 6,854 |
| Reply rate | 7.5% | 514 replies |
| Positive share of replies | 28% | 144 meetings booked |
| Show rate | 80% | 115 meetings attended |
| Close rate | 24% | 28 customers |
| Average contract value | $24,000 | $672,000 |
The narrow list contacts 6,854 people instead of 17,952, which is 38 percent of the volume, and produces 22 percent more revenue. It also consumes far less sending capacity, which protects domain reputation and leaves room to run a second play. This is the same reason we argue for reply volume over reply rate as the operating metric: the goal is the absolute number of good conversations, and narrowing frequently increases it.
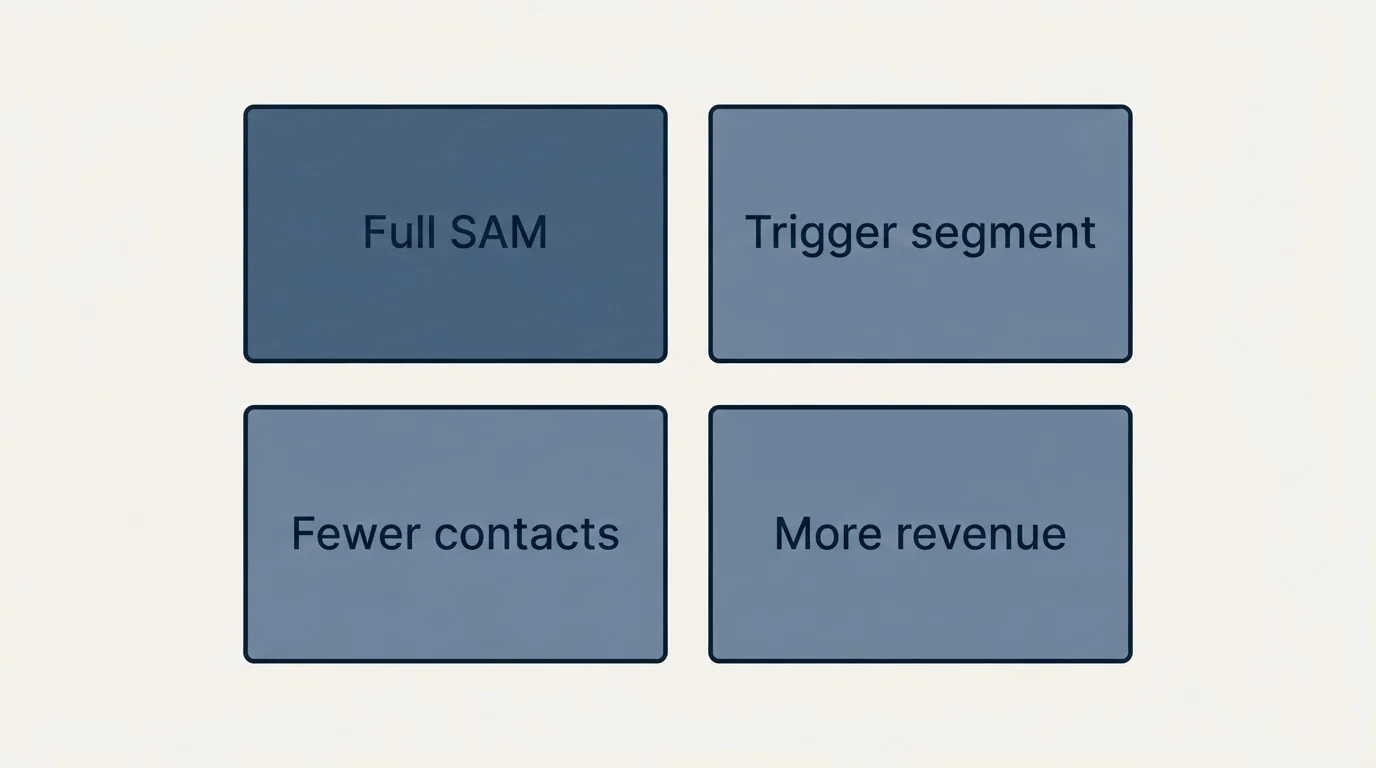
Small markets invert the conclusion. When the entire SAM is a few hundred accounts, email volume stops being the lever at all and the answer looks more like a cold calling motion built for a small TAM.
The ICP worksheet
Two questions arrive together whenever a supplier is involved: whether there is an ICP template to fill in, and whether the client should hand over criteria or a list of specific companies instead. The eight fields below are the template, and the two answers are the same answer, because a named company list is what the criteria produce once field eight returns a count. Hand over the criteria and the list is derivable by either party; hand over the list alone and nobody can say what would have to change to widen it.
Fill these eight fields. Each one must be expressible as a filter, a suppression list, or a number.
- Industry or category: the specific one, not the parent.
- Size band: employees and revenue, with both ends stated.
- Geography: where you can serve, sign, and support.
- Operational condition: what must be true about how they work.
- Trigger: the event that makes this quarter the right quarter.
- Buying roles: economic buyer, champion, likely blocker, by title.
- Disqualifiers: at least five, each a filter or a list.
- Resulting count: the number your provider returns.
If field eight is empty, go back to field one. The count is the deliverable.
Validate against closed-won before you trust it
This is also the honest answer to which industries or ICP types perform better or worse, which buyers ask expecting a league table. There is no general ranking worth publishing, because the rates that decide it are yours: score your own closed-won list against the profile and the segments that convert and retain are visible in your own history rather than in anybody else's.
Take your last twenty closed-won accounts and score them against the profile you just wrote.
- How many would have passed all eight fields? Under half means the profile describes an aspiration rather than your business.
- What do the passers share that the profile does not mention? That is usually the real ICP.
- Which lost deals would have passed? Those are the missing disqualifiers.
- Which segment had the shortest cycle and the highest retention? Weight toward it, because outbound conversion and retention correlate more often than not.
Rerun this quarterly. An ICP drifts as the product changes, and a stale profile is worse than none because it carries authority.
Teams who want to test ideal customer profiles against each other run one segment per campaign with the message held still, because two profiles tested inside one campaign produce a reply rate neither of them owns.
Where the ICP sits in the system
The ICP is the input every downstream layer inherits. Sourcing runs the filters, enrichment resolves the contacts, generation grounds itself in facts about those accounts, and reporting only means something if the segment is stable. Get it wrong and every layer amplifies the error, which is why it is step one in building an outbound engine from scratch and the first thing we would hand to a GTM engineer in their first 30 days.
This is also the reason a team cannot scale outbound before the profile is written down, since volume multiplies whatever the filters select and an undefined ICP is a decision the sourcing step ends up making by accident.
That is also the test for any B2B ICP template you are handed. If a field on it cannot be expressed as a filter, a suppression list or a number, it will not survive the trip into sourcing, and a template full of adjectives produces a document everybody agrees with and nobody can execute.
It also decides whether automation helps you. An AI SDR or an autonomous sales agent executes a bad list at full speed and reports a completed run, which is the failure mode we keep returning to in the eight GTM agent workflows that matter. Targeting is the one job in the chain that has not become cheaper to get wrong.
Frequently Asked Questions
What is the difference between an ICP and a buyer persona?
An ICP describes the company you should sell to, expressed as filters: industry, size, geography, operational conditions, and disqualifiers. A persona describes the individual you speak to inside that company. You need the ICP to build the list and the persona to write the message.
How do you calculate TAM, SAM and SOM?
TAM is every company that could theoretically buy, multiplied by your average contract value. SAM narrows that to the companies you can actually serve and reach. SOM applies your real funnel rates to SAM: contacts per company, verified email coverage, reply rate, positive share, show rate and close rate, then multiplies the resulting customer count by contract value.
How narrow should an ICP be?
Narrow enough that the count is actionable and the message can be specific. In the worked example above, cutting the list to 38 percent of its size by adding a hiring trigger produced 22 percent more revenue, because timing lifted every downstream rate. Narrowing usually costs less than it appears to.
How often should you update your ICP?
Quarterly, scored against your last twenty closed-won accounts. If fewer than half of them would have passed your current profile, the profile is aspirational. A stale ICP is more damaging than none, because teams follow it without questioning it.
What makes an ICP useless?
Adjectives. If the profile cannot be entered into a data provider as filters and return a count, it cannot change the target list, and an ICP that does not change the target list has not done anything.
Where the filtered set is far larger than the team can work, the next question is which of the survivors to start with, and that is what ICP scoring settles.
We build AI-native pipeline systems and you pay per qualified meeting, not a retainer. If you want the targeting, the infrastructure and the sending operated for you, see if you qualify.
Frequently asked questions.
Frequently asked questions- What is the difference between an ICP and a buyer persona?
- An ICP describes the company you should sell to, expressed as filters: industry, size, geography, operational conditions and disqualifiers. A persona describes the individual inside that company. You need the ICP to build the list and the persona to write the message, and confusing the two produces documents that change nothing.
- How do you calculate TAM, SAM and SOM?
- TAM is every company that could theoretically buy, multiplied by average contract value. SAM narrows to companies you can actually serve and reach. SOM applies your real funnel rates to SAM: contacts per company, verified email coverage, reply rate, positive share of replies, show rate and close rate, then multiplies the resulting customers by contract value.
- How narrow should an ideal customer profile be?
- Narrow enough that the count is actionable and the message can be specific. In the worked example, adding a hiring trigger cut the list to 38 percent of its original size and produced 22 percent more revenue, because better timing lifted every downstream conversion rate. Narrowing usually costs far less volume than teams expect.
- How often should you update your ICP?
- Quarterly, scored against your last twenty closed-won accounts. Check how many would have passed the current profile, what the passers share that the profile omits, and which lost deals would have passed. A stale ICP does more damage than none, because teams follow it without questioning where it came from.
- What makes an ICP useless?
- Adjectives. A profile built from words like innovative, growth-minded or forward-thinking cannot be entered into a data provider, so it never resolves to names and never changes who gets contacted. Every field in a working profile is a filter, a suppression list, or a number you can act on.
About the author.

Fernando Cao is CEO at RevenueFlow, which builds and operates outbound revenue engines for B2B companies. Previously at Accenture Strategy. Studied at University of Bath.
Fernando Cao · CEO
Connect on LinkedIn →Explore more.
Ready to scale your outreach?
We build GTM engines that book real meetings. See the receipts.
Related articles.
Old GTM vs New GTM: What Changed in the Last Two Years
Most teams still run the 2019 playbook: buy a list, load a sequencer, hire BDRs. Here is the signal-based model that replaced it, and the honest cost of switching.
The 7-Layer GTM AI Stack for 2026 (The Order Matters)
Your outbound will plateau this year. Not because of the tools you picked, but because of the order you stacked them in. Each layer caps every layer above it.
What Is a GTM Engineer? The Role, the Stack, the Pay
A GTM engineer builds the systems that produce pipeline. The role, the day-to-day ownership, the stack by layer, verified salary ranges, and how to hire one.
B2B Intent Data: What It Predicts, Which Providers Pay Off
Intent data predicts that an account is researching a topic more than usual. That is the whole signal. What the providers cost, and why most programs disappoint.
The 8 Agent Workflows That Matter From 48 GTM Tools
Organise your stack by job, not by vendor. Most teams have three jobs covered twice and two covered by nobody, and the eighth job is the one no vendor sells you.
Anthropic's Labour Market Report Is a Management Story
The interesting number is not what the models can do. It is the gap between that and what companies have actually built into how they operate. That gap is an org-design problem, not a talent problem.