Win Rate: Why the Denominator Decides the Number
Win rate is deals won divided by opportunities, read as a percentage. The denominator decides the number: opportunities created, opportunities that reached a stage, opportunities that reached a decision, and deals closed inside the period each produce a different rate from identical selling. Count-based and value-based versions then diverge again.
Key takeaways
- Four denominators circulate and all are defensible, so a win rate quoted without naming its denominator carries almost no information.
- Count-based and value-based win rates come apart hardest at companies whose deal sizes vary widely, and only the value-based version tracks the revenue plan.
- A rising win rate is usually a report on qualification rather than on selling, because tightening entry criteria raises the rate without any conversation improving.
- Win rate and absolute wins can move in opposite directions healthily, so maximising the rate in isolation quietly argues for a smaller business.
Win rate is the share of sales opportunities that ends in a closed deal, expressed as a percentage. Eighteen deals won out of sixty is a win rate of thirty percent. The phrase also turns up in trading, where it describes the share of positions closed at a profit, but in a sales conversation it almost always means the first thing.
The arithmetic is one division. Everything difficult about the metric sits in what goes underneath the line, and the choice of denominator moves the answer further than any change in how the team actually sells.
The win rate formula is therefore deals won divided by the denominator you name, expressed as a percentage, and the four denominators below are why quoting the formula without naming its denominator communicates nothing.
Four denominators, four different numbers
All four of these circulate, all four are defensible, and a team can quote any of them without lying.
Opportunities created in the period. Every opportunity that entered the pipeline between two dates, counted whatever happened to it afterwards. This reads low, because deals created late in the window have not had time to close, and it keeps drifting upward for months after the period ends as the stragglers resolve.
Opportunities that reached a given stage. Wins divided by everything that got as far as, say, a proposal. Useful for isolating late-stage execution, and flattering by construction, because everything that died early has already been removed.
Opportunities that reached a decision. Won plus lost, with anything still open and anything that ended without a verdict excluded. This is usually the highest of the four and the most defensible, because both halves of the fraction describe finished business.
Deals closed inside the period. Won divided by won plus lost, keyed on close date rather than creation date. This is what most reporting tools produce by default, which is why it ends up on more slides than the other three combined.
Suppose an illustrative quarter in which a hundred opportunities were created, sixty of them reached a decision before the quarter ended, and eighteen were won. The created-based win rate is eighteen percent. The decision-based win rate is thirty percent. Both are correct, both describe identical selling, and the gap between them is wider than almost any improvement a team could achieve in a quarter.
Includes deals with no chance of resolving inside the window
Everything that died early has already been excluded
Won plus lost only; open and no-verdict deals removed
Keyed on close date, so it mixes deals created across several periods
The practical consequence is blunt. A win rate quoted without its denominator is not a number anybody can act on, and two people comparing win rates across teams, quarters or vendors are usually comparing definitions.
The same warning applies with more force to closing ratio, whose published denominators start before an opportunity exists at all.
Counting deals or counting money

The second fork is whether the fraction counts opportunities or dollars.
Count-based win rate treats every opportunity as one unit. Value-based win rate divides won value by the value of everything that reached a decision. The two answer genuinely different questions, and they come apart hardest at exactly the companies where the answer matters most.
A team that wins a steady stream of small deals and loses the handful of large ones will show a healthy count-based win rate and a poor value-based one. The count says the motion works. The value says the motion works on business that does not pay for itself. Where deal sizes vary by an order of magnitude, only the value-based version has any relationship to the revenue plan.
Value-based win rate has its own defect: it is volatile. One large deal landing or slipping can move it by a wide margin in a single week, so at small deal counts it behaves more like news about one account than information about a sales motion.
- Every opportunity weighs the same
- Stable enough to read week to week
- Blind to the pattern of which deals are lost
- Flattering when small deals are easy and large ones are not
- Best for judging repeatability of a motion
- Deals weigh what they are worth
- Swings hard on a single large account
- Exposes a team that wins small and loses big
- Harder to read at low deal counts
- Best for judging whether the plan is reachable
Where the textbook definition breaks
A rising win rate is frequently a report on qualification rather than on selling. Tighten the criteria for what becomes an opportunity and fewer deals enter, each of them a better fit, and the rate climbs without a single conversation improving. That is a real gain and it should be read as what it is: a change in what the team agreed to work on. The same movement arrives for an unhappier reason when people quietly stop logging opportunities they expect to lose, which improves the metric and destroys the pipeline data at the same time.
Win rate and volume can move in opposite directions while both readings are healthy. A team winning one opportunity in three out of ninety lands thirty deals. A team that deliberately widens its market, wins one in five, and works two hundred opportunities lands forty. The second team has the worse win rate and the better year. Treating win rate as a metric to be maximised in isolation quietly argues for a smaller business.
No-decision is a policy choice with a headline effect. Deals that simply stop moving have to go somewhere. Close them as lost and the rate falls. Leave them open indefinitely and the rate rises, because the denominator never absorbs them. Nothing about the selling changed; a hygiene convention did.
Period boundaries cut deals in half. A deal created in one quarter and closed in the next belongs to different denominators under different conventions, so the same deal can be counted in one period, another, or neither.
Source is usually the largest hidden variable. Opportunities that began as referrals or inbound requests convert at a different rate from opportunities created by cold outreach, and blending them produces an average that describes neither population. A team whose inbound share grows will show a rising win rate for reasons entirely outside the sales floor.
Nobody owns the number, which is why it drifts. Win rate is computed from records that sellers maintain, against stage definitions a sales operations team maintains, over periods a finance team defines. Each of those three can change something in good faith without telling the others, and none of them is looking at the metric as a whole. A rate that moves several points between quarters is worth investigating as a definition change before it is celebrated or mourned as performance, and the investigation is usually short: somebody redrew a stage boundary, or a bulk cleanup finally closed two years of stale opportunities in one afternoon.
- Yes: Name the denominator, every time, in the same words
- Yes: Say whether it counts deals or counts value
- Yes: State how deals that ended without a verdict were treated
- Yes: Split it by lead source before comparing anything
- Yes: Split it by segment wherever the selling motion genuinely differs
- Depends: Check whether the rate moved because qualification changed
- Depends: Read it beside absolute wins, not on its own
What it decides downstream
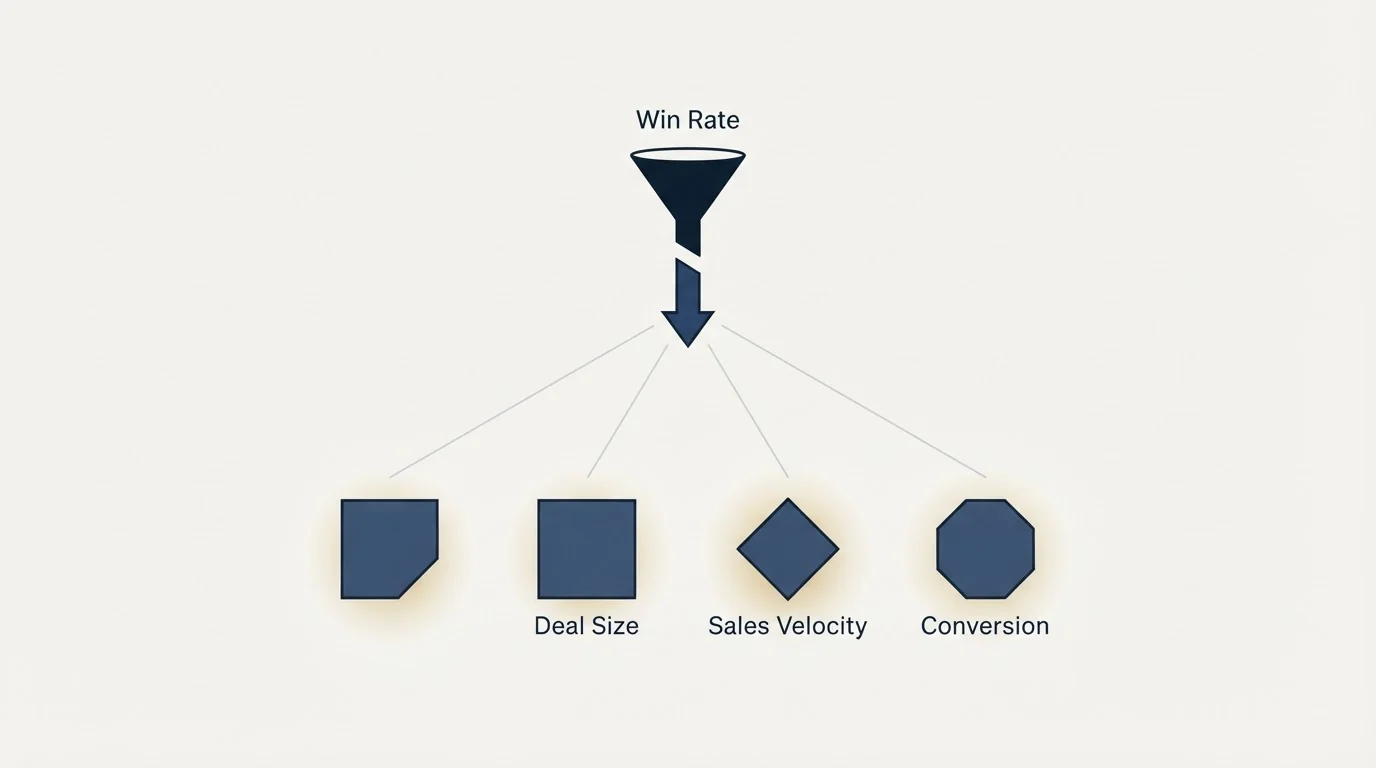
Win rate is the input that turns a pipeline number into a forecast. The coverage a team needs is close to the reciprocal of the win rate it actually achieves, an argument worked through in our entry on pipeline coverage, and it is also one of the four terms in the sales velocity formula.
Both of those uses import whatever definition you handed them, which makes the choice of denominator a forecasting decision rather than a reporting preference. Feed a created-based win rate into a coverage requirement and the required multiple comes out inflated, because that rate is depressed by deals which have not had time to resolve. Feed in a stage-based rate and the requirement comes out too low, because the deals that died before the stage have vanished from a calculation that still has to carry them. The decision-based rate, measured on the same segment and the same source as the pipeline it is being applied to, is the one that holds up.
Reading it well, and what outbound does to it

The most useful habit is to stop treating win rate as a scoreboard and start treating it as a description of what the team agreed to work on. It is a compressed statement about qualification, and it moves for reasons that have nothing to do with anyone's ability to run a conversation.
Read at company level, it smooths away everything worth knowing. Read by segment and by source, it becomes diagnostic: a low rate on cold-sourced opportunities alongside a high rate on referrals is a targeting finding, and the fix sits in who gets contacted rather than in what gets said on the call. Building an ICP with the arithmetic attached is the work that moves the first number, and what a discovery call is actually for governs whether the opportunities that do get created deserve to be there. Where the boundary between stages is drawn matters just as much, which is the subject of the pipeline stages piece.
Our own position on the outbound side is narrow and follows from this metric's own logic. We send one message per campaign, built on one premise, and any later approach is a separate campaign with its own reason to exist. That puts the entire qualification burden before the send rather than after it, because there is no second attempt to rescue a badly chosen audience. The visible effect on the numbers is fewer opportunities created and a higher decision-based win rate on the ones that are, which is the trade we would take deliberately in any case.
The last thing worth saying is about comparison. Published win rates describe whoever published them, under a denominator they rarely name, on a segment and source mix that is not yours. They are close to useless as targets. Your own rate, measured the same way for four consecutive quarters, is worth more than any benchmark, because the only comparison that carries meaning is against yourself. If the constraint sits on the input side, what a qualified lead actually has to be is where the definition work starts, and our pay per qualified meeting offer prices that definition into the arrangement rather than leaving it to be argued about later.
Frequently asked questions.
Frequently asked questions- What is a good win rate in B2B sales?
- There is no portable answer, because published rates describe whoever published them under a denominator they rarely name, on a segment and lead-source mix that is not yours. Your own rate, measured identically for four consecutive quarters, carries more information than any benchmark. The comparison that means something is against yourself.
- How do you calculate win rate?
- Divide deals won by the opportunities in your chosen denominator, then express it as a percentage. The defensible default is won divided by won plus lost, excluding deals still open and deals that ended without a verdict. State which denominator you used every time, because the same quarter yields very different rates under different choices.
- Why did our win rate go up when revenue did not?
- Usually because the denominator shrank. Tighter qualification, a bulk cleanup that closed stale opportunities, or sellers quietly declining to log deals they expect to lose all raise the rate while leaving wins unchanged. Check whether absolute wins moved at all before treating a rate improvement as performance.
- Should win rate be measured by deal count or deal value?
- Both, and separately. Count-based treats every opportunity as one unit and is stable enough to read frequently. Value-based weighs deals by what they are worth and exposes a team that wins small deals while losing large ones. Value-based swings hard on a single account, so it needs a reasonable deal count behind it.