Sales Efficiency: The Ratio That Falls When You Hire Ahead
New revenue over last quarter's sales and marketing spend. The formula, the three bands, and the four things the ratio cannot see before you act on a change in it.
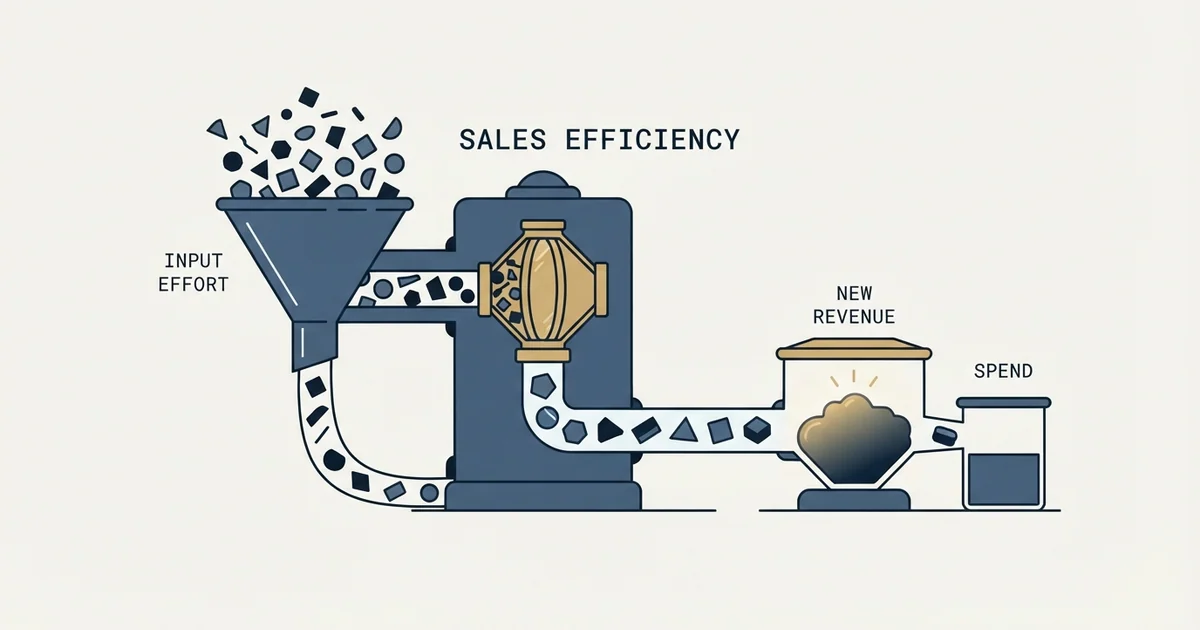
Sales efficiency measures new revenue produced per unit of the previous period's sales and marketing spend, and finance usually calls the same instrument the magic number. It is the one growth metric that worsens when spend rises without matching production, which is what makes it useful for deciding whether to add capacity.
Key takeaways
- Wall Street Prep's page states the formula as the change in quarterly GAAP revenue multiplied by four, divided by the previous quarter's sales and marketing spend. The previous-period denominator is deliberate, because spend takes time to produce revenue.
- The same page sets three bands: below 0.75 read as inefficient, 0.75 to 1.0 as moderately efficient, and above 1.0 as very efficient, with 1.0 meaning the quarter's spend is repaid by the next four quarters of incremental revenue.
- It is not cost per acquisition inverted. CAC counts customers and ignores their size; sales efficiency counts revenue and never counts customers, so winning smaller customers more cheaply improves one and worsens the other.
- A ratio that improves in the same quarter spend was cut is the most misread signal in this family. The denominator falls immediately and the numerator falls a cycle later.
Reviewed and updated September 2, 2026
A board asks whether the company can afford to hire two more sellers. The revenue chart goes up and to the right, the pipeline number is the largest it has been, and nobody in the room can answer the question, because every metric on the slide measures output and the question is about the exchange rate between spend and output. Six months later the two sellers are hired, revenue grows, and the ratio nobody was watching has quietly halved.
A different limitation lies in the tooling itself: Salesforce bundles four separately sold products under one label, as detailed in its sales performance management lineup.
Sales efficiency is that ratio. It asks how much new revenue a period of sales and marketing spend produced, and it is the only number on a growth dashboard that gets worse when you spend more without selling more. That property is what makes it useful and what makes it unpopular.
Its companion ratio measures conversion instead of cost, and the quality half of sales performance explains why the two problems call for opposite fixes.
The formula, and the one name it hides behind
The same instrument circulates under two names, and one of them is a subset of the other. Wall Street Prep's page ties them together explicitly, stating that the "SaaS Magic Number metric measures a company's sales efficiency, which refers to the efficiency at which its sales and marketing (S&M) spend generates incremental recurring revenue". Magic number is the finance framing of the ratio; sales efficiency is the operating framing and the wider family. The same page states the formula as follows:
Revenue efficiency is the third label for the same instrument, and it is the one the SaaS-finance surface reaches for. It is worth knowing because a search for it returns pages titled sales efficiency alongside pages about the magic number, which is the market agreeing that all three name one ratio rather than three. Read a revenue efficiency figure with the same two questions as the one below: whether its numerator is new business or total revenue change, and whether its denominator is the previous period fully loaded.
GTM efficiency is a fourth label for the same family, reached for when the question is put to the whole go-to-market function rather than to the sales line alone, and it is read with the same two questions.
SaaS Magic Number = [(GAAP Revenue Current Quarter − GAAP Revenue Previous Quarter) × 4] ÷ (Sales & Marketing Spend Previous Quarter)
Three choices are doing all the work in that expression, and each one is an argument.
The numerator is a difference, not a total. It measures the change in revenue rather than revenue, so a company with a large stable base and no growth scores near zero however healthy it looks. That is the intended behaviour: the question is what the spend bought, not what the company is worth.
The multiplication by four annualises a quarter. It converts one quarter's increment into a run rate, which is a projection sitting inside a metric that presents as a measurement. On a business with lumpy quarters this single term does more to move the answer than anything else in the formula.
The denominator is the PREVIOUS period's spend. This is the part most people get wrong when they rebuild it themselves, and it is deliberate: spend takes time to produce revenue, so pairing this quarter's spend with this quarter's revenue measures nothing but coincidence. Whether one quarter is the right lag is a question about your own sales cycle, and a nine-month cycle makes a one-quarter offset close to arbitrary.
Reading the number without lying to yourself
Published guidance converges on a band. Wall Street Prep's page sets out three readings, stating "SaaS Magic Number <0.75 → Inefficient", "SaaS Magic Number = 0.75 to 1 → Moderately Efficient" and "SaaS Magic Number >1.0 → Very Efficient", and adds the interpretation that makes the scale intelligible: "If the magic number is 1.0, that means that the company can pay back the quarter in question's sales and marketing spend using the incremental revenue generated across the next four quarters."
That last sentence is the whole metric. A magic number of one is a one-year payback on go-to-market spend, expressed as a ratio. Everything above it is faster and everything below it is slower.
Treat the band as orientation rather than as a target, for a reason that follows from the formula rather than from any published caution. The thresholds belong to subscription software, where gross margins are high and renewal is predictable, and the numerator is revenue rather than profit. In a business whose gross margin is materially lower, the revenue added is worth proportionally less, so the same ratio describes a weaker outcome. If you carry one number, compute the numerator on gross profit rather than revenue, and say which you used beside the figure.
- Spend is not converting into growth at a rate that pays back soon
- Adding capacity makes the ratio worse before it makes it better
- Look at conversion and deal size before volume
- Check first whether a hiring ramp is doing this to you
- The band most operating businesses sit in
- Neither a case for expansion nor a case for cuts
- Segment before concluding anything from the average
- Watch the direction across several periods, not the level
- A quarter of spend repaid by the next four quarters of incremental revenue
- The case for adding capacity is arithmetically available
- Marginal cost still rises as volume rises
- Verify the numerator is new business rather than expansion
Why it is not CAC, and why you need both
Sales efficiency and customer acquisition cost look like the same question inverted, and they answer differently often enough to be worth carrying separately.
CAC is a per-customer figure: total acquisition cost divided by customers acquired. It answers what one customer cost. Sales efficiency is a portfolio figure that never counts customers at all. It answers what a period of spend produced in revenue terms, which folds in deal size, expansion, and the mix between them.
That difference shows up in a specific way. A company can improve CAC by winning more small customers cheaply, and its sales efficiency will fall, because the cheaper customers add less revenue per unit of effort. The reverse also happens: moving upmarket raises CAC per customer and can raise sales efficiency at the same time. Neither number is wrong. They are measuring different things, and quoting one while a colleague quotes the other is a common way for two people to reach opposite conclusions from the same quarter.
The practical arrangement is to read three numbers together rather than picking a favourite: sales efficiency for whether the machine is converting spend into growth, cost per customer acquisition for what one customer costs and what is loaded into that, and the LTV to CAC ratio for whether the customer is worth more than they cost. The first is about the period, the second is about the customer, the third is about the relationship.
- New revenue produced per unit of prior-period spend
- Counts revenue, never customers
- Sensitive to deal size and expansion
- Answers whether to add spend
- Falls when headcount is added ahead of production
- Loaded acquisition cost divided by new customers
- Counts customers, ignores their size
- Improves when you win smaller deals more cheaply
- Answers what a customer costs
- Depends entirely on what is loaded into the numerator
- Expected gross profit over a customer's life against their cost
- Contains a retention assumption and therefore an opinion
- Insensitive to how long payback takes
- Answers whether the customer is worth winning
- Flatters a business with a long assumed life
Four things the ratio cannot see

The ratio summarises a machine and says nothing about which part of it moved. Four blind spots are worth naming before anyone acts on a change in it.
Nothing in the ratio shows which asset did the work, and what a buyer reads without the seller present has to survive being forwarded and opened cold by a stranger.
It is silent on segment. A company running an enterprise motion and a self-serve motion produces one blended ratio describing neither, in exactly the way blended CAC does. Split before dividing, or the number will move whenever the mix moves and nobody will know why. This is the same companion problem the six pipeline metrics work through one measure at a time: a single number that averages two populations describes neither of them.
Ramp looks identical to inefficiency. A new seller carries full cost from month one and produces revenue a quarter or two later, so the ratio deteriorates during precisely the period an investment is being made. This is the same lag problem that distorts CAC, and it has the same fix, which is a trailing window matched to your cycle rather than a calendar quarter.
Sales enablement metrics on ramp behaviour explains why activity counts and outcome numbers rarely reveal whether a new seller's slow start reflects ramp or a real problem.
A cut looks identical to an improvement. Reduce spend and the denominator falls immediately while the numerator falls later, so efficiency improves for a quarter or two before the pipeline runs out. A ratio that improves in the same quarter that spend was reduced is the single most misread signal in this family.
Expansion revenue can carry it. If the numerator is total revenue change rather than new business, growth from existing customers flatters the go-to-market ratio even when new acquisition has stopped working. Separating new from expansion is the fix, and it is also the reason net revenue retention belongs next to this number rather than inside it.
Where the outbound spend actually sits in the denominator
This is where the metric touches the work, and it is the part a finance framing leaves out.
The denominator is sales and marketing spend, fully loaded, and on an outbound motion that is not only salaries. It is the list, the enrichment and verification credits, the sending infrastructure, the domains and inboxes, the tooling, and any agency or per-meeting fees. Leaving the infrastructure out understates the denominator and produces a ratio that looks better than the business is, which is the same failure mode as reporting agency-sourced CAC without loading anything next to it.
Headcount sits inside that denominator, and the seat that sources and qualifies prospects exists so somebody else can carry the resulting opportunity to a signature.
Read that way, the ratio becomes an operating instrument rather than a board metric, because the levers are visible. Sending more does not improve it: volume raises the denominator immediately and raises the numerator only if the additional volume converts at the same rate, which it usually does not, because the most responsive part of a list is worked first. Improving conversion does improve it, and so does raising deal size, and so does removing spend that produces meetings which never become revenue.
Two of our own documented positions follow from that arithmetic rather than from taste. We run one message per campaign, with no bumps and no thread replies, which caps the volume lever deliberately and puts the weight on list quality and on the offer. And meetings are qualified against criteria agreed with the client in writing before anything sends, which matters here because an unqualified meeting is a denominator entry with no path to a numerator entry. The narrower list argument in the ideal customer profile guide is the same claim in funnel form: cutting volume while raising conversion frequently raises the ratio, and it always raises it faster than adding capacity does.
The short version

Sales efficiency is new revenue divided by the prior period's sales and marketing spend, and it is the same instrument the finance side calls the magic number. Published bands read below 0.75 as inefficient, 0.75 to 1.0 as moderate and above 1.0 as very efficient, with 1.0 meaning a quarter of go-to-market spend is repaid by the next four quarters of incremental revenue.
Carry it alongside cost per acquisition and the lifetime value ratio rather than instead of them, because the three answer different questions and can disagree honestly. Segment before you divide. Match the window to your sales cycle so that a hiring ramp does not read as decay. Separate new business from expansion so that retention does not flatter the acquisition machine. And treat an improvement that arrives in the same quarter as a spend cut with suspicion, because the denominator falls before the pipeline does.
If the lever you are reaching for is more volume, the arithmetic usually says otherwise, and a narrower list with a better premise moves this ratio faster. You can see what a campaign into a tighter segment would look like.
Formula and interpretive bands verified against Wall Street Prep's SaaS magic number page as fetched on 28 August 2026. Publishers revise these pages; confirm the current text before relying on them.
Frequently asked questions.
Frequently asked questions- What is sales efficiency?
- The ratio of new revenue produced to the sales and marketing spend that produced it, usually with the spend taken from the previous period. It answers what a period of go-to-market spend bought, rather than what the company is worth or what one customer cost, and it is the number that falls when headcount is added ahead of production.
- Is the SaaS magic number the same as sales efficiency?
- In practice yes. The same instrument circulates under both names, with magic number used more in finance and investor conversations and sales efficiency more in operating ones. Enough publishers use both terms for one formula that treating them as separate metrics produces two dashboards measuring one thing.
- What is a good sales efficiency ratio?
- Wall Street Prep's page reads below 0.75 as inefficient, 0.75 to 1.0 as moderately efficient and above 1.0 as very efficient. Treat those as orientation rather than as a target: they were formed on high-margin subscription software, so a lower-margin business should compute the numerator on gross profit and say so beside the figure.
- Why does sales efficiency fall when we hire sellers?
- Because a new seller carries full cost from month one and produces revenue a quarter or two later, so the denominator rises before the numerator does. The ratio deteriorates during exactly the period the investment is being made. A trailing window matched to your sales cycle, rather than a calendar quarter, removes most of the distortion.
About the author.

B2B cold email experts helping companies generate qualified leads through done-for-you outreach campaigns.
RevenueFlow Team
Explore more.
Ready to scale your outreach?
We build GTM engines that book real meetings. See the receipts.
Related articles.
Win Rate Benchmarks: Which Figures State a Population
A catalogue of the published average sales win rates, sorted by whether the page names the population behind its own number. Most do not.
Sales Cycle Length Benchmarks: What Each Figure Counts
The published B2B sales cycle benchmarks, sorted by what each page says it counted. The same number means two different things in two of them.
Sales Enablement Charters: What the Published Ones Ask For
Six publishers set out what a sales enablement charter should contain. Five describe a document nobody can check, and one writes a definition with inspection in it.
Sales Kickoff Agendas: Five Published, Session by Session
Five publishers print a sales kickoff agenda. They agree on four blocks and disagree on session length, rehearsal and where the agenda comes from.
Sales Comp Plan Design: What the Publishers Prescribe
Four publishers set out how to design a sales compensation plan. Here are their procedures, their components, and which of their ratios carry a population.
The Bow Tie Model: The Funnel Extended Past the Sale
The bow tie extends the sales funnel past the close into onboarding, adoption and expansion. The stages, the numbered metrics and the fit, from the author's standard.