Cost per Customer Acquisition: What the Number Includes
Two teams calculate CAC for the same quarter and get numbers three times apart. What belongs in the numerator, and why payback matters more.
Cost per customer acquisition is total acquisition cost divided by new customers won in a period. The disagreements are about inputs: fully loaded salaries, commission, agency fees and tooling all belong in the numerator, and most calculations omit at least two. Report blended, paid and channel CAC together, and pair the number with gross margin payback period.
Key takeaways
- Every CAC disagreement is an argument about one of two inputs: what goes in the numerator and which customers count in the denominator.
- Fully loaded salaries and commission are usually the largest acquisition costs, and media spend is usually the smallest.
- Blended CAC is inflated by organic and referral customers, so it falls even when the paid motion loses money on every customer it buys.
- Payback period, CAC divided by monthly gross profit, answers affordability in a way CAC alone cannot, because it is a cash statement.
Reviewed and updated September 2, 2026
A board pack puts customer acquisition cost at $940. The finance model for the same quarter puts it near $2,600. Nobody made an arithmetic mistake. The two calculations counted different costs in the numerator and different customers in the denominator, and neither one wrote down the choices it had made. The board version was paid media divided by every new customer. The finance version was fully loaded sales and marketing divided by the customers that sales and marketing could plausibly claim.
Both numbers are defensible. Only one of them answers whatever question is about to be decided, and picking the wrong one is how companies conclude that a channel is cheap right before they scale it into unprofitability.
The cost per acquisition formula is one division, total acquisition spend over customers acquired in the same period, and both terms are choices rather than readings.
People asking how to figure out customer acquisition cost are usually asking for the formula and finding that the formula was never the hard part: the division takes a second, and the two inputs it takes are both choices somebody has to write down.
How to calculate cost per acquisition is settled once those two arguments are settled: pick the numerator tier, name the denominator population, and date both.
To determine your cost per acquisition in a way that survives a challenge, write the numerator tier and the denominator population down, date them, and restate the figure whenever either definition moves.
A published average customer acquisition cost is an average of other companies' mixes, cost tiers and segment definitions, so it can tell you nothing about whether your own next customer is affordable.
The formula, and the two arguments hiding inside it
Cost per customer acquisition is the total cost of acquiring customers over a period, divided by the number of new customers acquired in that period. The arithmetic is trivial. Every real disagreement about CAC is an argument about one of two inputs: what belongs in the numerator, and which customers belong in the denominator.
The formula for a subscription business is that same division, and it usually wants a companion beside it. Dividing the same acquisition spend by the new recurring revenue it produced, rather than by a customer count, removes the distortion that a mix of small and large contracts puts into any per-customer average, which is the distortion that makes two SaaS companies with identical spend report unrecognisably different numbers.
Neither of those has a single correct answer. What matters is that the answer is written down, applied consistently, and reported alongside the number rather than reconstructed from memory six months later when someone asks why CAC moved.
What belongs in the numerator
The instinct is to count media spend. Media spend is usually the smallest part of the real cost.
Everything below is an acquisition cost in the sense that it would fall away if you stopped acquiring customers, and most companies exclude at least two of them.
Teams weighing whether to outsource cold calling to a marketplace freelancer should read what a Fiverr gig actually delivers before treating it as a cost line.
Fully loaded people cost. Salary, employer taxes, benefits and equipment for everyone whose job is winning new customers: SDRs, account executives, demand generation, content, marketing operations, the paid media manager. Loaded cost runs meaningfully above base salary, and using base salary alone understates the biggest line in the numerator.
Commission and variable compensation. Paid on closed business, so it belongs to the customers it closed. Companies that exclude it are usually excluding it because it lands in a different part of the P&L, which is an accounting reason rather than an economic one.
Agency and contractor fees. Retainers, per-meeting or per-lead fees, freelance writers, design, video. This line is often the easiest to find and the most commonly reported in isolation, which is part of why agency-sourced CAC looks flattering when nothing else is loaded next to it.
Tooling lines want the same care, because add-ons priced on separate units put a field sales bill well above the seat rate on the card.
Tooling. The sales engagement platform, the CRM seats used by acquisition roles, enrichment and data providers, sending infrastructure, call recording, scheduling, the intent data subscription somebody renewed. Individually small, collectively a real line.
Another limitation surfaces on the ad platforms themselves, where the reported figure divides spend by tracked conversion events rather than closed customers, a gap explored in what platform CPA leaves out.
Content and creative production. Cost of producing the asset, not just distributing it. A piece of content that keeps producing pipeline for two years is a genuine argument for amortising it, and that argument needs to be made explicitly rather than by quietly leaving the cost out.
The debatable ones are worth naming too. Customer success and onboarding usually sit in cost of goods sold rather than acquisition, though the boundary blurs when onboarding is doing the closing. Brand spend with no attributable pipeline is still acquisition cost in the sense that it buys future customers, and companies that exclude it are choosing to report a cleaner number rather than a complete one. Executive time is real and almost never counted.
Acquisition cost is not cost of goods sold, and the distinction decides where each one lands in the accounts. Cost of goods sold is what it takes to serve a customer you already have, so it sits above gross profit. Acquisition cost is what it took to win them, so it sits below. Moving acquisition spend into cost of goods sold understates gross margin, and because payback divides acquisition cost by gross profit, the same error then makes payback look longer than it is.
- Yes: Fully loaded salaries for sales and marketing headcount
- Yes: Commission and variable compensation on new business
- Yes: Agency retainers, per-lead and per-meeting fees
- Yes: Paid media and sponsorship spend
- Yes: Acquisition tooling: CRM seats, sending infrastructure, data providers
- Depends: Content and creative production cost
- Depends: Brand spend with no attributable pipeline
- Depends: Executive and founder selling time
- No: Onboarding and customer success delivery
- No: Expansion and upsell cost against existing accounts
The denominator is less obvious than new logos

New customers acquired in the period sounds unambiguous until you try to count them.
Expansion revenue from existing accounts is not acquisition, so upsell should leave both sides of the ratio. Customers who signed and churned inside the period still cost money to acquire, so removing them flatters the number. Customers who came through a partner or a referral programme with its own cost line need that cost in the numerator if they are in the denominator.
Ratios upstream of that one carry the same problem, and a close rate counted from a quote is a different number from one counted from an opportunity.
The sharpest version of the problem is self-serve alongside sales-led. A company with a free tier that converts people who never spoke to a human, and an enterprise motion with a nine-month cycle, has two businesses with different unit economics. Dividing the combined cost by the combined customer count produces a number that describes neither. Segment first, then divide.
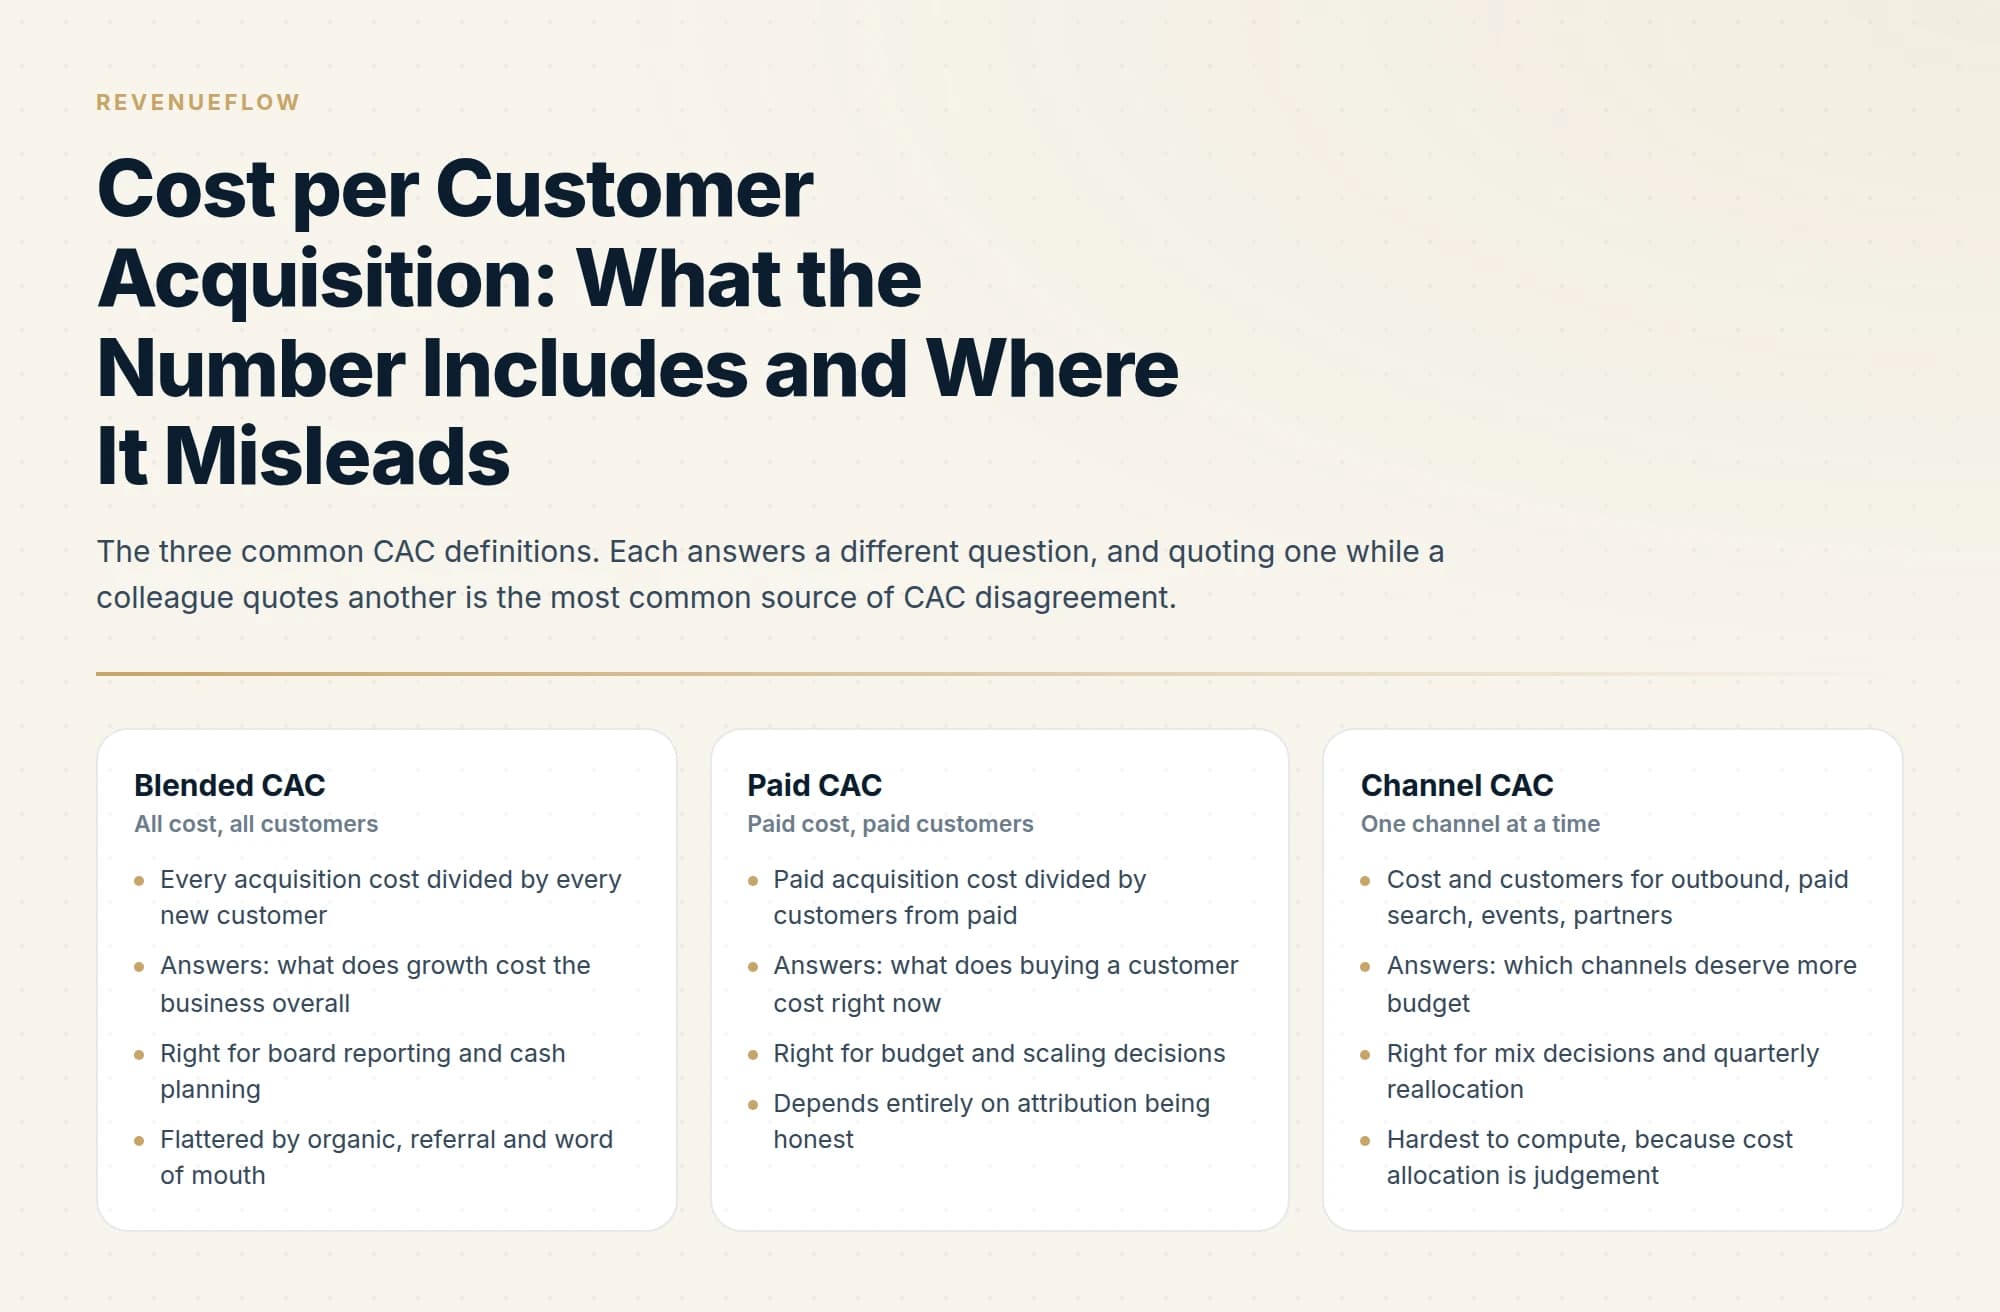
Blended, paid and channel CAC
Three versions of the number get used interchangeably, and they answer three different questions.
This is also what is being asked for by a request for a customer acquisition cost model or a CAC analysis, and there is no single model to adopt. The model is the two choices above plus which of these three versions is being reported, written down together. Any chart of the number over time is only readable by somebody who knows all three were held constant across the periods being compared.
- Every acquisition cost divided by every new customer
- Answers: what does growth cost the business overall
- Right for board reporting and cash planning
- Flattered by organic, referral and word of mouth
- Useless for deciding where the next dollar goes
- Paid acquisition cost divided by customers from paid
- Answers: what does buying a customer cost right now
- Right for budget and scaling decisions
- Depends entirely on attribution being honest
- Rises as you scale, because the cheap audience goes first
- Cost and customers for outbound, paid search, events, partners
- Answers: which channels deserve more budget
- Right for mix decisions and quarterly reallocation
- Hardest to compute, because cost allocation is judgement
- Breaks down when channels assist each other
Blended CAC is the number most often quoted and the least useful for making a decision. It includes customers who arrived because a founder is well known, because an existing customer recommended you, or because you have ranked for a category term for four years. Those customers cost something, and it is nothing like the cost of the next one.
Why blended CAC flatters strong inbound
Consider the mechanics rather than a specific company. A business with a large organic and referral base has a denominator inflated by customers that no amount of extra spend would have produced faster. Divide total spend by that larger denominator and the average falls. The average falls even if the paid motion is losing money on every customer it buys.
The failure follows predictably. Blended CAC looks comfortably below the target, so the paid budget is doubled on the strength of it. The organic base does not double. The average moves toward the marginal cost of the channel that actually scaled, and the number that looked healthy in January is unrecognisable by June. Nothing degraded. The mix changed, and blended CAC was always a mix statistic wearing the clothes of a unit cost.
The practical discipline is to report blended and paid side by side, permanently. The gap between them is a measure of how much of your growth you are not paying for directly, which is useful in its own right, and it makes the flattery visible instead of load-bearing.
The lag problem
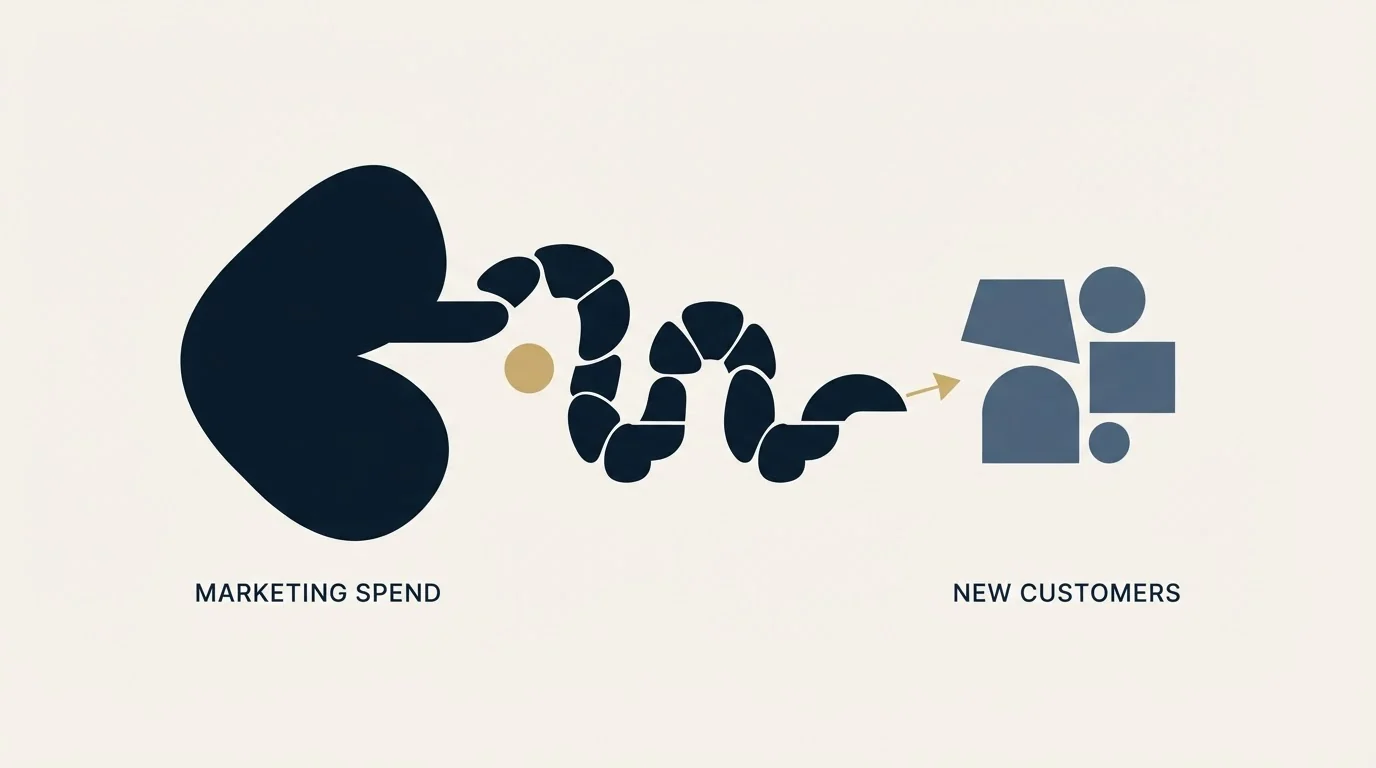
CAC divides a cost incurred in one period by customers who closed in the same period. In a business with a short cycle that is roughly fair. In a business with a six-month cycle it is a category error, because this quarter's customers were bought by last quarter's and the quarter before's spend.
The effect is systematic rather than random. Grow spend and reported CAC overstates true cost, because the numerator has scaled while the denominator still reflects the smaller earlier spend. Cut spend and reported CAC understates it, which is how a company convinces itself that a budget cut improved efficiency. The most common form of this is a hiring ramp: new reps carry full cost from month one and close nothing for a quarter, so CAC deteriorates on paper during exactly the period the investment is being made.
Two fixes, both cheap. Use a trailing window matched to your sales cycle length rather than a calendar quarter. And run a cohort view alongside it, holding spend against the customers that spend actually produced, even when they close two quarters later.
- Step 1Segment first
Split self-serve from sales-led, and new business from expansion. A combined number describes neither motion.
- Step 2Load the numerator
Fully loaded people cost, commission, agency fees, media, tooling. Decide the debatable lines explicitly.
- Step 3Match the window
Use a trailing period matched to your sales cycle rather than a calendar quarter, so lag does not fake a trend.
- Step 4Report three versions
Blended, paid and per channel, side by side. The gaps between them carry the information.
- Step 5Write down the choices
Record what was included and excluded next to the number, so the next calculation is comparable rather than reinvented.
Payback period is the companion metric
CAC on its own says nothing about whether a cost is affordable. A high CAC against a high margin annual contract can be excellent. A modest CAC against a thin margin product that churns inside a year can be fatal.
Payback period closes the gap: CAC divided by monthly gross profit per customer, expressed in months. It answers how long the business is out of pocket before a customer has repaid what it cost to win them. Gross profit rather than revenue is the part people get wrong, because revenue payback ignores the cost of serving the customer and produces a number that is optimistic by exactly the amount of your cost of goods sold.
Payback is the more actionable of the two because it is a cash statement. It tells you how much working capital growth consumes, which is the constraint that actually binds most companies, and it responds to margin improvement as well as to cost reduction. The ratio of lifetime value to CAC is worth watching too, with the caveat that lifetime value contains a retention assumption and therefore contains an opinion. Payback contains almost none.
For the same reason, payback tolerance should come from your own cash position and funding situation rather than from a published benchmark for your category. A company with two years of runway and a company with seven months can look at identical unit economics and correctly reach opposite conclusions.
Where the number misleads even when it is calculated correctly

It is an average over a mix. A change in CAC frequently means the mix moved rather than that any channel got better or worse. Always ask whether the components moved before congratulating anyone on the average.
It hides the marginal cost. The relevant number for a budget decision is what the next customer costs, not what the last hundred averaged. Marginal cost rises with volume in every paid channel, because the most responsive audience is reached first. Average CAC can fall while marginal CAC is already above what you can afford.
It is also the honest answer to whether acquisition cost is fixed or variable, which is that it is neither. Media spend and commission move with volume. Loaded headcount, tooling and content production hold steady inside a period and step up when you hire, so the average carries a fixed block the next customer does not. That mix is why average and marginal separate as volume grows, and why a budget decision taken on the average is taken on the wrong number.
One-off costs distort short windows. A conference sponsorship, a website rebuild or a severance payment lands in one month and produces customers over many. Amortise or annotate, and never read a single month as a trend.
Attribution decides channel CAC before you do. Under last touch, the channel that closed gets everything. Under first touch, the channel that found the prospect does. The same quarter can produce very different channel CAC depending on a setting in an analytics tool, which is worth remembering before reallocating budget on the strength of it. The relationship between measured cost per lead and eventual cost per customer is where this bites hardest, and our breakdown of what a lead generation agency costs covers how the upstream number distorts on the way down.
Definition drift. A number that includes contractor spend one quarter and excludes it the next produces a trend that exists only in the spreadsheet. This is the most common cause of a CAC improvement nobody can explain.
Making it defensible
Write the definition down once and put it next to the number every time it is reported. Segment before dividing. Report blended and paid together so the mix is visible. Match the window to the sales cycle. Pair CAC with gross margin payback so affordability is part of the same conversation. Recalculate the same way every period, and treat any change to the definition as an event worth annotating.
The number is a management tool rather than a score. Its job is to make the next allocation decision better than the last one, and it can only do that when everyone reading it is looking at the same construction.
When you are comparing what an internal team, an agency retainer and an outsourced motion actually cost per customer, the loaded comparison rarely matches the quoted one. Our breakdowns of lead generation agency cost and outsourced SDR versus in-house work through the lines that are usually missing on one side, and the MQL and SQL distinction matters here because a CAC built on a soft stage definition inherits that softness all the way down.
If you would rather see the cost per customer of a live outbound motion in your market before modelling it, you can see what a campaign would look like.
Frequently asked questions.
Frequently asked questions- What should be included in customer acquisition cost?
- Fully loaded salaries and employer costs for sales and marketing headcount, commission on new business, agency and contractor fees, paid media, and acquisition tooling like CRM seats and data providers. Content production, brand spend and executive selling time are judgement calls. Decide them explicitly and record the decision beside the number so later periods stay comparable.
- What is the difference between blended CAC and paid CAC?
- Blended CAC divides all acquisition cost by all new customers, including organic and referral. Paid CAC divides paid acquisition cost by the customers paid acquisition produced. Blended answers what growth costs the business overall and suits board reporting. Paid answers what buying the next customer costs, which is the number a budget decision actually needs.
- Why does our CAC get worse when we hire more reps?
- New reps carry full loaded cost from month one and close nothing for their ramp period, so the numerator grows before the denominator does. Reported CAC deteriorates during exactly the period the investment is being made. Use a trailing window matched to your sales cycle, and run a cohort view holding spend against the customers that spend eventually produced.
- Is CAC payback period better than the LTV to CAC ratio?
- Payback is more reliable for operating decisions because it contains fewer assumptions. Lifetime value embeds a retention forecast, which is an opinion about the future. Payback divides CAC by monthly gross profit and tells you how long the business is out of pocket, which is a cash constraint you can verify. Watch both, and act on payback.
- How can we reduce the cost of customer acquisition?
- Work on the denominator before the numerator. Most acquisition-cost problems are conversion problems, because a wider funnel at the same close rate raises spend without moving the customer count. Tighten targeting so fewer and better-fitting accounts enter, then remove the stages where deals stall. Cutting spend on its own lowers both halves of the ratio and leaves it where it was.
About the author.

B2B cold email experts helping companies generate qualified leads through done-for-you outreach campaigns.
RevenueFlow Team
Explore more.
Ready to scale your outreach?
We build GTM engines that book real meetings. See the receipts.
Related articles.
Win Rate Benchmarks: Which Figures State a Population
A catalogue of the published average sales win rates, sorted by whether the page names the population behind its own number. Most do not.
Sales Cycle Length Benchmarks: What Each Figure Counts
The published B2B sales cycle benchmarks, sorted by what each page says it counted. The same number means two different things in two of them.
Sales Kickoff Agendas: Five Published, Session by Session
Five publishers print a sales kickoff agenda. They agree on four blocks and disagree on session length, rehearsal and where the agenda comes from.
Sales Enablement Charters: What the Published Ones Ask For
Six publishers set out what a sales enablement charter should contain. Five describe a document nobody can check, and one writes a definition with inspection in it.
Sales Comp Plan Design: What the Publishers Prescribe
Four publishers set out how to design a sales compensation plan. Here are their procedures, their components, and which of their ratios carry a population.
B2B Lead Lists for Aviation Companies: Build or Buy
Aviation is one of the few industries whose accounts are published by its regulator, which changes what is worth buying and what is worth downloading yourself.