Six Pipeline Metrics, and the Companion Each One Needs
Every pipeline metric is ambiguous alone and settles when held next to one other figure. The six that carry the load, their pairings, and how each gets gamed.
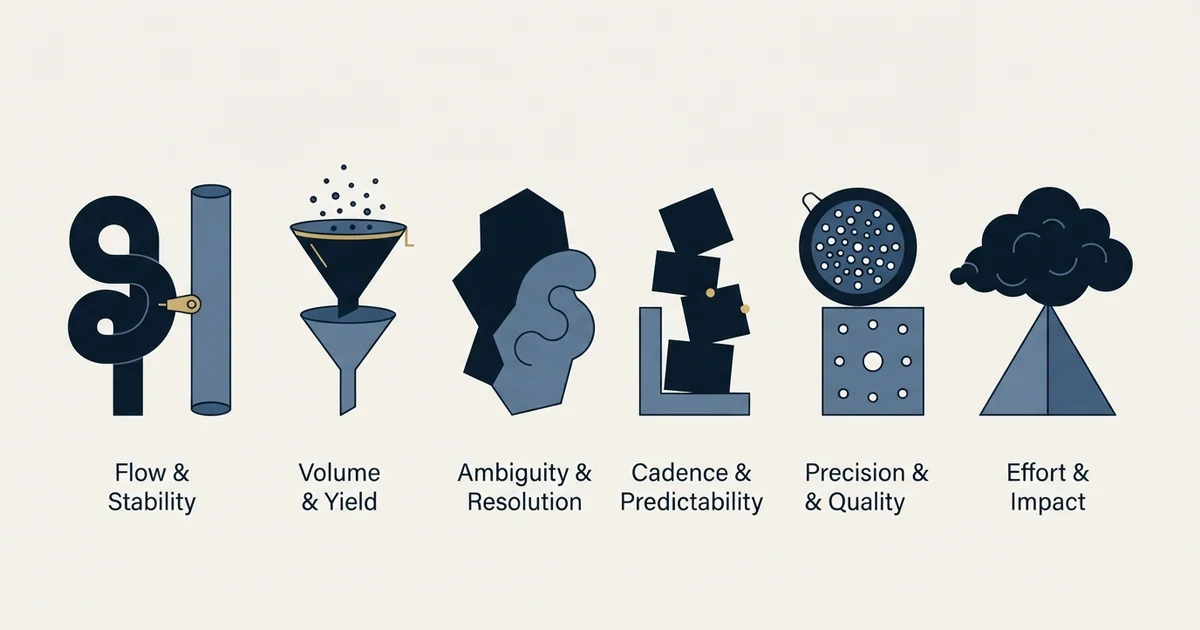
The sales pipeline metrics that carry the load are six: open pipeline value, pipeline coverage, pipeline created, stage conversion, sales cycle length and win rate. Each is ambiguous alone, so pair coverage with win rate, cycle length with close dates, stage conversion with time in stage, and win rate with average deal size.
Key takeaways
- Pipeline created is the leading indicator a standing pipeline balance hides for a full cycle, and it is the metric most often missing.
- Coverage is roughly the reciprocal of win rate: three to one suits a team winning one in three, and a team winning one in five needs five to one.
- Age in stage compared against the age at which deals historically converted out of it shows which part of a stage is genuinely live.
- Moving the boundary at which an opportunity enters the pipeline shifts four metrics at once in different directions, with nobody selling any differently.
Reviewed and updated September 18, 2026
A pipeline dashboard with twenty metrics on it is a dashboard nobody reads. The number that gets quoted in the review is whichever one moved most, and the number that would have explained the quarter is on the third screen, because it never moves much and nobody put it near the top.
Sales pipeline metrics are worth a small number of well-chosen figures held together, because each of them is ambiguous alone and most of them become clear in pairs. This page covers the six that carry the load, the pairings that make them readable, and the two ways every one of them can be gamed without anybody lying.
Pipeline conversion rate, the share of pipeline value that reaches closed won, is the figure most teams reach for here, and on its own it is the least readable of the six: it moves when win rate moves, when stage entry standards move, and when a single large deal lands, and the number itself cannot tell you which happened.
The six sales pipeline metrics that carry the load
The sales pipeline metrics worth reporting are six: open pipeline value, pipeline coverage, pipeline created, stage conversion, sales cycle length and win rate. Three describe how much is in the pipeline and three describe whether it is going anywhere. Each has a plain definition, and each needs one companion figure beside it before it can be read, which is what the table sets out.
| Metric | How it is computed | Read it beside |
|---|---|---|
| Open pipeline value | Total value of open opportunities in the period | Pipeline created, because a standing balance moves slowly |
| Pipeline coverage | Open pipeline value divided by the target | Win rate |
| Pipeline created | New value entering per period. The leading indicator | The motion it came from, segmented |
| Stage conversion | Share of deals entering a stage that reach the next one | Time in stage |
| Sales cycle length | Median days from entry to closed won | The close dates on open deals |
| Win rate | Share of qualified opportunities that close won | Average deal size |
Notice what is not on that list. Number of opportunities is on almost every default dashboard and tells you very little without value and stage attached. Activity counts belong in activity reporting rather than in pipeline reporting, because a rep can complete every activity without the buyer doing anything at all.
Pipeline created is the one most often missing and the one worth adding first. Open pipeline value is a standing balance and moves slowly, so it disguises a collapse in new business for a full cycle. New value entering per period does not.
CRM metrics is the same question asked from the system of record, and these six are the ones a CRM can genuinely support, because each is computed from fields the pipeline object already carries.
This is why a team can be behind on a quarterly pipeline generation target for six weeks before anyone says so out loud: coverage and open value both look survivable while created value has already fallen, and created value is the only one of the three that moves in the week the problem starts.
The reason a standing balance hides so much is worth being precise about. Open pipeline value falls when deals close and rises when deals are created, and in a period where both happen at similar rates the total barely moves. A team that stopped generating new opportunities six weeks ago and is still closing the ones it had will show a stable pipeline value and a stable coverage ratio for most of a cycle, and the first visible symptom will be a quarter with nothing left to close. Created value has already fallen off a cliff by then, and it fell in the week the problem started.
Segment the six wherever the sales motions genuinely differ. Enterprise and mid-market deals convert at different rates and run at different lengths, so a single blended figure for either conversion or cycle length is guaranteed to be wrong for at least one of them, and usually flattering to the segment doing worse. Splitting is the cheapest improvement most teams can make to their reporting, and it costs one grouping field.
Since blended figures across segments can mislead, the same caution applies when sizing your numbers against outside benchmarks, a distinction explored in matching benchmark denominators.
The pairings that make them readable
A team holding a demo conversion rate with no count of demos and no count of the leads underneath it has a ratio and no denominator, which is the pairing this section exists to restore.
A predictable pipeline is not a different set of metrics from the six above, it is those six read on a stable denominator: predictability arrives when created value per period and stage conversion hold across quarters, and neither can be read at all until they are segmented by motion.
Almost every pipeline metric is ambiguous on its own and settles when held next to one other figure.
Coverage next to win rate. The famous three-to-one rule of thumb is really a statement about winning roughly a third of what you carry. A team converting one in five needs about five to one, and at three to one it is short while the multiple looks completely normal in the review. The reciprocal relationship, and the reasons both inputs are softer than they look, are worked through in pipeline coverage.
Put invented numbers on it, with the target set to 100. At three to one the team carries 300. Winning one in three closes 100 and the target is met. Winning one in five closes 60, and the review still shows a healthy-looking three. That team has to carry 500 before the multiple means what everybody in the room assumes it means.
Cycle length next to close dates. If your median cycle is four months, every deal created inside the last eight weeks with a close date in this quarter is a forecasting problem sitting inside a pipeline metric. Comparing accepted close dates against your own measured cycle is a cheap audit almost nobody runs.
Stage conversion next to time in stage. A stage with good conversion and a long dwell time is a bottleneck that eventually resolves. A stage with poor conversion and a short dwell time is a filter working correctly. The same conversion figure means opposite things depending on the companion.
Win rate next to average deal size. Win rate rising while deal size falls usually means the team has drifted down-market, which is a strategy change nobody decided. The two together describe a motion; either alone describes a mood.
Win rate belongs to a wider family of conversion ratios, and the conversion half of sales performance holds each of them against the denominator that makes it readable.
Time in stage is the diagnostic

If a team can only add one thing to its reporting, it should be age rather than count.
Count tells you volume. Age tells you where the process breaks. The specific comparison that carries the information is the current median age of deals in a stage against the median age at which deals historically converted out of it. When the first is materially larger than the second, that stage is holding deals which are not going to progress, and the standing count will not show it.
In that invented example the stage reports forty-one deals and contains nine that resemble deals which have historically closed. A forecast built on the forty-one is not slightly optimistic; it is describing a different population.
Telling those populations apart needs evidence the record does not hold, and reading an open deal from its own evidence is a second source on a question the CRM answers by self-report.
The two ways every one of these gets gamed
Neither requires anybody to lie, which is what makes them durable.
Definition drift. The metrics are all built on the boundary where an opportunity enters the pipeline. Tighten that boundary and win rate rises, coverage falls, and conversion from meeting to opportunity falls while conversion from opportunity to won rises. Loosen it and every one of those reverses. A dashboard showing all four will look like a team that suddenly got better at closing and worse at generating demand, and the only thing that happened was an edit to a definition document. The defence is a dated definition with readable version history, so the question of whether the population changed or the ruler did has an answer.
Marketing influenced pipeline explains how the same boundary problem appears when a qualifying touch definition decides what gets counted as influenced.
Deferred honesty. Nothing in a CRM closes a dead deal. Pushing a close date is invisible and closing one as lost is a visible act, so pipelines accumulate deals that inflate value and coverage while contributing nothing. The metric that catches it is the count of deals whose close date has moved more than twice, which almost no dashboard carries and which takes minutes to build.
Pipeline accuracy is the name usually given to the gap between what a pipeline promises and what closes, and these two distortions account for most of it, which is why neither is fixed by a better model.
Both of these are reasons to clean the pipeline on a fixed schedule that has nothing to do with when the numbers are being presented. A pipeline cleaned the week before a board meeting looks like a business that shrank.
Reading them for an outbound programme

Pipeline metrics are a lagging view of a targeting decision made a full sales cycle earlier, which changes what the honest response to a gap actually is.
The same lag runs at the individual level, where an empty calendar reads as a lagging signal about an input that moved weeks before anyone noticed the quiet.
If the cycle runs four months and the quarter has eight weeks left, conversations started today are next quarter's pipeline no matter how quickly they are booked. Treating outbound as an in-period repair produces rushed targeting and a set of opportunities that raise the ratio without ever closing, which makes the following quarter worse rather than better.
The two figures that connect outbound to the rest of this are meeting-to-opportunity conversion and the reason distribution for the meetings that do not convert. The first tells you whether the meetings are the right meetings. The second tells you what to change, and only if the reasons come from a fixed list, because free-text reasons cannot be counted. Where the reasons concentrate on seniority or company fit, the instruction is for the targeting; where they concentrate on timing, the instruction is usually for the segment rather than the campaign. What qualified has to mean when money depends on it covers how that definition gets settled in advance, and running discovery so it disqualifies well covers where the reasons get produced.
Our own commercial position is a narrow version of the same discipline. We are paid on attended meetings that meet criteria agreed in writing before launch, and budget, timing and authority are deliberately outside that definition, because they change every quarter and a meeting that happened should not become unqualified retrospectively. That also keeps the meeting-to-opportunity figure meaningful: it measures fit rather than the buyer's mood on the day.
Building the reporting without buying anything
None of this needs a dedicated analytics platform, and starting with one usually delays the work.
Five saved views cover most of it in any mainstream CRM. Open deals with no next step or an overdue one. Deals whose close date has moved more than twice. Deals whose close date is inside a window shorter than the median cycle. Age in current stage, grouped by stage. And created value by period, which is the leading indicator the standing balance hides.
The reason to build these before buying a tool is that each one will expose data-quality problems, and a platform bought before those are fixed will report the same problems more attractively. Where the numbers come from and who owns them is the design question underneath all five.
The short version

Six metrics carry most of the load: open pipeline value, coverage, pipeline created, stage conversion, cycle length and win rate. Each is ambiguous alone, so pair coverage with win rate, cycle length with close dates, stage conversion with time in stage, and win rate with average deal size.
Add age before adding anything else, and compare the current median age in a stage against the age at which deals historically converted out of it. Watch for the two silent distortions: a moved definition, which shifts four metrics in different directions at once, and unclosed dead deals, which inflate value and coverage indefinitely. Date every definition change on the chart it moves, and clean on a schedule divorced from the reporting calendar.
Where the metrics say the constraint is supply rather than execution, that is the half we run: see what a first campaign produces.
Frequently asked questions.
Frequently asked questions- Which sales pipeline metrics actually matter?
- Open pipeline value, pipeline coverage, pipeline created per period, stage conversion, sales cycle length and win rate. Opportunity count belongs on the list far less often than dashboards suggest, and activity counts belong in activity reporting, because a seller can complete every activity without the buyer doing anything at all. Six figures, each read beside one companion, cover most reviews.
- Why is pipeline coverage misleading on its own?
- Because the required multiple is roughly the reciprocal of the win rate a team actually achieves. Three to one corresponds to winning about a third of what you carry, so a team converting one in five is short at three to one while the number looks entirely normal in a review. Coverage is a forecast only when paired with a measured win rate.
- What does time in stage tell me that count does not?
- Where the process breaks, as opposed to how much is in it. Compare the current median age of deals in a stage against the median age at which deals historically converted out of it. When the first is much larger, the stage is holding deals that will not progress, and the standing count cannot show that.
- How do pipeline metrics get gamed without anybody lying?
- Two ways. A quiet edit to the entry definition moves win rate, coverage and two conversion rates in different directions at once. And close dates get pushed where deals should be closed as lost, because pushing is invisible and closing is a visible act. Dated definitions and a report on twice-moved close dates catch both.
About the author.

B2B cold email experts helping companies generate qualified leads through done-for-you outreach campaigns.
RevenueFlow Team
Explore more.
Ready to scale your outreach?
We build GTM engines that book real meetings. See the receipts.
Related articles.
Win Rate Benchmarks: Which Figures State a Population
A catalogue of the published average sales win rates, sorted by whether the page names the population behind its own number. Most do not.
Sales Cycle Length Benchmarks: What Each Figure Counts
The published B2B sales cycle benchmarks, sorted by what each page says it counted. The same number means two different things in two of them.
Sales Enablement Charters: What the Published Ones Ask For
Six publishers set out what a sales enablement charter should contain. Five describe a document nobody can check, and one writes a definition with inspection in it.
Sales Kickoff Agendas: Five Published, Session by Session
Five publishers print a sales kickoff agenda. They agree on four blocks and disagree on session length, rehearsal and where the agenda comes from.
Sales Comp Plan Design: What the Publishers Prescribe
Four publishers set out how to design a sales compensation plan. Here are their procedures, their components, and which of their ratios carry a population.
MEDDIC vs BANT: What Each Qualifies and When to Use Which
MEDDIC and BANT from the originators' own text: IBM's BANT form as a gate after the first call, PTC's six themes as an audit of a live deal, and when to run each.