LTV to CAC Ratio: What the Three to One Convention Assumes
The LTV to CAC ratio divides customer lifetime value by customer acquisition cost. Built correctly, lifetime value uses gross margin and acquisition cost includes salaries, tooling and agency fees. Because margin cancels out of the division, the ratio equals customer lifetime divided by payback period and says nothing about cash timing.
Key takeaways
- When margin per period is constant, the ratio reduces to customer lifetime divided by payback period, which is why it carries no information about cash timing.
- Lifetime value computed on revenue rather than gross margin overstates the whole ratio, and a reported four to one can sit under three to one once margin is applied.
- On a young company the lifetime input is an extrapolation past the oldest observed cohort, and early cohorts are the least representative a company will have.
- Three to one is a venture-stage convention rather than a derived threshold, and a ratio far above it usually signals underspending rather than strength.
The LTV to CAC ratio is the lifetime value of a customer divided by the cost of acquiring one, expressed as a plain multiple such as four to one. It is dimensionless, which is why it travels so easily between companies and investor conversations, and it is the standard shorthand for whether a business is buying customers for less than they are worth.
Both sides of the division are estimates rather than observations, and the ratio inherits every assumption made in constructing them. That is not a reason to ignore it. It is a reason to know precisely which four or five decisions produced the number before anybody acts on it.
How each side is built
Customer lifetime value. The correct construction takes the gross margin a customer produces per period, not the revenue, and multiplies it by the expected number of periods that customer stays. Where retention is described by a churn rate, expected lifetime is one divided by that rate, so a business losing one fortieth of its customers each month implies an average life of forty months.
Customer acquisition cost. Total sales and marketing spend over a period, divided by the number of new customers acquired in it. Fully loaded means everything: seller and marketing salaries, commissions, tooling and data subscriptions, any external agency or contractor, advertising, and the share of founder time actually spent selling.
- Step 1Gross margin per customer
Revenue less the cost of serving that customer, per month or per year
- Step 2Expected lifetime
Derived from a retention curve, and the first genuinely unobserved input
- Step 3Acquisition spend
Everything spent to win customers in a period, salaries and tooling included
- Step 4The ratio
Margin times lifetime, divided by spend per new customer
The identity worth knowing before anything else

When gross margin per period is roughly constant, the ratio simplifies to something more revealing than it first looks. Lifetime value is margin per month multiplied by months of life. Acquisition cost is margin per month multiplied by the months needed to earn it back. Divide one by the other and the margin cancels out entirely, leaving customer lifetime divided by payback period.
So the ratio is a statement about how many times over a customer repays their acquisition cost before leaving, and it is silent about timing by construction, because timing is exactly what cancelled. That single fact explains most of the trouble the metric causes in practice.
Where the ratio flatters, specifically
Lifetime value computed on revenue rather than gross margin. This is the most common error and it moves the answer the furthest. A business running seventy cents of gross margin on every revenue dollar and computing lifetime value on revenue overstates that side by roughly half as much again, and the ratio carries the whole overstatement. A reported four to one becomes under three to one the moment margin is applied, which crosses the line most people use to decide whether the business works.
A retention curve nobody has observed to the end. Lifetime value on a young company is an extrapolation. If the oldest customer is eighteen months old, any statement about a five-year life is a projection from the shape of a curve whose tail has not happened yet, and early cohorts are the least representative a company will ever have, since they are disproportionately design partners, friendly accounts and buyers who were sold to by a founder. The extrapolation is usually optimistic in one particular way: churn tends to be front-loaded, so a young company measuring average churn across its whole short history reads a rate that is too high for its survivors and too low for its newcomers.
Acquisition cost with things left out of it. Every omission from the denominator raises the ratio. The recurring ones are marketing and sales salaries, commissions, tooling and data subscriptions, agency or contractor fees, and founder selling time that nobody costs because nobody invoices for it. The subtler version is blended acquisition cost, where customers who arrived through word of mouth are counted in the denominator while contributing nothing to the numerator of spend, so the paid channel looks cheaper than it is. Paid and blended figures answer different questions and only one of them tells you whether to spend more.
Expansion revenue breaking the formula outright. Where lifetime is derived as one divided by a churn rate, a business whose existing customers grow faster than they leave has a net churn at or below zero, and the division either explodes or returns a negative number. The usual response is to cap the assumed lifetime at three years or five, chosen because it sounds conservative rather than because anything measured it, and that arbitrary cap then silently sets the entire numerator. A ratio resting on a capped lifetime is really a ratio resting on whoever picked the cap.
Silence about payback timing. Two businesses reporting four to one can be in entirely different cash positions. Suppose the first recovers its acquisition cost out of gross margin in six months and holds customers for two years. Suppose the second takes two years to recover the same cost and needs eight years of retention to reach the identical ratio. The first funds its next customers out of the ones it already won. The second finances two years of every customer's cost before that customer contributes anything, and rests its ratio on a retention claim reaching six years past anything it has observed.
- No: Lifetime value computed on revenue instead of gross margin
- No: Expected lifetime projected well beyond the oldest observed cohort
- No: Salaries, commissions or tooling missing from acquisition cost
- No: Agency and contractor fees treated as separate from acquisition spend
- No: Blended acquisition cost quoted while a paid-channel decision is being made
- No: Founder selling time costed at nothing
- Depends: One ratio for a customer base containing two different motions
The three to one convention, and what it assumes
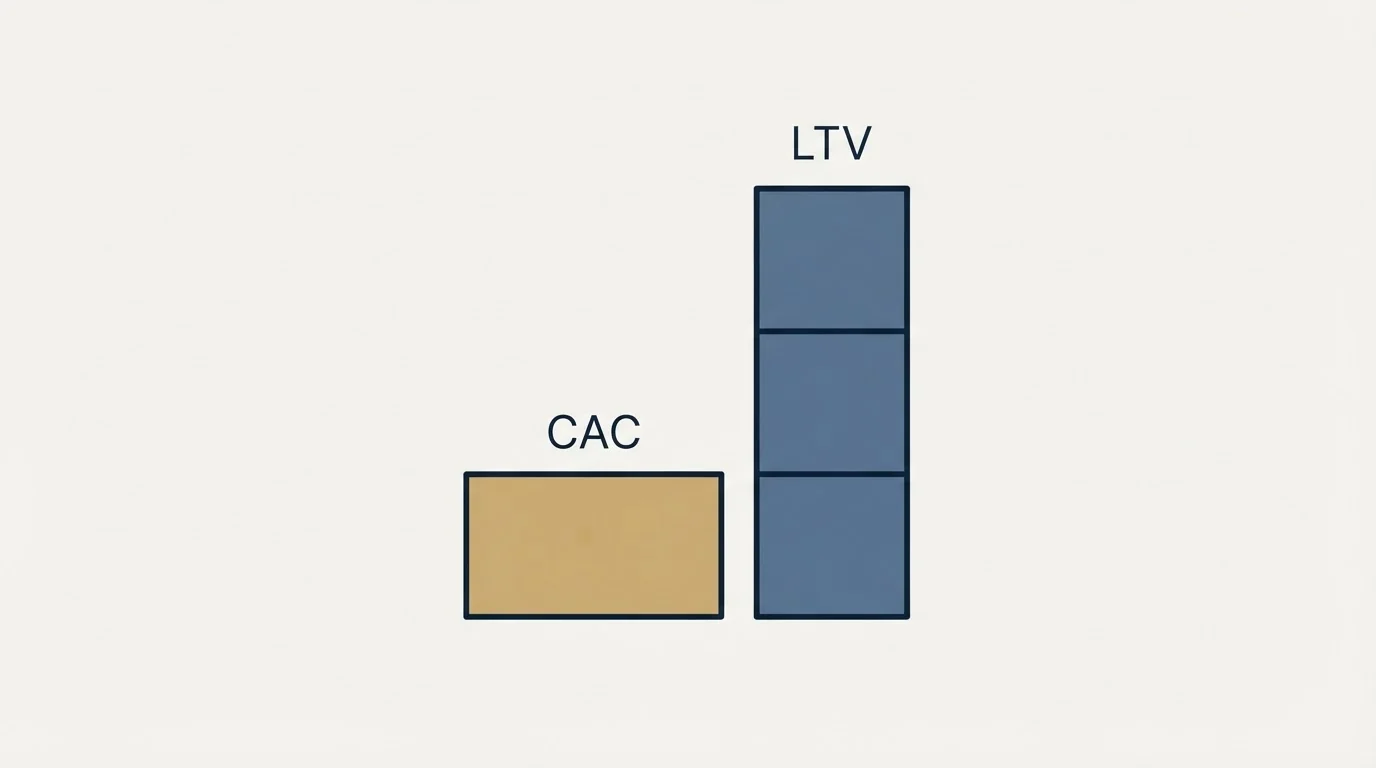
Three to one circulates as the line between a business that works and one that does not. It is a convention drawn from venture-stage subscription software, and it is worth saying plainly that no arithmetic derives it. It is a judgment about a particular kind of company, and it carries at least four assumptions.
It assumes lifetime value was built on gross margin. It assumes acquisition cost was fully loaded. It assumes the retention curve underneath the lifetime estimate has been observed rather than projected. And it assumes a payback period the business can actually finance, which the ratio itself cannot express.
It also carries a second edge that gets forgotten. A ratio far above the convention is not an achievement to protect; it usually means the company is spending too little to acquire customers and leaving growth unbought. Read that way, the convention is a band rather than a floor, and a business sitting well above it should be asking what it could profitably spend rather than congratulating itself.
- Lifetime value from revenue
- Lifetime projected past the observed data
- Acquisition cost from advertising spend alone
- Blended across every customer source
- Quoted as a single company-level figure
- Lifetime value from gross margin
- Lifetime anchored to an observed retention curve
- Acquisition cost fully loaded, salaries included
- Split between paid and organic sources
- Reported by cohort and by segment, with payback beside it
Reading it well
The single most useful companion to the ratio is payback period, because it restores exactly the information the division cancelled. A company that reports both is describing whether the unit economics work and whether it can survive them, which are separate questions with separate answers.
The second habit is to compute the ratio by cohort rather than for the company as a whole. Acquisition cost belongs to the period a customer was won in, and lifetime value belongs to that same cohort's own retention. Dividing this quarter's spend by last year's customers, which is what a blended company-level figure quietly does when growth is fast, produces a number that flatters a growing business and punishes a stable one for no reason connected to either.
It is also worth being honest about where the metric simply does not apply. Businesses without a subscription have no natural lifetime at all, and any figure produced for them rests on a repeat-purchase assumption doing quiet work in the background. The ratio can still be built there, but it should be labelled as a model of buying behaviour rather than presented as a property of the customer base.
The third is to split it wherever the acquisition motion genuinely differs. A self-serve customer and one won through months of direct selling have different costs and usually different retention, and one ratio covering both describes a customer who does not exist. Where the deal size differs too, the split is not optional, because annual contract value sets the acquisition budget on each side independently.
On the denominator, the practical work is arithmetic rather than judgment. What actually belongs in a cost per customer acquisition figure covers the omissions in detail, and setting a target you can defend is the version that turns the ratio into a spending limit rather than a report card. Once the limit exists, the question becomes what a unit of pipeline costs against it: what a good meeting costs and the pricing models for outsourced sales development are where that comparison gets made.
One further point about the denominator is easy to miss. Acquisition cost is downstream of conversion, so anything that changes win rate changes the ratio without anybody touching a budget. A team that tightens qualification spends the same money and acquires more customers with it, and the ratio improves through the denominator rather than through the marketing plan.
That is also where our own position sits. We send one message per campaign, built on one premise, and a later approach is a separate campaign with its own reason to exist, which puts the entire cost of a mistargeted audience in front of the send rather than spread across attempts to recover from it. Acquisition cost measured this way is unusually legible, because a campaign either found the right people or it did not, and there is no accumulated spend to unpick afterwards. When a ratio says the acquisition budget is the binding constraint, our pay per qualified meeting offer prices outbound against the unit that budget is measured in.
Frequently asked questions.
Frequently asked questions- What is a good LTV to CAC ratio?
- Three to one circulates as the standard, but it is a convention from venture-stage subscription software rather than a derived threshold. It assumes lifetime value built on gross margin, fully loaded acquisition cost, an observed retention curve, and a payback period the business can finance. Treat it as a band, since sitting far above it often means underspending.
- Should LTV use revenue or gross margin?
- Gross margin, always. Revenue-based lifetime value ignores the cost of serving the customer, so a business keeping seventy cents of margin per revenue dollar overstates that side by roughly half as much again. The ratio inherits the entire overstatement, which is usually enough to move a business from one side of the conventional threshold to the other.
- What belongs in customer acquisition cost?
- Everything spent to win customers in the period: sales and marketing salaries, commissions, tooling and data subscriptions, advertising, any agency or contractor fees, and founder selling time. Every omission raises the ratio. Keep paid and blended figures separate, because blended counts word-of-mouth customers while adding none of their cost.
- Why does payback period matter if the ratio is already healthy?
- Because the ratio cancels timing out of the arithmetic. Two companies reporting four to one can differ enormously: one recovering acquisition cost in six months funds its next customers from the ones it has, while one taking two years must finance that gap and depends on a retention claim far beyond anything it has observed.