Churn Rate: The Denominator Decides the Number
Churn rate is the proportion of customers, or of recurring revenue, lost over a stated period. Take the base at the start of the period, count what had gone by the end, and divide. The figure is unreadable without three things stated: what is counted, over what period, and over what base.
Key takeaways
- A monthly rate compounded is not a monthly rate multiplied by twelve: 3 percent monthly is roughly 31 percent annually, not 36.
- Customer churn and revenue churn routinely point in opposite directions, and that divergence is information rather than noise.
- Churn is a lagging indicator of a decision taken months earlier, so reading it as this month's report card misdirects the fix.
- Churn cut by acquisition channel and by segment is the cheapest correction to a targeting decision that any business already owns.
Churn Rate: The Denominator Decides the Number
Churn rate is the proportion of customers, or of recurring revenue, lost over a stated period. Take the customers you had at the start of the period, count how many had gone by the end, and divide. A business with 400 customers in January that has lost 12 of them by the end of the month has a monthly customer churn rate of 3 percent.
The formula is arithmetic anyone can do. Almost every disagreement about a churn figure is about the three choices made before the arithmetic starts: what you are counting, which period you are counting over, and who is allowed into the denominator.
Churn analysis that stops at a monthly percentage answers nothing; the cohort view is the version that tells you when customers leave, which is the part you can act on.
Churn in marketing names this same measure read from the acquisition side, where the useful question is not the headline rate but which acquisition channel and which segment the departures came from.
To calculate churn rate, divide the customers lost during a period by the customers you had at the start of it, then state the period alongside the number.
The three choices
The same choice decides what a churn prediction model can learn. A model is trained on labelled examples of churn, so whichever of the three definitions you picked is the thing it is being taught to recognise, and a model trained on one definition will score accounts against that definition however sophisticated it is. Before asking how accurate a prediction is, establish which of these three it was trained to predict.
Customer churn or revenue churn. Counting logos treats a customer paying 200 a month identically to one paying 20,000. Counting revenue weights them properly. The two numbers routinely point in opposite directions, and that divergence is information rather than noise: heavy logo churn with light revenue churn means you are losing small accounts, which may be a pricing decision working as intended. The reverse means you are losing the accounts that matter, and it is the more urgent of the two.
The period. A monthly rate and an annual rate are not interchangeable, and multiplying one by twelve overstates the other, because each month churns from a base already reduced by the previous month. Compounding 3 percent monthly gives roughly 31 percent over a year rather than 36. Any figure quoted without its period is unreadable.
The denominator. Customers at the start of the period is the standard and the most defensible. Average customers across the period is also used and produces a slightly lower figure. Including customers acquired during the period produces a figure that improves whenever you sell more, which is why it is the most flattering choice and the one to check for first.
- Customer churn: lost logos over starting logos
- Revenue churn: lost recurring revenue over starting recurring revenue
- Net revenue churn: lost revenue minus expansion from surviving accounts
- The three can point in different directions on the same month
- Monthly, the operating figure
- Quarterly, common in board reporting
- Annual, the figure quoted externally
- Monthly compounded is not monthly multiplied by twelve
- Customers at period start: standard, defensible
- Average customers in period: slightly lower
- Including new customers acquired in period: flattering
- Voluntary only, excluding non-payment: needs disclosing
What the number is for
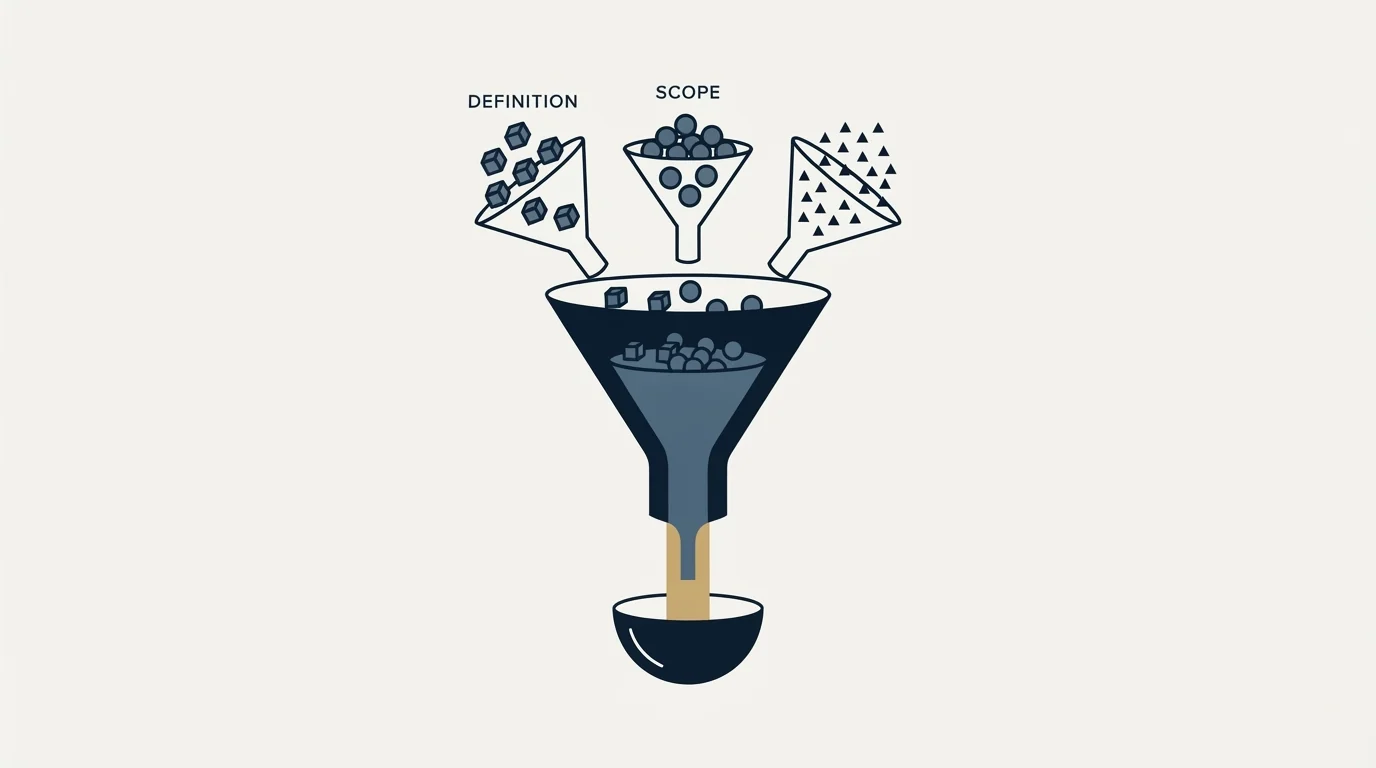
Churn is the drag term in every growth calculation, and its practical use is that it sets a floor on how much new business is required simply to stand still.
The arithmetic is worth doing once, with your own figures. Suppose you have 500 customers and lose 3 percent a month. That is 15 customers a month, and 180 a year, that you have to win back before a single net addition. If your acquisition capacity is 20 a month, you are growing at 5 net while running the sales effort of 20. Halving churn to 1.5 percent takes net growth from 5 a month to 12.5 without a single extra sale.
That relationship is why churn work and acquisition work compete for the same budget and why the comparison is worth making explicitly rather than by instinct. The same arithmetic sized against agency retainers rather than subscriptions is in agency sales funnel.
Churn also sets customer lifetime, and lifetime sets what a customer is worth. At 3 percent monthly the average customer life is roughly 33 months. At 5 percent it is 20. That single change moves what you can afford to spend acquiring one, which is the input to cost per customer acquisition and to any target you set for it.
Where the textbook definition breaks
Churn is a lagging indicator of a decision made months earlier. A customer who leaves in November decided in about July, usually after an unresolved problem, a champion changing jobs, or a renewal that nobody prepared for. By the time the number moves, the cohort that caused it has already gone. Reading churn as this month's report card produces the wrong intervention.
Small numbers are unreadable. With 40 customers, one departure is 2.5 percent and two is 5, so the monthly series is noise with a trend somewhere inside it. Below a few hundred customers, the cohort view is the only honest read: track each intake month separately and look at how far each one has fallen at the same age.
Averaging across segments hides the finding. A blended 4 percent that is 1 percent among customers who use two products and 9 percent among single-product customers is not a retention problem, it is an onboarding or a fit problem, and the average conceals which. Any churn number worth acting on has been cut by segment, by plan and by acquisition channel.
Voluntary and involuntary churn are different failures with different fixes. A customer who chose to leave is a product or value problem. A customer whose card expired is a billing problem, and it is usually the cheaper of the two to fix. Reporting them together makes a solvable operational issue look like a market verdict.
Churn on its own cannot show growth inside surviving accounts. A business losing 8 percent of revenue to departures while growing 15 percent within the accounts that stayed is expanding, and a churn figure alone reports only the 8. The metric that nets the two is net revenue retention.
- Depends: The period is stated, and monthly figures are compounded rather than multiplied
- Depends: Customer churn and revenue churn are reported separately
- Depends: The denominator is customers at period start, or the choice is disclosed
- Depends: Voluntary and involuntary churn are split
- Depends: The figure is cut by segment, plan and acquisition channel
- Depends: Cohorts are compared at the same age rather than in the same calendar month
The cohort view, which is the one that answers questions
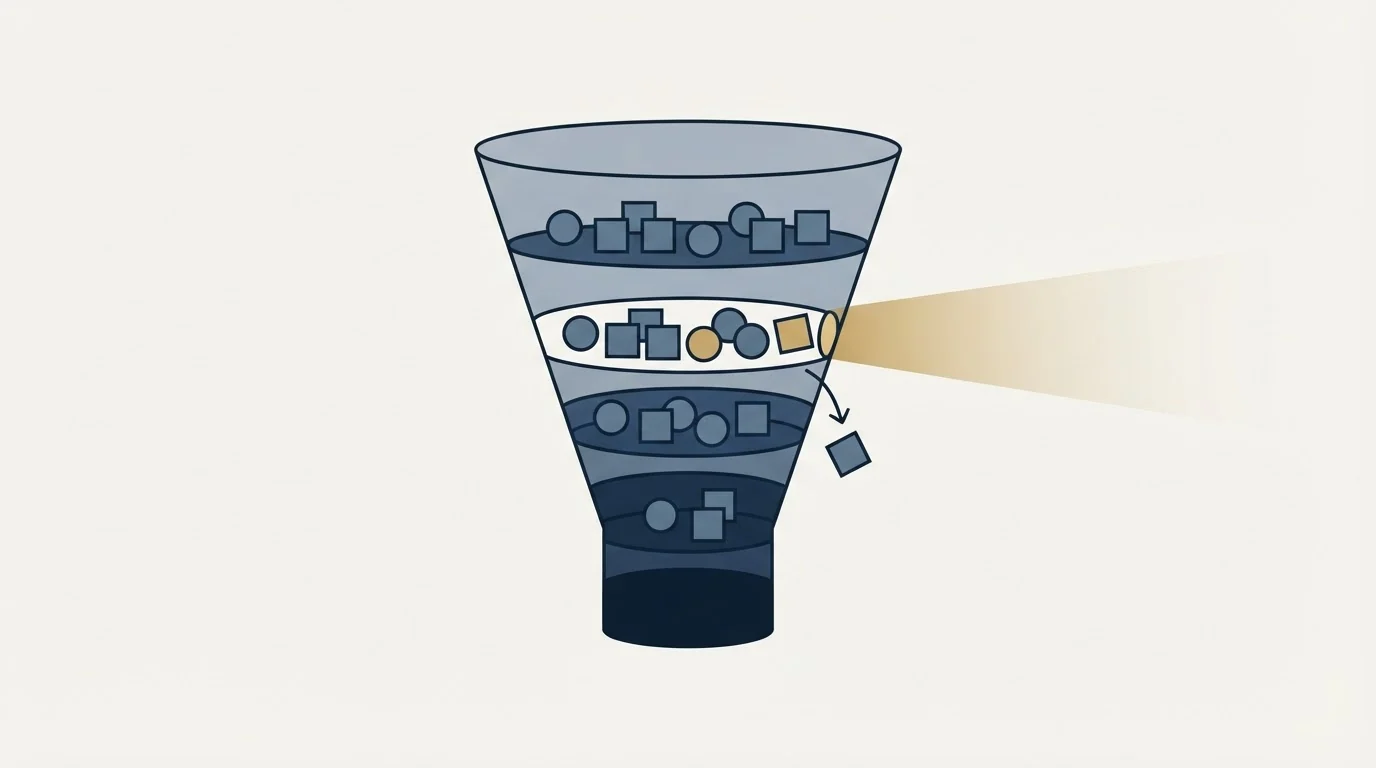
A monthly churn series tells you that customers are leaving. A cohort view tells you when, which is the part you can act on.
Group customers by the month they joined and track each group separately. For every cohort, record what share remains at one month, three months, six months and twelve. Then compare cohorts at the same age rather than in the same calendar month, which is the step that makes the whole exercise work.
Two shapes turn up, and they mean different things.
Losses concentrated in the first ninety days. The customers who leave do so early, and the survivors then persist for a long time. This is an onboarding, expectation or fit problem, and it is the more tractable of the two. Something about the buying conversation promised one thing and the first month delivered another, and the fix is upstream in what is sold and how it is set up.
Steady losses across the whole life. A roughly constant percentage leaves every month indefinitely. This is a value problem: the product works, it was sold accurately, and it is not important enough to survive the annual budget review. Harder to fix and much slower to show improvement.
The cohort view has a second use that is worth the query on its own. Comparing recent cohorts against older ones at the same age is the earliest signal you have that something has changed, and it appears months before the blended monthly rate moves. If the customers who joined this spring are 10 percentage points below where last spring's cohort sat at the same age, something in the product, the pricing or the targeting changed, and you know it in month four rather than in next year's annual review.
The reason this is worth doing even in a small business is that it needs no new instrumentation. Signup date, cancellation date and monthly revenue are already in the billing system, and a single query produces a table that a blended average cannot express.
What churn says about targeting
Two connections matter and both run in the same direction: churn is evidence about targeting.
The first is that churn by acquisition channel is the cheapest quality signal you own. If customers won through one channel leave at twice the rate of another, the second channel is worth more per customer than any cost-per-acquisition comparison will show. Very few teams cut churn this way, and it is a one-off query.
The second is that churn by segment corrects an ideal customer profile faster than win rates do. A segment you close easily and lose quickly is a segment you should stop targeting, and the win-rate view will keep recommending it for as long as you look only at the top of the funnel. Sales-side data says who buys. Churn data says who should have.
Both readings share a property worth naming: they are available to any business that has been selling for a year, they need no new tooling, and almost nobody runs them. The reason is organisational rather than technical. Churn sits with customer success, targeting sits with marketing and sales, and the query that joins them belongs to neither, so it is nobody's job and it does not get done.
Related terms
Net revenue retention nets churn against expansion. Annual recurring revenue is the base it erodes. And sales cycle sets how long a replacement customer takes to arrive.
The short version

Churn rate is losses over a base, and the base is where the argument is. State the period, split logos from revenue, split voluntary from involuntary, and cut it by segment before drawing any conclusion. Then use it in the one place it is most underused, which is deciding who to go after next.
If churn by segment has already told you which customers to target more of, building that list is the next problem: we will build one and show the reasoning.
Frequently asked questions.
Frequently asked questions- How do you calculate churn rate?
- Divide what you lost during the period by what you had at the start of it. For customers, lost logos over starting logos. For revenue, lost recurring revenue over starting recurring revenue. The standard denominator is the base at period start; using an average, or including customers acquired during the period, both produce lower figures.
- What is a good churn rate?
- The question is usually unanswerable as asked, because published figures combine different periods, denominators and definitions. The more useful internal comparison is your own cohorts against each other at the same age, which shows direction of travel and needs no external benchmark to be actionable.
- What is the difference between voluntary and involuntary churn?
- Voluntary churn is a customer choosing to leave, which is a product, value or fit problem. Involuntary churn is a payment failing, usually an expired card, which is a billing problem and generally the cheaper of the two to fix. Reporting them together makes a solvable operational issue look like a market verdict.
- Why does churn matter for deciding who to target?
- Because churn by segment and by acquisition channel says who was worth acquiring, which win rates cannot. A segment you close easily and lose quickly should be dropped from targeting, and the sales-side view will keep recommending it for as long as you look only at the top of the funnel.