Sales Forecast: The Estimate, and What It Gets Confused With
A sales forecast is an estimate of the revenue a team expects to close in a defined future period, built from the open opportunities in the pipeline and a judgment about which will land. It is distinct from a quota, which is an assigned target, and from a plan, which is a commitment made before the period.
Key takeaways
- A forecast is an estimate that should move on new evidence; a quota is an assigned target and a plan is a commitment, and neither moves the same way.
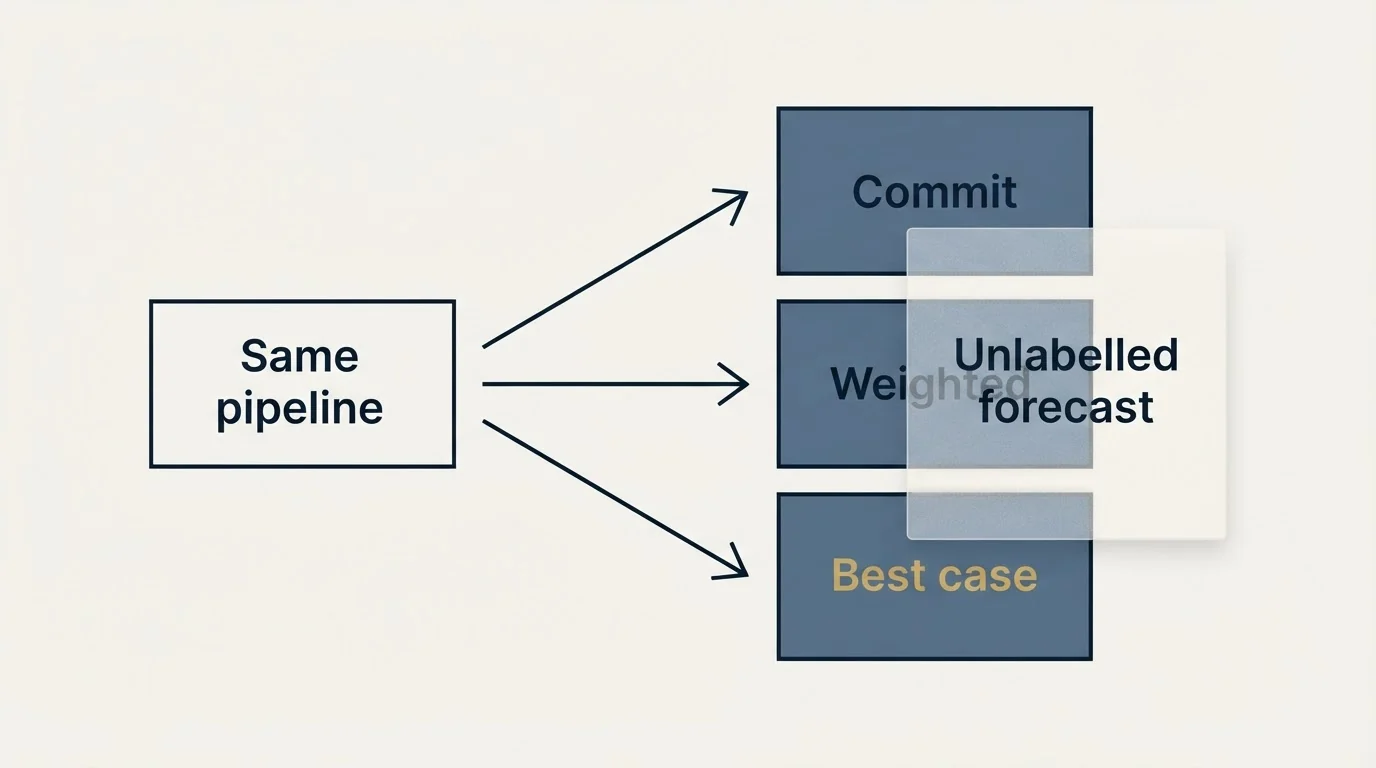
- Commit, weighted and best case are three different quantities on the same pipeline, and an unlabelled forecast tile is silently one of them.
- Moving the boundary at which an opportunity enters the pipeline changes win rate and coverage in opposite directions with nothing happening in the market.
- Forecast error is measurable per seller and per stage after every period, and teams that skip it cannot separate an optimistic seller from an unlucky one.
A sales forecast is an estimate of the revenue a team expects to close in a defined future period, built from the open opportunities in the pipeline and a judgment about which of them will land. It is a prediction of what will happen, produced from records typed in by the people whose performance it describes.
That last clause is not an accusation and it is the most load-bearing fact about the instrument. A forecast inherits the honesty of its inputs, so choosing a forecasting approach is mostly choosing which part of that problem you are willing to live with.
What a forecast is not
Three neighbouring numbers get called a forecast, and the confusion is expensive because each one is produced differently and answers a different question.
A quota is an assigned target: a statement of what somebody is expected to deliver. Total assigned quota commonly exceeds the company plan on purpose, so the plan still lands when a seller misses, which makes quota and forecast deliberately different numbers. A plan or target is what the business committed to before the period started, set from the top down. A forecast is an estimate of the outcome, revised as evidence arrives, and its only job is to be right.
The tell that they have been merged is a forecast that never moves below the target. Where a forecast is treated as a commitment rather than as an estimate, it stops being information and becomes a negotiation, and the organisation loses the one instrument that could have warned it.
A sales projection is a fourth word used in this territory, and it usually means the scenario version of the plan, built from assumptions about the market rather than from the open deals, which is why it should never be read as a forecast.
- Committed to by the business, top down
- Does not move on new evidence
- Drives hiring, spend and board expectations
- Wrong is a planning problem
- A target given to a person or a team
- Sum usually exceeds the plan deliberately
- Drives pay and performance judgement
- Wrong is a compensation and retention problem
- An estimate of the actual outcome
- Should move whenever evidence moves
- Drives in-period decisions about where to spend effort
- Wrong is an accuracy problem, and the only one measurable after the fact
How one is built, and what each method trusts
The published approaches divide into a small number of families, and each one takes a different input and fails in a characteristic way.
Judgement-based forecasting asks the seller what will close and lets a manager adjust it. It is fast, it uses information no system holds, and it requires that people are calibrated and that incentives do not distort what they say. It fails in exactly the quarter it matters, when a bad month makes optimism cheaper than the alternative.
Pipeline-based forecasting multiplies each deal's value by a probability attached to its stage. The arithmetic is only valid where stage membership is an observable fact, so it fails where stages advance on seller activity, at which point the model is multiplying effort by a coefficient and reporting the product as revenue.
History-based forecasting applies a base rate from prior periods to the current one. It is robust and it assumes the business has not changed, so it degrades quietly through a pricing change, a segment shift or a new competitor.
Capacity-based forecasting builds bottom up from accounts, coverage, conversion and deal size. It is the most arguable in a useful way, because every input is a figure somebody can dispute with evidence, and it is the slowest to produce.
A fifth approach is sold as predictive sales analytics, which applies statistical and machine-learning models to the same pipeline history rather than to a human judgment, and it inherits every input problem above because it reads the records the team already typed in; what such a model can and cannot see is set out in AI sales forecasting tools.
Running one method and cross-checking it with a second is worth more than perfecting either. A report that shows the same period two ways and names which deals account for the gap is doing the job; one that shows a single weighted total has hidden its own argument. The four families are compared in detail, with the error measurement each one supports, in sales forecasting methods.
- Step 1Pick the method the data supports
Stage-weighted needs stages defined on buyer actions; history-based needs a business that has not changed.
- Step 2Derive the inputs from your own closed deals
Stage probabilities and cycle lengths measured from your history rather than borrowed.
- Step 3Run one independent cross-check
A second method over the same period, with the gap between them named rather than averaged away.
- Step 4Label every figure before anyone reads it
Commit, weighted and best case are three different quantities and must never share one tile.
Why it matters: an unlabelled forecast is three numbers at once
The single most common defect is not a bad model. It is a figure whose basis nobody stated.
Commit is what a seller will stand behind. Weighted is the pipeline multiplied by stage probabilities. Best case is everything that could conceivably land. Those three quantities differ by a wide margin on the same pipeline, all three are legitimate, and a dashboard tile labelled simply as the forecast is silently one of them. When the person reading it assumes a different one from the person who produced it, the disagreement surfaces at the end of the quarter as a surprise rather than at the start as a question.
The second failure is comparability. Changing the method mid-year, or quietly moving the boundary at which an opportunity enters the pipeline, changes the forecast without anything happening in the market. Tightening the entry boundary raises win rate and lowers coverage; loosening it does the reverse. A dashboard showing both looks like a team that suddenly improved at closing and got worse at generating demand, and the only thing that happened was an edit to a definition. The defence is a dated definition with readable version history.
The third is that accuracy is measurable and mostly not measured. A forecast made at the start of a period can be compared against the outcome, per seller and per stage, and the error is the most useful management number in the area. Teams that do not measure it cannot tell an optimistic seller from an unlucky one, and they treat both the same way.
Making that measurement routine takes one more tab, and the revenue forecast template lays it out as one row per closed period holding what was forecast, what closed, and what slipped out of commit.
Where the textbook definition misleads

Accuracy is not the same as precision. A forecast quoted to the nearest thousand on a pipeline of forty deals implies a resolution the underlying data cannot support. Reporting a range, with the assumptions that move it, is more honest and more useful than a single figure carried to four significant digits.
More frequent forecasting does not improve it. Asking for a weekly submission on a business whose sales cycle runs months produces mostly noise plus the administrative cost of collecting it, and the noise gets read as movement. The useful cadence is the one at which real evidence arrives, which is usually the rhythm of the buying process rather than of the management calendar.
A forecast is not a plan for how to spend the rest of the period. It says what is likely to happen, and the decisions that follow are about where effort goes. Confusing the two produces the familiar end-of-quarter behaviour in which discounting is used to pull deals into the period, which changes the timing and the margin rather than the underlying business.
A tool does not fix the inputs. Forecasting software applies arithmetic to the same self-reported records, faster and more attractively. Where stages advance on seller activity or dead deals sit unclosed, a platform reports the same distortion with more confidence, which is the direction that does harm.
How it is used in outbound
A forecast reaches back into outbound through one property: the lag.
The deals in this period's forecast entered the pipeline a full sales cycle ago, which means the outbound decisions that determine the next forecast are being made now, before anybody has seen this one resolve. If the cycle runs four months and the quarter has eight weeks left, conversations booked today cannot appear in this period's forecast whatever their close dates claim, and treating outbound as an in-period repair produces rushed targeting and opportunities that inflate a weighted total without closing.
The honest response to a mid-period gap is therefore usually to protect the following period rather than to rescue the current one, which is an unpopular thing to say in a forecast review and the correct thing to do. Where the forecast is short because the pipeline was short, pipeline coverage held next to a measured win rate says how much was needed, and the shortfall was created a cycle earlier at the targeting decision.
The second connection is definitional. A forecast built on stage-weighted arithmetic depends on a real event putting an opportunity into the pipeline, and where meetings are bought rather than generated internally, that event is a commercial definition. Our own is a meeting that was attended and met criteria agreed in writing before launch, with budget, timing and authority deliberately excluded because they change every quarter. That keeps the boundary stable, which is the property a forecast needs from it, and the stage definitions that carry it from there are in sales pipeline stages.
- Yes: Every figure is labelled commit, weighted or best case
- Yes: The method is stated, and it has not changed inside the period being compared
- Yes: Stage probabilities are derived from your own closed deals rather than borrowed
- Yes: A second method is run over the same period and the gap is named
- Yes: Deals with a close date inside a window shorter than the median cycle are flagged
- Yes: Forecast error is measured after each period, per seller
- No: The forecast has never been submitted below the target
The last item is the diagnostic worth running once. A forecast that has never gone below target across several periods is not a forecast, and the organisation reading it has been making decisions on a commitment wearing the name of an estimate. Which of the six pipeline metrics belong beside it, and the companion each one needs to be readable, is in six pipeline metrics; how the target it is compared against was built, and the behaviours that number produces, is in sales quota.
Related terms
Pipeline coverage is the ratio a forecast is sanity-checked against, and it is a claim about win rate rather than about volume. Sales velocity holds deal count, value, win rate and cycle length in one expression, which shows which input a higher forecast is assuming will change. Sales cycle is the lag that decides which period a conversation can possibly land in. Quota attainment is the measurement of the target rather than of the estimate.
The short version
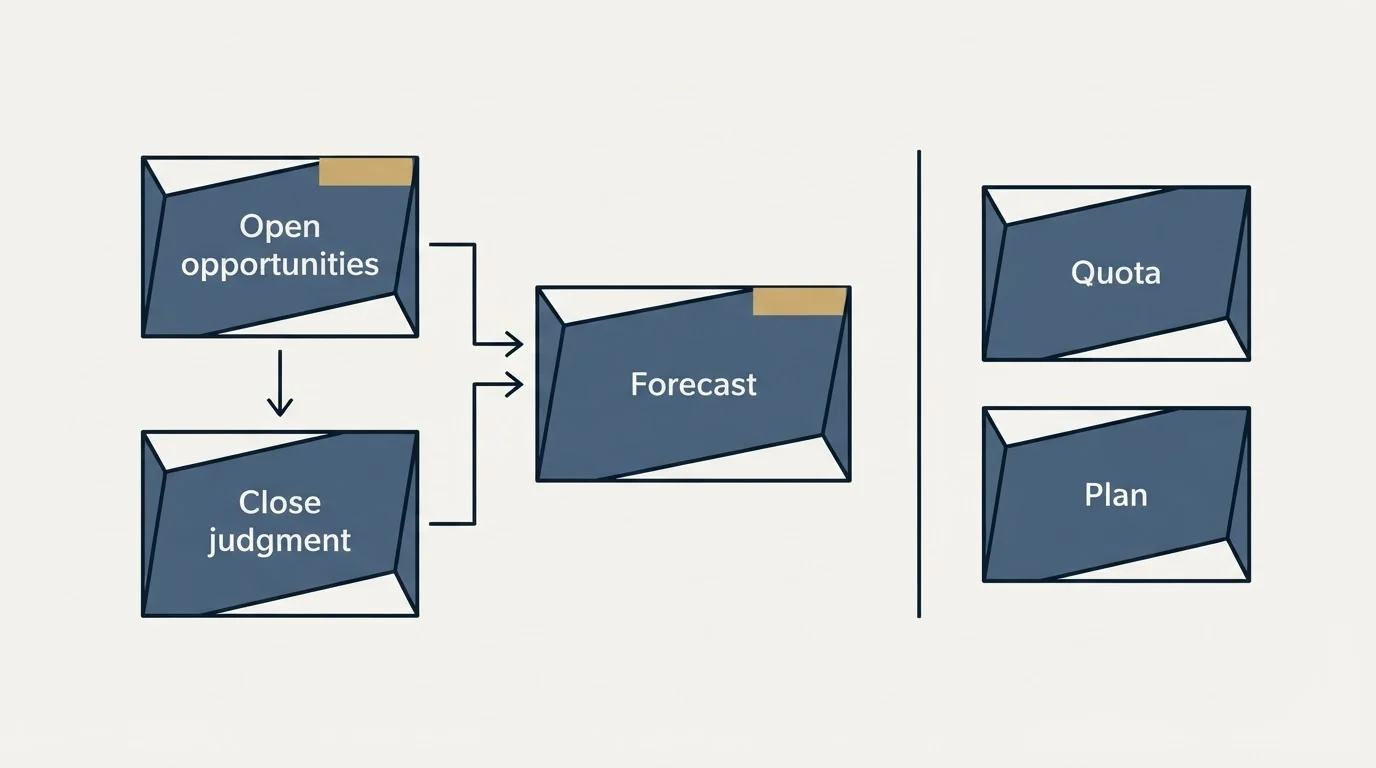
A sales forecast estimates the revenue a period will actually produce, built from open opportunities and a judgment about which will close. Keep it separate from the quota and the plan, because only the forecast is supposed to move. Label every figure as commit, weighted or best case, derive stage probabilities from your own closed deals, run a second method as a cross-check and name the gap, and measure the error after each period. The deals in it entered a cycle ago, so a mid-period gap is usually an instruction about the next period rather than this one.
RevenueFlow supplies what a stage-weighted forecast depends on: attended meetings against criteria agreed in writing before launch. See what a first campaign produces.
Frequently asked questions.
Frequently asked questions- What is the difference between a sales forecast and a quota?
- A forecast estimates what will actually happen and should move whenever evidence moves. A quota is a target assigned to a person or a team, and total assigned quota usually exceeds the company plan on purpose so the plan still lands when some sellers miss. The tell that they have merged is a forecast that never comes in below target.
- Which sales forecasting method is best?
- The one your data supports. Stage-weighted arithmetic needs stages defined on actions the buyer took, history-based methods need a business that has not changed, judgement-based methods need calibrated people and undistorted incentives, and capacity-based methods need account and conversion figures. Running one and cross-checking with a second is worth more than perfecting either.
- Why is my forecast always wrong at the end of the quarter?
- Two causes account for most of it. The figure was never labelled, so the reader assumed commit while the producer meant weighted or best case. Or stages advance on seller activity rather than on buyer actions, which makes the weighting arithmetic multiply effort by a coefficient. Measure the error per seller after each period and the pattern separates the two quickly.
- Can outbound fix a forecast gap this quarter?
- Almost never, because of the lag. Deals in this period's forecast entered the pipeline a full sales cycle ago, so conversations booked today belong to the next period whatever their close dates claim. Treating outbound as an in-period repair produces rushed targeting and opportunities that raise a weighted total without closing, making the following quarter worse.