Revenue Forecast Template: What Each Row Has to Prove
Three tabs, four Commit criteria the buyer has to satisfy, and the accuracy tab that turns a forecast into something which gets better each period.
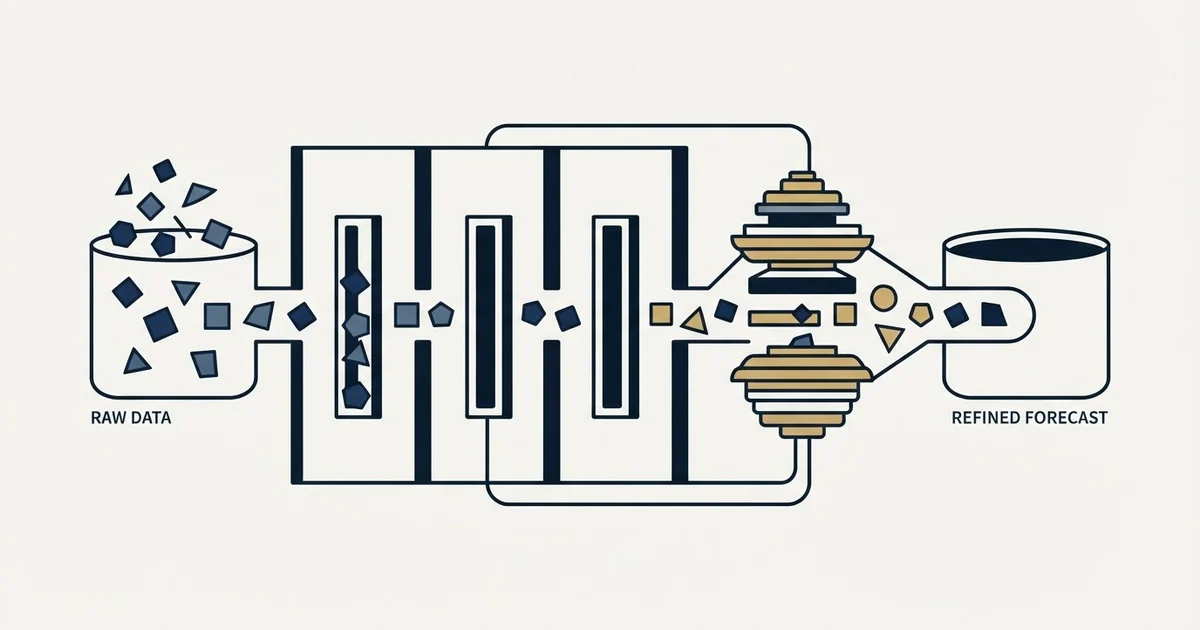
A revenue forecast template for a sales team has three tabs: Deals, one row per open opportunity with a forecast category, a dated next step the buyer owns and a count of close-date slips; Roll-up, reporting Commit, Commit plus Best Case and weighted pipeline; and Accuracy, recording forecast against actual each period.
Key takeaways
- A bookings forecast template is not a financial projection: its unit is one open deal, owned by whoever carries the number.
- Commit needs four written entry criteria, all things the buyer did: a stated decision process and date, the approver engaged, pricing in front of them, and a dated next step.
- The roll-up reports three numbers together, Commit, Commit plus Best Case and weighted pipeline, plus the gap to target.
- The Accuracy tab records forecast against actual as a signed error each period, which is what makes the next forecast better.
Reviewed and updated September 21, 2026
Two completely different artefacts get downloaded under the same name. One is a financial projection: revenue lines, cost of goods, operating expenses, twelve columns across, built by somebody who needs a cash position and a runway number. The other is a bookings forecast: open deals, close dates, amounts, and a judgement about which of them land this quarter, built by somebody who owns a number.
This template is the second one. If you are modelling revenue streams and expenses for a board pack or a loan application, the structure below will frustrate you and a financial projection template will not, and the honest thing is to say so in the first paragraph rather than the tenth.
What follows is the layout, the columns, the entry criteria for each forecast category, and the accuracy tab that turns the whole thing from an opinion into something that gets better.
The one thing a forecast template has to do
A forecast is an estimate of what will close in a period. That is all it is, and the sales forecast entry sets out the three other numbers it gets confused with, because most arguments about a forecast are two people looking at different objects.
The job of the template is narrower than the job of the forecast. The template has to make it hard to record a number without recording what the number rests on. Every forecasting failure worth naming comes from the same place: a deal sits in a column because somebody feels good about it, the column adds up, and nothing in the sheet asks what the buyer did that puts it there.
So every column below exists to hold evidence rather than sentiment.
The revenue forecast template: three tabs
Deals. One row per open opportunity. This is the forecast.
Roll-up. No data entry at all. Formulas only, producing the three numbers that get reported.
Accuracy. One row per closed period, filled in after the fact. This is the tab that makes next quarter's forecast better than this one.
The Deals tab, column by column
Deal name. Account. Owner. Amount. Close date. Stage. Forecast category. Next verifiable step. Next step date. Date the close date last changed. Number of times the close date has moved. Created date. Last buyer-side activity date. Notes.
| Column | What goes in it | Why it is there |
|---|---|---|
| Forecast category | Commit, Best Case or Pipeline | Separate from stage, so a late-stage deal can still be unlikely |
| Next verifiable step | A dated action the buyer owns | Your own planned actions forecast your calendar |
| Close date moves | A count of how many times it slipped | Three slips says more than the stage does |
| Last buyer activity | The date the buyer last did something | Separates a live deal from one kept alive by you |
Four of those are the ones that do the work, and they are the four that get left out.
Forecast category is separate from stage, deliberately. Stage says where the deal is in your process. Category says how confident you are that it closes in this period. A deal can be late-stage and unlikely, and a template that derives category from stage cannot express that.
Next verifiable step has to be something the buyer will do, with a date. Legal review scheduled for the eleventh. Security questionnaire returned by Friday. Send the proposal is your action, not theirs, and a forecast built on your own planned actions forecasts your calendar.
The same discipline governs a spreadsheet CRM, where four tabs and two controlled vocabularies only work once every open row carries a next action with a date.
Number of times the close date has moved is one integer and it is the most diagnostic cell in the sheet. A deal whose close date has slipped three times is not a deal about to close, whatever its stage says, and counting the slips makes that visible without anybody having to argue it.
Last buyer-side activity date separates a live deal from a deal that is being kept alive by your own follow-through.
The three forecast categories, with entry criteria
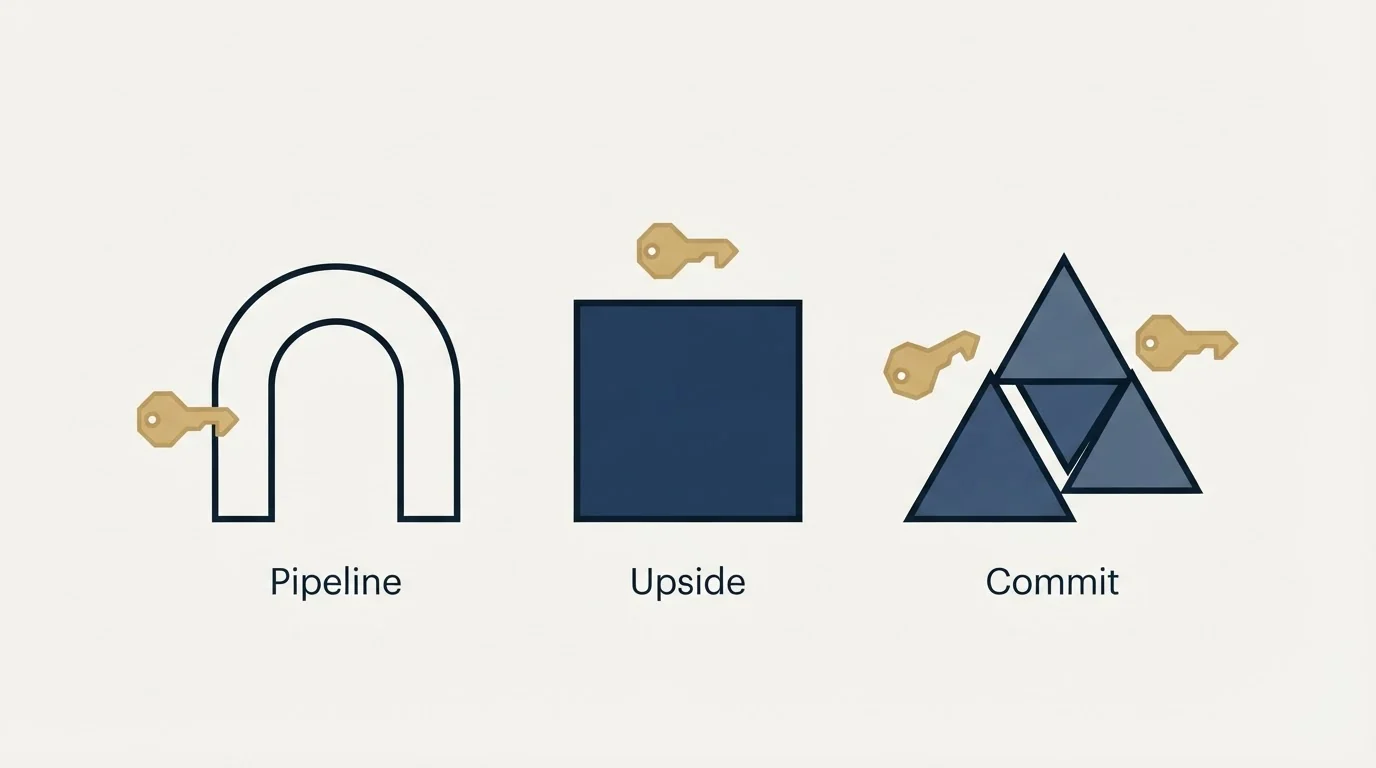
Categories are worthless without written entry criteria, because without them everybody uses their own scale and the roll-up sums three different scales together.
Account plans fail the same way without a finishing test, and the six sections a key account plan carries names what belongs in each one.
Commit. The seller is saying this will close in the period and will be held to it. Entry criteria: the buyer has confirmed the decision process and the date, the economic buyer has been in a conversation, pricing has been discussed with the person who approves it, and there is a next verifiable step with a date inside the period. Anything short of all four is not Commit.
Best Case. Plausible, with a named obstacle. Entry criteria: an active buying process with a dated next step, and one specific thing that has to go right, written in the notes as a sentence.
Pipeline. Everything else that is open. Real, worth working, not being counted on.
The MEDDIC checks are the most widely used version of the same idea, and they map onto Commit almost one for one, which is why the criteria above look familiar.
All four, or not Commit
- The buyer described the decision process and named a date
- The person who approves the spend has been in a conversation
- Pricing has been put in front of that person
- A next step the buyer owns, dated inside the period
Warning signs
- The close date has already moved more than once
- The last activity on the deal was something you sent
The Roll-up tab reports three numbers, never one
A single forecast number destroys the information that made it. The roll-up carries three, always together.
Commit total. The sum of amounts in Commit. This is the number you defend.
Commit plus Best Case. The realistic ceiling for the period.
Weighted pipeline. Every open deal multiplied by a factor for its stage, summed. This is the number to treat with the most suspicion, and the next section says why.
Beside them, put closed-won so far in the period, and the gap between closed-won plus Commit and the target. That gap is the only cell anybody acts on.
Marketing functions that agree to be read on the same closed figure are making an accountability claim, and the number marketing agrees to own describes what that costs a lead-based report.
Coverage belongs here too. Total open pipeline divided by the remaining target gives a ratio, and what that ratio actually assumes about win rate is set out in pipeline coverage, because three to one is a claim rather than a rule.
The weighting question

Stage-weighted forecasting multiplies each deal by the historical win rate of its stage. It is the default in every tool and it hides an assumption that is worth surfacing before you build it into a template.
The assumption is that a deal's probability is a property of its stage. It is not. It is a property of the deal, and stage is a proxy that works well in a high-volume, highly repeatable process and poorly in a small number of large deals. With twelve open deals, the weighted number is a smooth average of a lumpy reality, and it will be wrong in a specific way: it will never predict the actual outcome, because the actual outcome is a sum of whole deals rather than fractions of them.
Use the weighted number as a trend line across periods and use Commit for the period in front of you. What stage weighting actually needs underneath it is stages whose exit criteria the buyer produces, which is the argument in sales pipeline stages, and the layers of software sold on top of the arithmetic are sorted in sales forecasting software.
| Line | Bookings forecast | Financial projection |
|---|---|---|
| Unit of the sheet | One open deal | A revenue line and a cost line |
| Owner | The person carrying the number | Finance |
| Horizon | This period, refreshed weekly | Twelve months or more |
| Judged against | What actually closed | Cash position and runway |
| Output | Three numbers and a gap | A profit and loss shape |
The Accuracy tab
One row per closed period. Period, forecast at the start, forecast at the midpoint, Commit at the start, actual closed, and two derived columns: the error, and the slippage, meaning the value of deals that were in Commit and did not close.
Two things come out of this tab after three or four periods. The first is your own bias, which is almost always in one direction and is far easier to correct once it is a number. The second is which of the Commit criteria your slipped deals were failing, which tells you which criterion to enforce harder.
Record the error as a signed percentage rather than an absolute one. A forecaster who is consistently ten points low is more useful than one who alternates, and an absolute error hides the difference. The reporting side of that discipline sits alongside the rest of the pipeline metrics and the companion each one needs.
In that invented example the forecast came in fifteen percent high against Commit, and the useful next question is not the size of the miss but which of the four Commit criteria the slipped deal failed. That question is answerable only because the criteria were written down before the period started.
Four rules for running it

The forecast is refreshed on a fixed day, by the owner, before the review. A forecast assembled in the review is a conversation, not a record.
A deal moves out of Commit the moment a criterion stops being true. Downgrading is not an admission, it is the mechanism working.
Nobody edits a closed period. The Accuracy tab is only worth anything if it holds what was actually believed at the time.
The amount is the amount the buyer has seen. A forecast built on the deal you hope to sell rather than the one you have proposed is forecasting a different company.
Where the forecast sits against the budget it was built to support, and why the two are different halves of one plan, is covered in sales budget.
The short version
The template is three tabs. Deals, one row per open opportunity, carrying forecast category separately from stage, a next verifiable step the buyer owns, a count of how many times the close date has moved, and the date of the last buyer-side activity. Roll-up, formulas only, reporting Commit, Commit plus Best Case, and weighted pipeline together with the gap to target. Accuracy, one row per closed period, recording what was forecast, what closed, and what slipped out of Commit.
Commit has four written entry criteria and all four are things the buyer did. The weighted number is a trend line rather than a prediction, because a probability belongs to a deal rather than to a stage. The Accuracy tab is the part that compounds, and it is the reason to build the workbook rather than download one.
The forecast can only be as good as the pipeline underneath it. If the gap on the roll-up is a sourcing problem rather than a conversion problem, we can put a campaign in front of your market and you can read what comes back.
Frequently asked questions.
Frequently asked questions- What should a revenue forecast template include?
- Three tabs. Deals holds one row per open opportunity with amount, close date, stage, a separate forecast category, a dated next step the buyer owns, a count of close-date moves and the last buyer activity. Roll-up is formulas only. Accuracy records forecast against actual for every closed period.
- What are the forecast categories in a sales forecast?
- Commit, Best Case and Pipeline. Commit is what the seller will be held to, and it needs four written criteria the buyer has met. Best Case is plausible with one named obstacle written as a sentence. Pipeline is everything else open, worth working but not counted on.
- Should a sales forecast use weighted pipeline?
- As a trend line, not a prediction. Stage weighting multiplies each deal by its stage's historical win rate, which assumes probability belongs to a stage rather than a deal. With a few large deals the weighted sum never matches an outcome made of whole deals, so defend Commit for the period in front of you.
- How do you measure forecast accuracy?
- Record, for each closed period, the forecast at the start and midpoint, Commit at the start, what actually closed, the signed percentage error and the value that slipped out of Commit. After three or four periods your bias shows as a number, and the slipped deals show which Commit criterion needs enforcing.
About the author.

B2B cold email experts helping companies generate qualified leads through done-for-you outreach campaigns.
RevenueFlow Team
Explore more.
Ready to scale your outreach?
We build GTM engines that book real meetings. See the receipts.
Related articles.
Sales Cycle Length Benchmarks: What Each Figure Counts
The published B2B sales cycle benchmarks, sorted by what each page says it counted. The same number means two different things in two of them.
Sales Prospecting for SEO Agencies: Four Public Signals
How an SEO agency builds its own prospect list from signals Google documents: the index check, position, core update dates and site moves, under the warning owners read.
LinkedIn Outreach for Utilities: Selling to the Sector
How a vendor selling to utilities uses LinkedIn next to a published sourcing process: the three ownership models, the registration gate and what a message may ask.
SDR Outsourcing for Business Brokers: The Fee Timing
Whether a success-fee brokerage should rent sales development at all: the fee timing, the texts that limit what an outside person may say about value, and who signs.
SDR Outsourcing for Financial Services: The Third Party
What a bank, broker-dealer, adviser or agency's regulators say about an outside team that speaks for it, the licensed line, and which arrangement survives due diligence.
SDR Outsourcing for Agriculture Companies
Whether an outside sales development team can work for a company selling into agriculture: who already covers the account, which weeks exist, and the show rule.