Sales Pipeline: The Open Deals, and What the Total Cannot Tell You
A sales pipeline is the set of open opportunities a team is working, each with a value, a stage and an expected close date. It shows what could close rather than what has. Its total is its least informative number, because a standing balance hides a collapse in new business for a cycle, so read pipeline created per period too.
Key takeaways
- A sales pipeline counts open deals as money and stages, while a funnel counts people as proportions surviving each step, and mixing the two breaks the arithmetic.
- A stage only means something when its exit criterion names an action the buyer took that two people reading the record would agree on.
- Open pipeline value barely moves when new business stops, so pipeline created per period is the leading indicator and the one most often missing.
- Conversations started today are next quarter's pipeline whatever the close dates claim, because a pipeline lags the targeting decision by a full sales cycle.
A sales pipeline is the set of open opportunities a team is currently working, each carrying a value, a stage and an expected close date. It is a view of deals in progress at one moment, which makes it a statement about what could close rather than a record of what has.
Pipeline in sales means that specific object rather than the general idea of work in progress: a countable set of open deals, each attached to a company and a value, sitting in a named stage. The word is used loosely enough elsewhere that the precision is worth stating, because almost every argument about pipeline turns out to be an argument about what was counted.
What is a sales pipeline?
A sales pipeline is the list of deals a team has open right now, each with a value, a stage and an expected close date. It answers three questions: how much could close, where each deal stands, and when. It is a different object from a funnel, which counts people, from a forecast, which weights deals by probability, and from bookings, which counts what already closed.
Pipeline, funnel, and why the distinction is not pedantry
A funnel counts people moving through awareness toward a purchase, as proportions surviving each step. A pipeline counts open deals, as money and stages. One describes a population and the other describes a workload, and the two are frequently drawn on the same slide with the same shape.
The consequence of mixing them shows up in the arithmetic. A funnel conversion rate is a share of a cohort; a pipeline stage conversion is a share of deals that entered a stage. A contact can sit on three open opportunities at once, so counting people and counting deals give different answers about the same business. Where the two vocabularies are used interchangeably, funnel and pipeline compared sets out which counting rule belongs to which.
What a stage is, and the test that makes the total mean something
Stages are the structure that turns a list of deals into something readable, and they only work when membership is an observable fact rather than an opinion.
The test is whether the exit criterion for each stage names something the buyer did, phrased so two people reading the same record would agree on whether it happened. A criterion describing seller activity always passes, because a seller can send an email and log a call without the buyer doing anything at all, and a pipeline whose stages advance on seller activity multiplies revenue by optimism and reports the product as a forecast. The stage design that survives that test, and the stages worth deleting, are in sales pipeline stages.
That single property is what everything downstream depends on. Weighted forecasting assigns a probability per stage and multiplies; the arithmetic is only valid if stage membership is a fact. Time in stage tells you where deals die; it is only comparable if the same event moves every deal across the same boundary.
Why it matters: the total is the least informative number in it
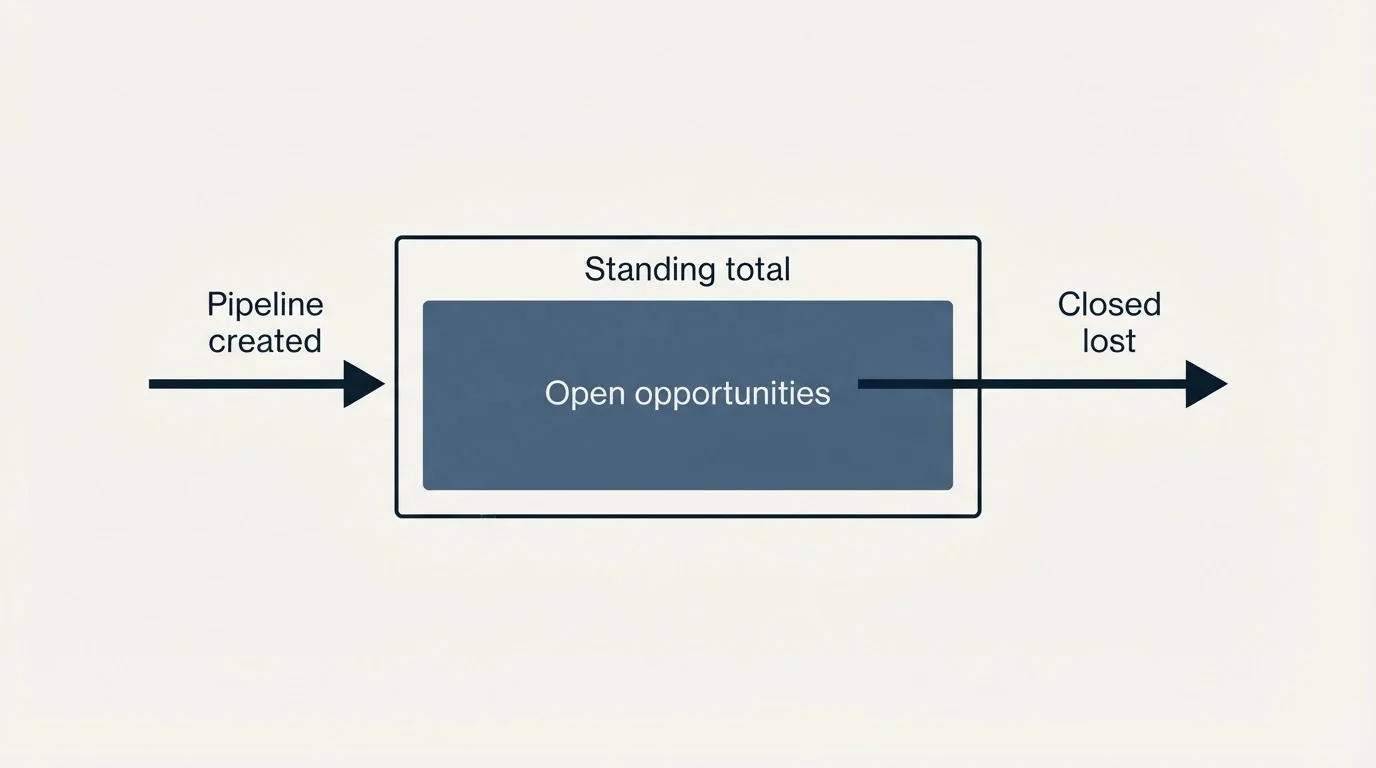
A pipeline is a standing balance, and standing balances hide the thing you most need to see.
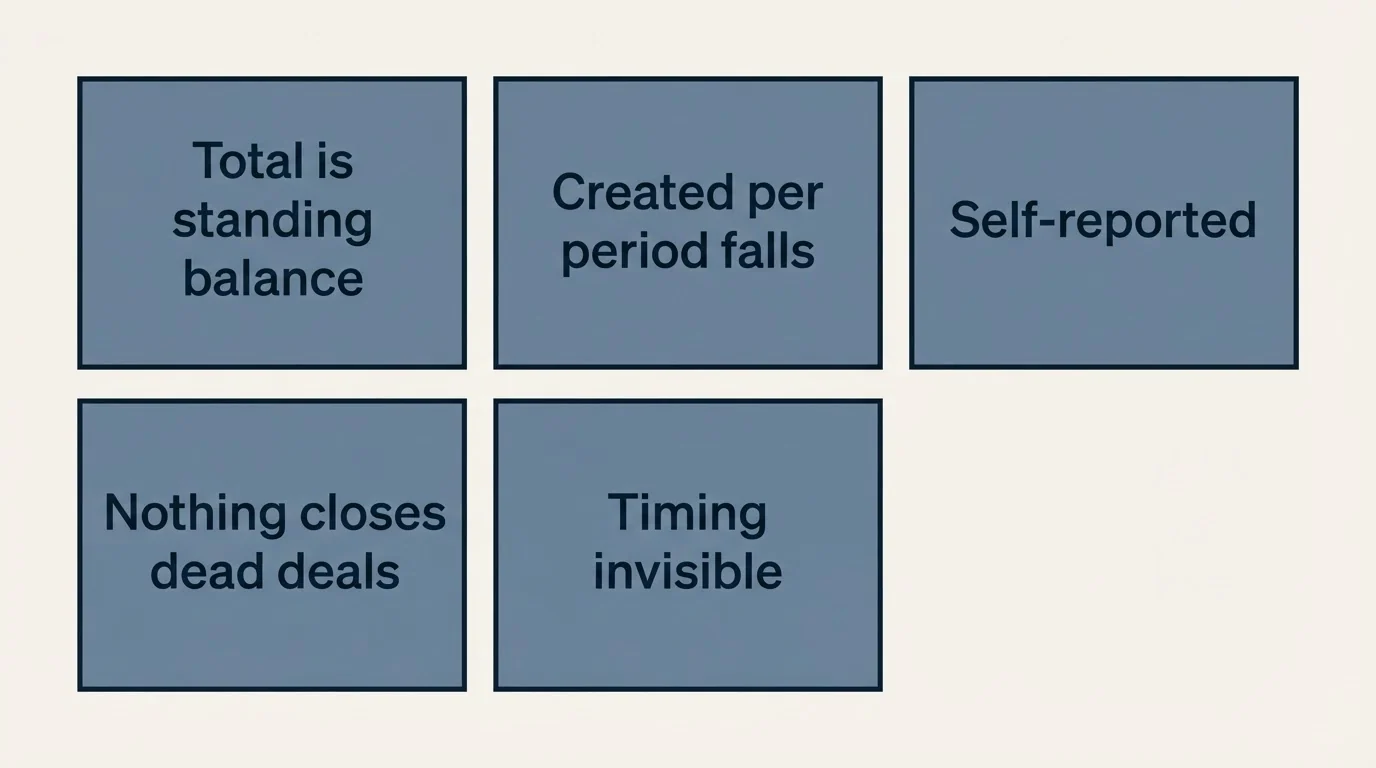
Open pipeline value rises when deals are created and falls when they close, so in a period where both happen at similar rates the total barely moves. A team that stopped generating new opportunities six weeks ago and is still closing the ones it had will show a stable pipeline value well into the following cycle, and the first visible symptom will be a quarter with nothing left to close. The figure that already fell is pipeline created per period, and it fell in the week the problem started.
Three further properties make the total soft in ways the number does not advertise.
It is self-reported by the people it describes. Deal values, stages and close dates are typed in by sellers whose performance the pipeline measures. That is a structural property rather than an accusation, and it means a pipeline is only as honest as its entry criteria and its cleaning schedule.
Nothing in a CRM closes a dead deal. Pushing a close date is invisible and marking a deal lost is a visible act, so pipelines accumulate opportunities that inflate the total while contributing nothing. The count of deals whose close date has moved more than twice is the cheapest instrument that catches it, and almost no default dashboard carries it.
Timing is invisible in a total. An opportunity created last week, in a market where deals take five months, is not this quarter's pipeline in any meaningful sense even though its close date says otherwise.
Where the textbook definition misleads

A bigger pipeline is not automatically better. A ratio well above what your win rate requires usually means the pipeline is carrying deals that should have been disqualified, which is a qualification problem arriving disguised as good news. The reciprocal relationship between the multiple and the win rate is worked through in pipeline coverage.
Cleaning it looks like damage. Removing dead opportunities lowers the total and raises the forecast's accuracy, and only one of those is visible in a board pack. Clean on a fixed schedule that has nothing to do with when the numbers are being presented, because a pipeline cleaned the week before a review looks like a business that shrank.
A stage change is not progress unless the buyer caused it. This is the same point as the exit criterion, and it is worth stating twice because it is the one that decays quietly. Stages defined on buyer actions at design time drift toward seller activity as people fill in fields under time pressure.
An average across segments describes neither. Enterprise and mid-market deals convert at different rates and run at different lengths, so one blended cycle length or conversion rate is guaranteed to be wrong for at least one of them, and usually flattering to the segment doing worse.
How it is used in outbound
The property that matters most to an outbound programme is the lag, and it changes what an honest response to a gap looks like.
A pipeline is a lagging view of a targeting decision made a full sales cycle earlier. If the cycle runs four months and the quarter has eight weeks left, conversations started today are next quarter's pipeline however quickly they are booked. Treating outbound as an in-period repair produces rushed targeting and a set of opportunities that raise the total without ever closing, which makes the following quarter worse rather than better.
The two figures that connect outbound to the pipeline are meeting-to-opportunity conversion and the reason distribution for meetings that did not convert. The first says whether the meetings are the right meetings. The second says what to change, and only when the reasons come from a fixed list, because free-text reasons cannot be counted. Where they concentrate on seniority or company fit, the instruction is for the targeting. Where they concentrate on timing, it is usually for the segment rather than for the campaign.
Our own commercial position depends on the entry point being defined precisely. We are paid on attended meetings that meet criteria agreed in writing before launch, and budget, timing and authority are deliberately outside that definition, because they change every quarter and a meeting that happened should not become unqualified retrospectively. That keeps the meeting-to-opportunity figure measuring fit rather than the buyer's mood on the day.
Which metrics are worth carrying beside the pipeline, and the companion each one needs to be readable, is in six pipeline metrics. When deals are already in the pipeline and not moving, the diagnostic order is in pipeline acceleration, whose argument applies here: a deal described as stuck frequently never moved at all, and the fix sits at the entry criterion rather than in more contact.
Should be true
- Pipeline created per period is reported beside the standing balance
- Every stage exit criterion names something the buyer did
- Deals whose close date has moved more than twice are counted separately
- Anything created too recently to close inside the period is excluded
- The figures are split wherever the sales motion genuinely differs
Warning signs
- One large opportunity is carrying the whole total
- The pipeline was cleaned in the week before the review
None of that needs a dedicated analytics platform, and buying one first usually delays the work. Five saved views cover most of it: open deals with no next step, deals whose close date has moved more than twice, deals whose close date falls inside a window shorter than the median cycle, age in current stage grouped by stage, and created value by period. Each will expose a data-quality problem, which is the argument for building them before buying a tool that would report the same problems more attractively.
Related terms
Pipeline coverage is the pipeline expressed as a multiple of the target, and it is only readable next to a measured win rate. Sales velocity holds deal count, value, win rate and cycle length in one expression. Sales cycle is the length a stage-based forecast has to respect. Sales qualified opportunity is what enters the pipeline, and qualified appointment is the commercial test a bought meeting has to pass before it becomes one.
The short version
A sales pipeline is the set of open opportunities, each with a value, a stage and a close date. Its total is the least informative number in it, because a standing balance hides a collapse in new business for a full cycle and accumulates deals nobody has closed as lost. Read pipeline created per period beside it, define every stage on something the buyer did, clean on a schedule divorced from the reporting calendar, and remember that today's conversations are next quarter's pipeline whatever the close dates claim.
RevenueFlow supplies the entry point: attended qualified meetings against criteria agreed in writing before launch. See what a first campaign produces.
Frequently asked questions.
Frequently asked questions- What is a sales pipeline?
- A sales pipeline is the set of open opportunities a team is currently working, each carrying a value, a stage and an expected close date. It is a view of deals in progress at one moment, so it describes what could close and not what has. Closed deals, won or lost, leave the pipeline.
- What is the difference between a sales pipeline and a sales funnel?
- A funnel counts people moving toward a purchase, as proportions surviving each step. A pipeline counts open deals, as money and stages. One describes a population and the other a workload. A single contact can sit on three open opportunities at once, so counting people and counting deals give different answers about the same business.
- Why is total pipeline value a misleading number?
- Because it is a standing balance. It rises when deals are created and falls when they close, so a team that stopped generating opportunities weeks ago can show a stable total while it closes what it already had. It is also self-reported by sellers, inflated by dead deals nobody marked lost, and blind to timing.
- How do you measure a sales pipeline properly?
- Report pipeline created per period beside the standing total, define every stage exit on something the buyer did, count deals whose close date has moved more than twice, exclude anything created too recently to close in the period, and split figures wherever the sales motion differs. Five saved CRM views cover most of it.