Cold Email A/B Testing Benchmarks: 2026 Performance Data
Industry data shows systematic A/B testing improves cold email performance by 15-30% over time. Discover the benchmarks for test design, sample sizes, and expected lift.
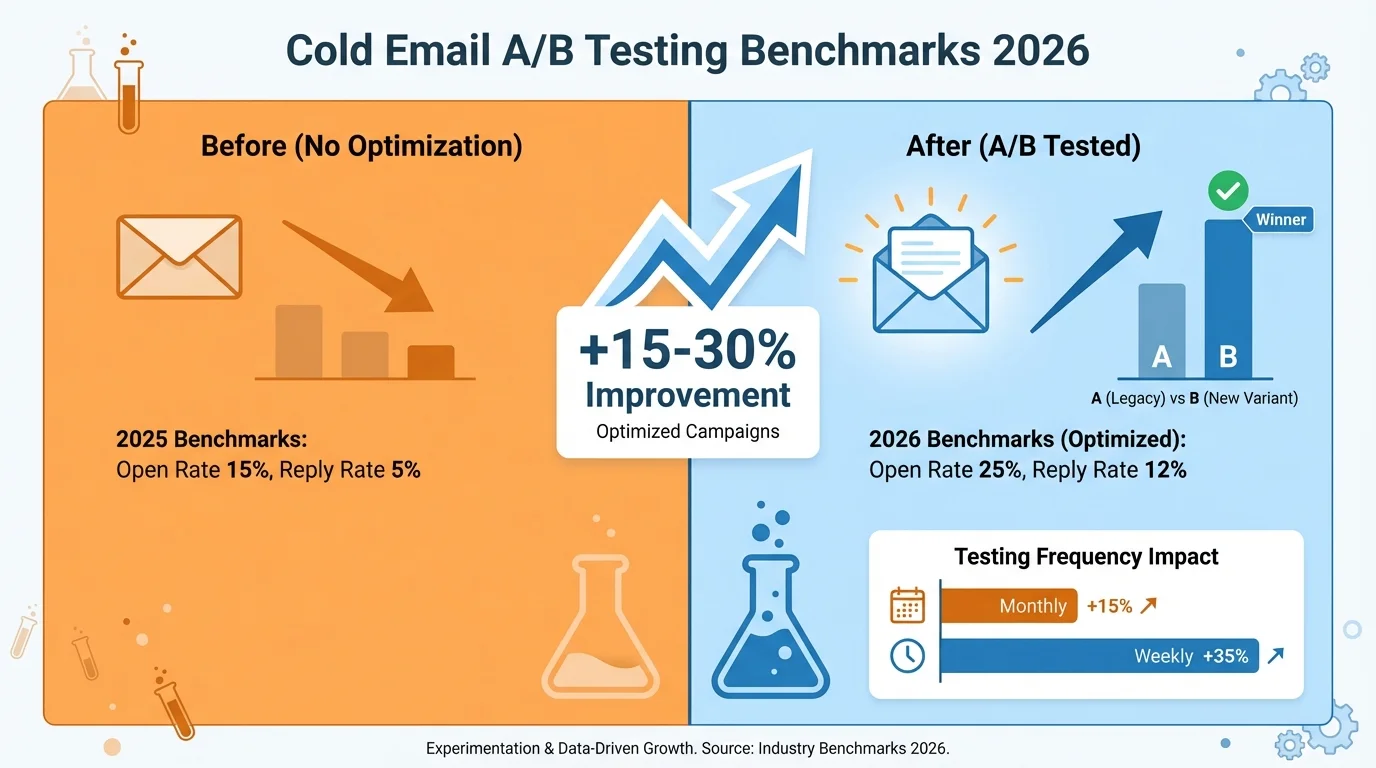
Systematic A/B testing improves cold email performance by 15-30% over time, with teams testing weekly achieving 35-55% lift after 12 months. Subject lines and opening lines produce the highest impact (10-40% improvement), while most tests require 200-300 sends per variant at 90% confidence. High-impact elements should be tested first, with subject lines, openings, and value propositions prioritized over formatting or signature changes.
Key takeaways
- Teams testing weekly achieve 35-55% performance lift over 12 months, while monthly testing yields 15-25% improvement.
- Subject line tests produce 10-40% typical lift and should be prioritized first, followed by opening lines at 10-30%.
- Most cold email tests require 200-300 sends per variant to reach 90% confidence level for decision-making.
- Reply rate tests need 300-500 samples per variant due to lower baseline rates of 3-5%, while open rate tests need only 150-200.
- Subject lines including the company name win 65% of tests, and specific references win 70% of tests.
Reviewed and updated September 15, 2026
Cold Email A/B Testing Benchmarks: 2026 Performance Data
A/B testing is the foundation of cold email optimization. Industry data shows that teams who systematically test and iterate on their campaigns achieve 15-30% better performance over time compared to those who rely on intuition alone. Understanding testing benchmarks helps you design experiments that produce actionable insights.
This benchmark report covers the performance impact of A/B testing, optimal test designs, required sample sizes, and expected improvements for different email elements.
About This Data
The benchmarks presented in this report are compiled from publicly available industry research, aggregated data from sales engagement platforms, and typical ranges observed across B2B cold email campaigns. These figures represent industry estimates and general ranges rather than definitive standards. Your actual results will vary based on your specific industry, target audience, and testing rigor.
We recommend using these benchmarks as directional guidance while establishing your own testing program.
Value of A/B Testing: Performance Impact
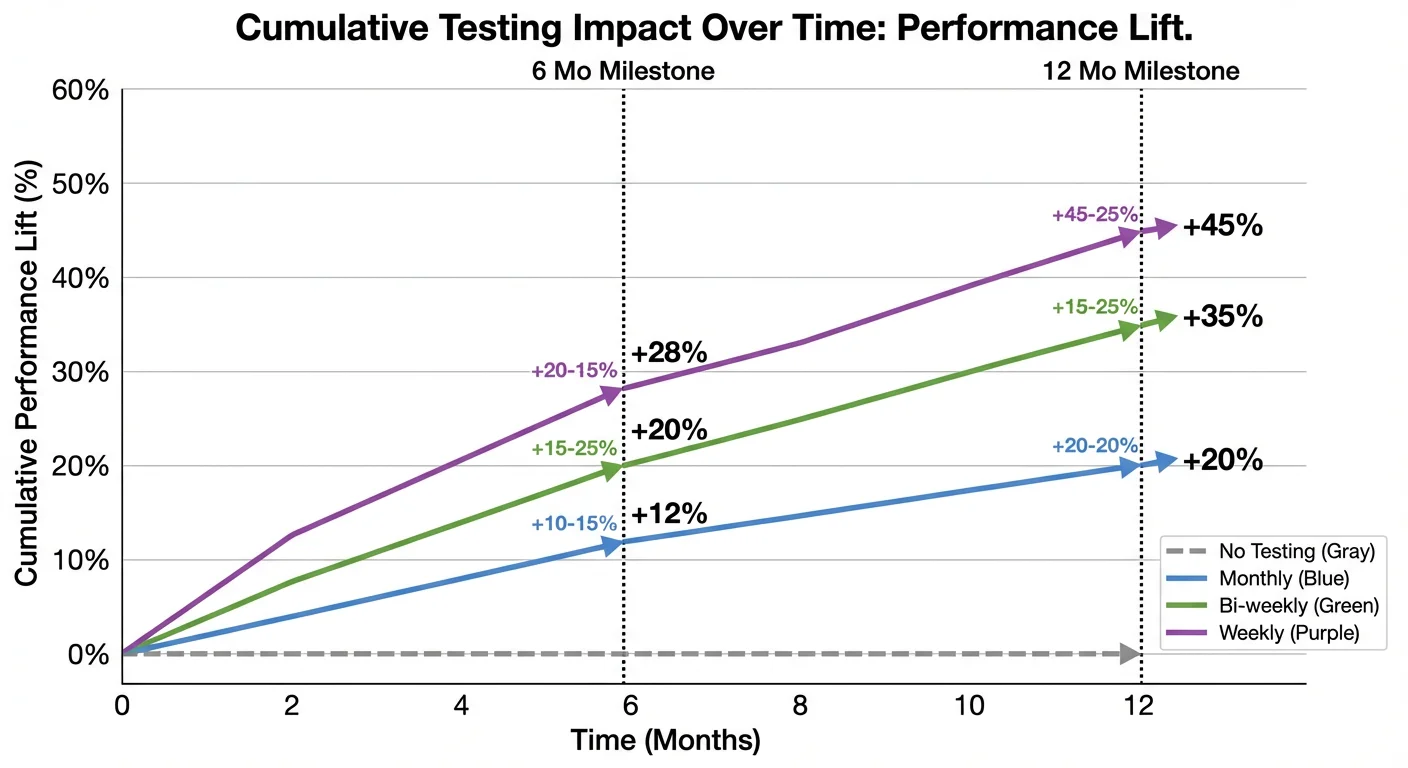
Systematic testing produces measurable improvements over time.
Cumulative Testing Impact
| Testing Frequency | 6-Month Performance Lift | 12-Month Lift |
|---|---|---|
| No testing | Baseline | Baseline |
| Monthly testing | +10% - 15% | +15% - 25% |
| Bi-weekly testing | +15% - 25% | +25% - 40% |
| Weekly testing | +20% - 35% | +35% - 55% |
Teams that test consistently compound small improvements into significant performance advantages.
ROI of Testing
| Investment | Typical Return |
|---|---|
| Time per test (setup) | 1-2 hours |
| Time per test (analysis) | 30-60 minutes |
| Average lift per winning test | 5% - 15% |
| Tests needed for significant improvement | 4-6 per quarter |
The time invested in testing typically yields substantial returns in campaign performance.
Sample Size Requirements
Teams describe this as testing outbound message wording to find what converts, and the sample sizes below are the constraint that decides whether any of it means anything; note also that where a programme sends one message per campaign, the unit under test is the whole campaign rather than a step inside a sequence.
Achieving statistical significance requires adequate sample sizes.
Minimum Sample Sizes by Confidence Level
| Confidence Level | Minimum per Variant | Recommended per Variant |
|---|---|---|
| Directional (70%) | 50-100 | 75-100 |
| Standard (90%) | 200-300 | 250-350 |
| High (95%) | 400-500 | 450-550 |
| Very High (99%) | 800-1000 | 900-1100 |
For most cold email testing, 200-300 sends per variant provides sufficient confidence for decision-making.
Sample Size by Metric Type
| Metric | Baseline Rate | Min Sample per Variant |
|---|---|---|
| Open rate | 40% - 50% | 150-200 |
| Reply rate | 3% - 5% | 300-500 |
| Positive reply rate | 1.5% - 3% | 500-800 |
| Meeting conversion | 1% - 2% | 800-1200 |
Lower baseline rates require larger sample sizes to detect meaningful differences.
Sample Size Calculator Reference
| Expected Lift | Baseline Rate | Sample Needed |
|---|---|---|
| 10% improvement | 5% | ~800 per variant |
| 20% improvement | 5% | ~400 per variant |
| 30% improvement | 5% | ~200 per variant |
| 50% improvement | 5% | ~100 per variant |
Larger expected effects require smaller samples to detect.
Testing Elements: Expected Lift
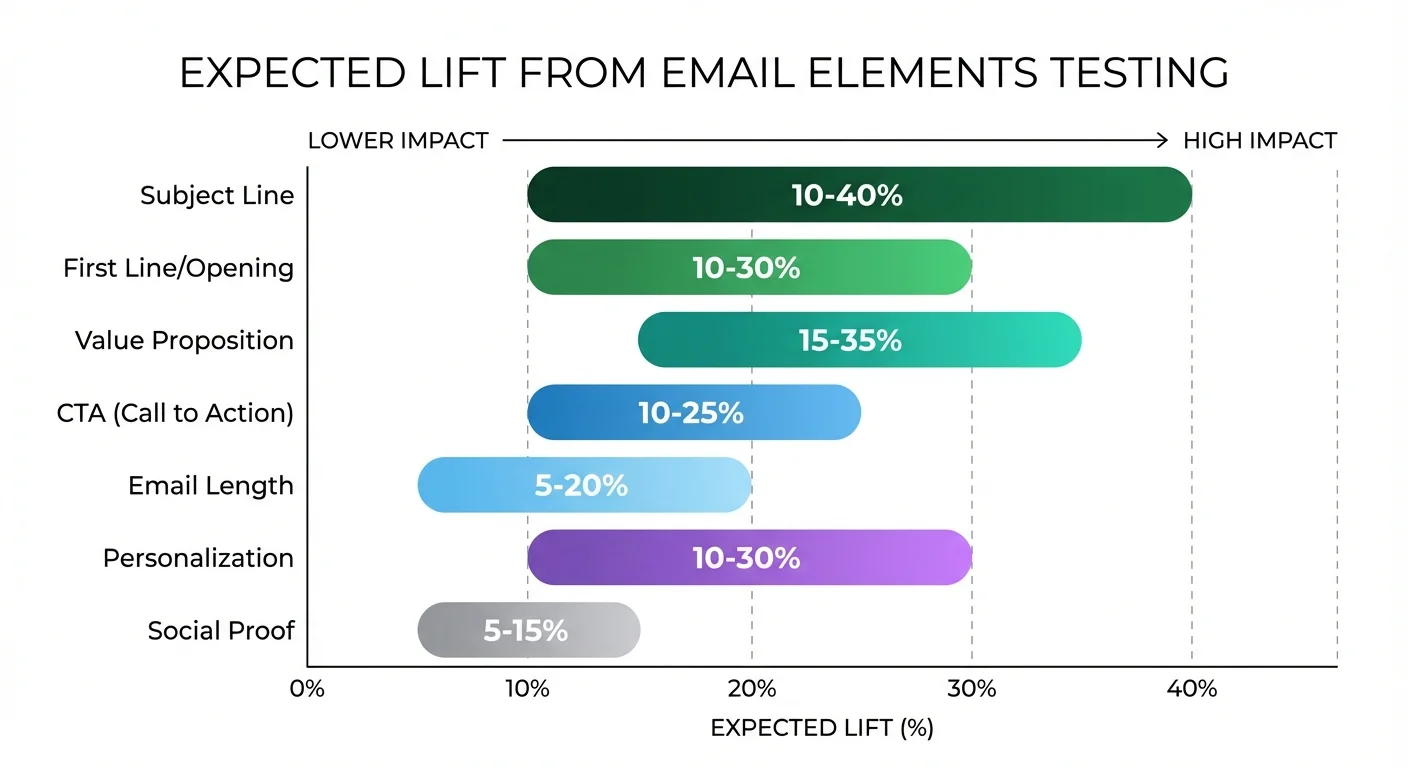
Different email elements produce different improvement potential.
High-Impact Elements
| Element | Typical Test Lift | Priority |
|---|---|---|
| Subject line | 10% - 40% | Test first |
| First line/opening | 10% - 30% | Test second |
| Value proposition | 15% - 35% | Test third |
| CTA | 10% - 25% | Test fourth |
Subject lines and openings have the highest impact potential and should be prioritized.
Medium-Impact Elements
| Element | Typical Test Lift | Priority |
|---|---|---|
| Email length | 5% - 20% | Test after high-impact |
| Personalization level | 10% - 30% | Context-dependent |
| Social proof inclusion | 5% - 15% | Valuable to test |
| Formatting/structure | 5% - 15% | Worth testing |
Lower-Impact Elements
| Element | Typical Test Lift | Priority |
|---|---|---|
| Signature format | 2% - 8% | Lower priority |
| P.S. line inclusion | 3% - 10% | Worth testing occasionally |
| Link placement | 2% - 8% | Minor optimization |
| Font/visual styling | 1% - 5% | Minimal impact |
Focus testing effort on high-impact elements first.
Subject Line Testing Benchmarks
Subject lines typically show the largest testing improvements.
Subject Line Test Types
| Test Type | Expected Lift | Example |
|---|---|---|
| Personalized vs. generic | +20% - 40% | "[Company] growth" vs. "Quick question" |
| Question vs. statement | +5% - 20% | "Struggling with X?" vs. "Solution for X" |
| Short vs. medium length | +5% - 15% | "Quick thought" vs. "Quick thought about [topic]" |
| Specific vs. vague | +10% - 25% | "[Specific topic]" vs. "Important update" |
Subject Line Testing Best Practices
| Practice | Impact on Results |
|---|---|
| Test one variable at a time | Clear attribution |
| Keep email body identical | Isolates subject impact |
| Test across full week | Accounts for day variation |
| Use same audience segment | Fair comparison |
Winning Subject Line Patterns
Based on aggregate testing data:
| Pattern | Win Rate in Tests |
|---|---|
| Company name included | 65% win rate |
| Question format | 58% win rate |
| Under 50 characters | 62% win rate |
| Specific reference | 70% win rate |
Opening Line Testing Benchmarks
The first line determines whether readers continue or click away.
Opening Line Test Types
| Test Type | Expected Lift | Notes |
|---|---|---|
| Personalized vs. generic | +15% - 35% | High impact |
| Observation vs. compliment | +5% - 15% | Both can work |
| Question vs. statement | +5% - 15% | Variable results |
| Trigger-based vs. general | +20% - 40% | When triggers exist |
High-Performing Opening Patterns
| Pattern | Typical Performance |
|---|---|
| Specific company observation | Highest reply rates |
| Recent trigger reference | Very high |
| Mutual connection mention | High |
| Role-specific pain point | High |
| Generic compliment | Medium |
| "Hope this finds you well" | Lowest |
CTA Testing Benchmarks
Call-to-action tests often reveal surprising preferences.
CTA Test Types
| Test Type | Expected Lift | Notes |
|---|---|---|
| High vs. low friction | +20% - 40% | Big differences common |
| Question vs. statement | +10% - 25% | Questions often win |
| Specific vs. vague | +10% - 20% | Specificity helps |
| Time-bounded vs. open | +5% - 15% | Varies by audience |
CTA Testing Results
| Comparison | Typical Winner | Win Margin |
|---|---|---|
| "15-min call" vs. "30-min meeting" | Shorter time | +15% - 25% |
| "Quick chat" vs. "Demo" | Lower friction | +20% - 35% |
| Question CTA vs. statement | Question | +10% - 20% |
| Calendar link vs. no link | Varies | +/- 5% - 15% |
Email Length Testing Benchmarks
Length tests often produce clear winners.
Length Test Results
| Comparison | Typical Winner | Win Margin |
|---|---|---|
| 50 words vs. 100 words | Shorter | +15% - 25% |
| 75 words vs. 150 words | Shorter | +20% - 35% |
| 100 words vs. 200 words | Shorter | +25% - 45% |
Shorter emails almost always outperform longer versions in testing.
When Longer Wins
| Scenario | Why Longer Helps |
|---|---|
| Complex technical product | Needs explanation |
| High personalization | Research deserves space |
| Executive referral | Context from referrer adds value |
Sequence Testing Benchmarks
Testing sequence structure produces compound improvements.
Sequence Test Types
| Test Type | Expected Impact |
|---|---|
| Number of emails | +10% - 25% on cumulative reply |
| Spacing between emails | +5% - 15% on reply rate |
| Email order | +5% - 20% on engagement |
| Breakup email approach | +10% - 30% on final email |
Sequence Length Test Results
| Comparison | Typical Result |
|---|---|
| 3 emails vs. 5 emails | 5 emails: +30% - 50% total replies |
| 5 emails vs. 7 emails | 7 emails: +10% - 20% total replies |
| Daily spacing vs. 3-day | 3-day: +15% - 30% reply rate |
Testing Framework and Process
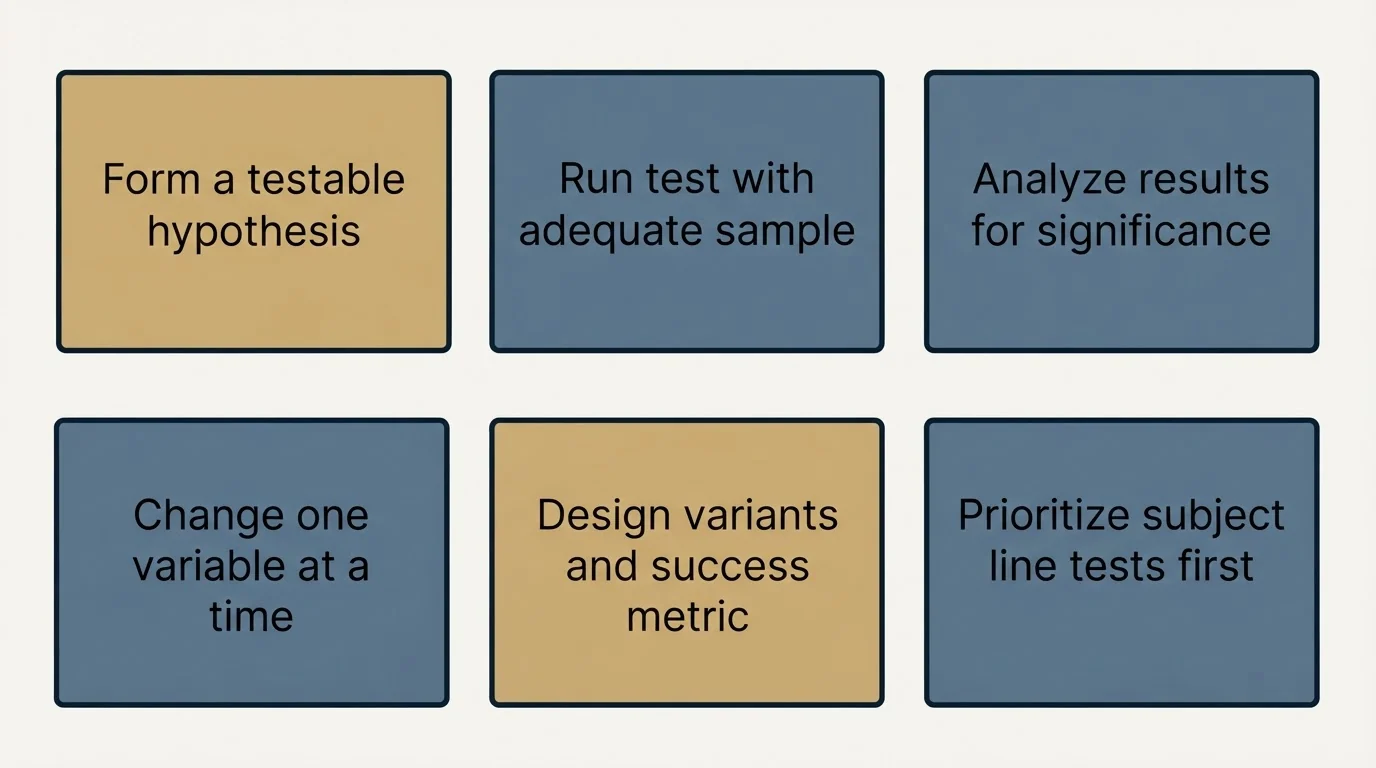
Structured testing produces reliable results.
The Testing Cycle
| Phase | Activities | Duration |
|---|---|---|
| Hypothesis | Form specific, testable prediction | 1 day |
| Design | Create variants, define success metrics | 1 day |
| Execute | Run test with adequate sample | 1-2 weeks |
| Analyze | Evaluate results, determine significance | 1 day |
| Implement | Apply winning variant broadly | 1 day |
| Document | Record learnings for future reference | 30 minutes |
Test Design Principles
| Principle | Implementation |
|---|---|
| One variable at a time | Only change tested element |
| Randomized assignment | Random prospect allocation |
| Simultaneous sending | Send variants same day/time |
| Adequate sample size | Meet minimum thresholds |
| Clear success metric | Define primary KPI upfront |
Testing Prioritization Matrix
| Priority | Element | Expected Impact | Effort |
|---|---|---|---|
| 1 | Subject line | Very High | Low |
| 2 | Opening line | High | Medium |
| 3 | CTA | High | Low |
| 4 | Value proposition | High | Medium |
| 5 | Email length | Medium | Low |
| 6 | Sequence structure | High | High |
| 7 | Send timing | Medium | Low |
Statistical Significance Guidelines
Understanding when results are meaningful.
Interpreting Results
| Confidence Level | Interpretation | Action |
|---|---|---|
| Below 70% | Not significant | Continue testing |
| 70% - 80% | Directional | Tentative decision |
| 80% - 90% | Likely significant | Reasonable to implement |
| 90% - 95% | Significant | Confident implementation |
| Above 95% | Highly significant | Strong implementation |
Common Statistical Mistakes
| Mistake | Problem | Solution |
|---|---|---|
| Stopping early | Premature conclusions | Commit to sample size |
| Ignoring sample size | False confidence | Calculate requirements |
| Multiple comparisons | Inflated false positives | Adjust for multiple tests |
| Cherry-picking metrics | Misleading conclusions | Pre-define success metric |
Multi-Variant Testing
Testing more than two variants simultaneously.
When to Use Multi-Variant Tests
| Scenario | Approach |
|---|---|
| Many variant ideas | Test 3-4 variants |
| Screening phase | Broad initial test |
| Time constraints | Parallel testing |
| High volume available | Leverage sample size |
Multi-Variant Sample Requirements
| Number of Variants | Sample per Variant | Total Sample |
|---|---|---|
| 2 variants | 250 | 500 |
| 3 variants | 200 | 600 |
| 4 variants | 175 | 700 |
| 5 variants | 160 | 800 |
Sample requirements per variant decrease slightly as variant count increases, but total sample needed grows.
Testing Documentation and Learning
Building institutional knowledge from tests.
Test Documentation Template
| Field | Purpose |
|---|---|
| Hypothesis | What you predicted |
| Test design | Variables, variants, sample |
| Results | Quantitative outcomes |
| Confidence | Statistical significance |
| Winner | Which variant won |
| Learning | What this teaches us |
| Next steps | Future test ideas |
Building a Testing Knowledge Base
| Category | Examples to Document |
|---|---|
| Winning subject patterns | What types consistently win |
| Audience preferences | Segment-specific learnings |
| Seasonal variations | Time-based patterns |
| Failed experiments | What not to do again |
Testing Cadence Benchmarks
How often to test for optimal improvement.
Recommended Testing Frequency
| Campaign Volume | Testing Frequency | Tests per Quarter |
|---|---|---|
| Under 500/month | Monthly | 3 |
| 500-2000/month | Bi-weekly | 6 |
| 2000-5000/month | Weekly | 12 |
| 5000+/month | Multiple weekly | 20+ |
Higher volume enables more frequent testing and faster optimization.
Testing Roadmap Example
| Quarter | Focus Areas |
|---|---|
| Q1 | Subject lines, opening lines |
| Q2 | CTAs, value propositions |
| Q3 | Sequence structure, timing |
| Q4 | Personalization, advanced elements |
Setting Testing Standards
Based on industry benchmarks, here are recommended testing standards:
| Standard | Guideline |
|---|---|
| Minimum sample per variant | 200+ |
| Confidence threshold for decisions | 85%+ |
| Tests per quarter | 4-6 minimum |
| Documentation requirement | Every test |
| Primary metric definition | Before test starts |
Building a Testing Culture
A/B testing transforms cold email from guesswork into data-driven optimization. Teams that test consistently outperform those that rely on intuition. The benchmarks show that small improvements compound into significant performance advantages over time.
Teams that still stack multiple follow up messages will find sequence length performance data useful for weighing extra replies against list burn and reputation costs.
If you want to establish a testing program or need help optimizing your cold email campaigns through systematic experimentation, our team specializes in data-driven outreach programs for B2B companies.
Get a free campaign audit and see how your current performance compares to tested benchmarks. We will identify specific testing opportunities to improve your results.
Related Reading
Frequently asked questions.
Frequently asked questions- How many emails do I need to send per variant in a cold email A/B test?
- For most cold email tests, send 200-300 emails per variant to reach 90% confidence. If you're testing metrics with lower baseline rates like reply rate (3-5%), increase to 300-500 per variant. For positive reply rate (1.5-3%), use 500-800 per variant. You can use smaller samples (50-100) for directional insights at 70% confidence, but standard decision-making requires 200-300 minimum.
- What email elements should I A/B test first?
- Test subject lines first, as they produce 10-40% typical improvement and have the highest impact potential. Next, test opening lines (10-30% lift), then value propositions (15-35%), and finally CTAs (10-25%). Lower-priority elements like signature format (2-8%) and font styling (1-5%) should be tested only after optimizing high-impact elements. This prioritization maximizes return on testing time investment.
- How much can A/B testing improve my cold email results?
- Systematic testing produces 15-30% better performance over time compared to no testing. Weekly testing yields 35-55% improvement after 12 months, bi-weekly testing produces 25-40% lift, and monthly testing achieves 15-25% improvement. Each winning test typically delivers 5-15% lift, and you need 4-6 tests per quarter for significant improvement. The impact compounds as you continuously test and implement winning variations.
- How long does it take to run a cold email A/B test?
- Test setup takes 1-2 hours, and analyzing results requires 30-60 minutes per test. The sending duration depends on your volume: at 200-300 sends per variant (400-600 total), teams with moderate volume can complete tests within one week. You should test across a full week to account for day-of-week variation, and keep the email body identical when testing subject lines to isolate the variable's impact.
- Does testing subject line personalization really improve open rates?
- Yes, personalized subject lines beat generic ones by 20-40% in A/B tests. Subject lines including the company name win 65% of tests, and specific references win 70% of tests. Keeping subject lines under 50 characters wins 62% of tests. Question formats beat statements by 5-20%, and specific topics outperform vague ones by 10-25%. Test personalization against your baseline to measure the specific impact for your audience.
About the author.

Hosun Chung is COO at RevenueFlow, which builds and operates outbound revenue engines for B2B companies. Previously at Gleacher Shacklock LLP. Studied at London School of Economics.
Hosun Chung · COO
Connect on LinkedIn →Explore more.
Ready to scale your outreach?
We build GTM engines that book real meetings. See the receipts.
Related articles.
Cold Email Spam Rate Benchmarks: 2026 Performance Data
Industry standards require keeping spam complaint rates below 0.1% to maintain sender reputation. Learn the benchmarks and strategies to protect your cold email deliverability.
Cold Email Follow-Up Benchmarks: 2026 Performance Data
The follow-up benchmarks kept intact and read against their own definitions, plus why RevenueFlow sends one message per campaign instead.
Cold Email Bounce Rate Benchmarks: 2026 Performance Data
A 3.04% platform bounce rate held 1.27% true hard bounces, 2.38% with blocks included, and 12.6% delay notices. What low bounce email data is made of.
Cold Email Subject Line Benchmarks: 2026 Performance Data
Industry data reveals that subject lines determine 35-50% of open rate variation. Discover the benchmarks for length, personalization, and format that drive the highest engagement.
Cold Email Personalization Benchmarks: 2026 Performance Data
LeadMagic, Cognism, Explorium and others sell funding and competitor signals. What published data ties to higher reply rates, and how to turn a signal into a line.
Cold Email Sequence Benchmarks: 2026 Performance Data
Every industry sequence figure, kept intact and read honestly: the opening message produces 30-40% of replies, and here is what the rest of them cost.