Cold Email ROI Benchmarks: 2026 Performance Data
The 36x cold email ROI figure comes from email marketing surveys. What the published cold email data shows, and how to compute your own ROI.
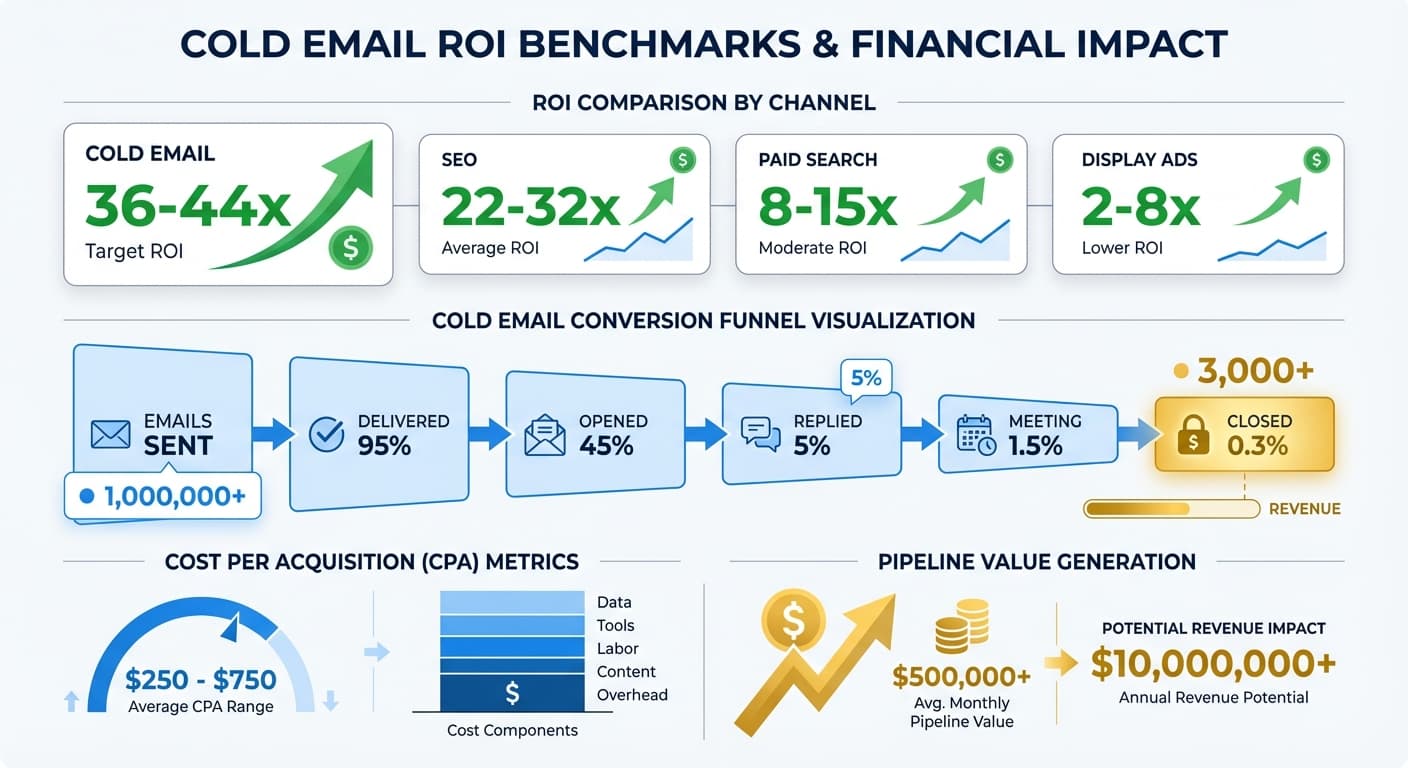
Published cold email ROI data comes from Woodpecker's platform: outbound email costs $1.66 to $28.3 per acquisition, the lowest floor of seven channels, and three real campaigns returned $6, $32 and $119 per $1 at a $2,000 deal. The 36x figure in circulation comes from email marketing surveys, not cold email.
Key takeaways
- Woodpecker's cold email data puts outbound email's cost per acquisition at $1.66 to $28.3, the lowest floor of the seven channels it compares.
- Three real Woodpecker campaigns returned $6, $32 and $119 per $1 spent, assuming a $2,000 average deal.
- The 36x email ROI figure comes from Litmus's survey of email marketing to subscribers, where 35% of marketers report $10 to $36 per $1.
- List hygiene, volume per mailbox and campaign size move Woodpecker's median reply rates, and through them the cost per result.
Reviewed and updated September 21, 2026
Cold email is often credited with a return of 36 to 44 times its cost, but that range comes from surveys of email marketing to subscribers, not from cold outreach. The published cold email ROI data is narrower and more useful. Woodpecker's platform figures put outbound email's cost per acquisition at $1.66 to $28.3, the lowest floor of the seven channels it compares, and its three real campaigns return $6, $32 and $119 for every $1 spent at a $2,000 average deal.
This report sets out where each ROI figure comes from, what it measured, and how to compute your own cold email ROI from numbers you control. An earlier version of this page carried channel, funnel, cost and industry tables with no source behind them. Those tables are gone: every figure below names the dataset that produced it, or is marked as illustrative arithmetic.
Choosing how many touches to build into a campaign comes down to reply timing and list health, which sequence length performance data covers in depth.
About This Data
Three kinds of figure appear below:
- Woodpecker's cold email benchmarks: platform data from cold campaigns sent through Woodpecker over the last 90 days, including a cost per acquisition comparison across seven channels and three real campaigns (an average one, a good one, and one in the top 5% by cost per lead) with their cost per lead, positive reply rate and return per $1.
- Litmus's State of Email survey: responses from nearly 500 marketing professionals about email marketing to subscribers, and the usual source of the "36 times" figure.
- Illustrative arithmetic: worked examples with invented inputs, labelled as such.
None of these separates AI-written campaigns from the rest, so the ROI of using AI for cold email outreach is computed the same way as any other program: the AI tool's cost goes on the cost line, and the result is judged on meetings held and revenue closed.
The same framework computes the ROI of a lead generation service, with one substitution: the cost line becomes the invoice plus the pass-throughs the quote excludes, and the meeting count becomes meetings actually held against the written qualification criteria rather than meetings booked. Both substitutions matter more than any benchmark on this page. To check a vendor's own ROI model, ask which of the two it uses for each, since a projection built on booked meetings and gross fees will differ from one built on held meetings and the total cost by a wide margin.
Cold Email ROI Overview
Where the 36x figure comes from
Litmus's survey found that for every $1 marketing leaders spend on email marketing, 35% receive $10 to $36 in return, 30% receive $36 to $50, 5% receive more than $50, and 21% do not measure ROI at all. That is newsletters and customer email to people who opted in, measured by self-report. Cold email has a different cost base and a far lower response rate, so the survey's range says nothing about it.
Cost per acquisition by channel
Woodpecker compares what an acquisition costs across seven channels, and in its words "outbound email has the lowest cost floor of any channel in this comparison".
The ceiling tells the other half of the story. Outbound email's high end, $28.3, is still below the low end of events and trade shows, telemarketing and LinkedIn ads, and a campaign at that ceiling is the one Woodpecker calls average.
Why Cold Email ROI is High
| Factor | ROI Impact |
|---|---|
| Low marginal cost per send | High efficiency |
| Direct to decision-maker | Short conversion path |
| Scalable with automation | Leverage effect |
| Immediate feedback | Fast optimization |
| Compounding improvements | Long-term gains |
Cost Structure Benchmarks

Understanding costs is essential for ROI calculation. The cost lines are the same for every program even though the prices are not: sending platform seats, data and verification credits, domains and mailboxes, the time spent on research and on answering replies, and a CRM if one is not already paid for. Price each on the vendor's own page, in the currency it serves. One example read for this update: Apollo's Basic plan is $49 per seat per month billed annually.
Conversion Funnel Benchmarks
The one stage with a large public sample is the reply. Woodpecker's median cold email reply rate is 1.5% across 56,614 campaigns, and its good and top-5% campaigns report positive reply rates of 11% and 17%. Below the reply, no public cold email dataset measures the stages, so measure your own:
| Stage | What to count |
|---|---|
| Sent to delivered | Sends minus bounces |
| Delivered to replied | Human replies, not auto-replies |
| Replied to positive | Replies that accept a next step |
| Positive to meeting held | Meetings that happened and met the written criteria |
| Meeting to opportunity | Opportunities opened in the CRM |
| Opportunity to closed | Deals won, with the campaign as source |
Cost Per Acquisition Benchmarks
Woodpecker publishes the cost and return of three real campaigns rather than a range, which makes them the most concrete cold email ROI figures available.
| Campaign | Cost per lead | Positive reply rate | Return per $1 |
|---|---|---|---|
| Average | $28.3 | Not given | $6 |
| Good | $5.92 | 11% | $32 |
| Top 5% | $1.66 | 17% | $119 |
The spread matters more than the average. The top-5% campaign's lead cost about a seventeenth of the average one's, and its return per $1 is about twenty times higher, on the same channel and the same $2,000 deal assumption.
ROI Calculation Framework
Basic ROI Formula
ROI = (Revenue Generated - Total Cost) / Total Cost x 100
Cold Email ROI Components
| Component | How to Calculate |
|---|---|
| Total cost | Fixed + variable costs over period |
| Revenue generated | Closed deals from cold email source |
| Pipeline value | Opportunities x close rate x avg deal |
| Gross ROI | Revenue / Cost |
| Net ROI | (Revenue - Cost) / Cost |
ROI Calculation Example
Illustrative: every input below is invented to show the arithmetic, not taken from a dataset.
| Metric | Value |
|---|---|
| Monthly emails sent | 10,000 |
| Cost per email | $0.15 |
| Total monthly cost | $1,500 |
| Meetings held | 25 (0.25%) |
| Opportunities created | 10 (40% of meetings) |
| Deals closed | 3 (30% close rate) |
| Average deal value | $15,000 |
| Revenue generated | $45,000 |
| ROI | 2900% (29x) |
ROI by Industry Benchmarks
No public cold email dataset breaks ROI down by industry, and the industry tables in circulation carry no source. What changes by industry is deal size and sales cycle, and return per $1 moves in proportion to deal size when everything else holds: Woodpecker's average campaign returns $6 per $1 at a $2,000 deal, which would be $30 at a $10,000 deal on the same costs and conversion. That is arithmetic rather than a measurement, because a larger deal usually comes with a longer cycle and a smaller list.
ROI Improvement Levers
Every lever works through cost per result, and four of them have public medians behind them.
List hygiene
- Bounce under 2%: 1.6% reply
- Bounce over 20%: 1.0% reply
Volume per mailbox
- 1 to 20 emails a day: 2.0% reply
- 101 to 200 a day: 0.5% reply
Campaign size
- 0 to 50 prospects: 2.7% reply
- 1,001 to 5,000: 1.2% reply
Subject line
- 20 to 29 characters: best reply rate
- Same in the US and elsewhere
ROI Optimization Priorities
| Priority | Action | Expected Impact |
|---|---|---|
| 1 | Improve targeting quality | Highest leverage |
| 2 | Optimize messaging | High leverage |
| 3 | Increase meeting conversion | Medium-high leverage |
| 4 | Scale proven campaigns | Medium leverage |
| 5 | Reduce operational costs | Lower leverage |
Time to ROI Benchmarks

The published datasets do not measure time to ROI, so the timeline follows from your own sales cycle. Revenue arrives when the first deals from the campaign close, and a program pays back once closed revenue passes its cumulative cost. New sending domains add a warm-up period before the first send, which belongs on the cost line even though it produces no replies.
Measuring and Tracking ROI
Key ROI Metrics
| Metric | Formula |
|---|---|
| Cost per email | Total cost / Emails sent |
| Cost per reply | Total cost / Replies |
| Cost per meeting | Total cost / Meetings held |
| Cost per opportunity | Total cost / Opportunities |
| Cost per customer | Total cost / Customers |
| Revenue per email | Revenue / Emails sent |
| ROI | (Revenue - Cost) / Cost |
Attribution Considerations
| Attribution Model | When to Use |
|---|---|
| First touch | Cold email starts relationship |
| Last touch | Email influenced close |
| Multi-touch | Complex buying journey |
| Time decay | Long sales cycles |
Tracking Best Practices
| Practice | Implementation |
|---|---|
| Tag all cold email leads | CRM lead source field |
| Track through pipeline | Maintain source attribution |
| Calculate regularly | Monthly ROI reviews |
| Segment analysis | ROI by campaign, segment |
Long-Term ROI Considerations
| Factor | Long-Term Impact |
|---|---|
| List building | Asset accumulates |
| Domain reputation | Improves deliverability |
| Message optimization | Performance compounds |
| Process efficiency | Cost decreases |
| Customer referrals | Additional revenue |
Setting ROI Expectations
The published cold email ROI figures are Woodpecker's three campaigns: $6, $32 and $119 returned per $1 at a $2,000 average deal. Set expectations from your own deal size and your own cost per lead rather than from a headline multiple, and treat these as warning signs:
| Warning Sign | Potential Issue |
|---|---|
| Cost per lead rising month on month | List or deliverability decay |
| Declining ROI trend | Market saturation or execution issues |
| High CAC to LTV ratio | Targeting wrong customers |
| Long break-even | Efficiency problems |
Maximizing Cold Email ROI
Cold email can return far more than it costs, and the published data shows how wide the range is between an average campaign and a top one on the same channel. The difference sits in targeting, list hygiene and volume per mailbox, which is where the effort pays.
If you want to improve your cold email ROI or need help establishing a high-performing outreach program, our team specializes in building profitable cold email campaigns for B2B companies.
Get a free campaign audit and see how your current ROI compares to the published benchmarks. We will identify specific opportunities to improve your returns through better targeting, messaging, and conversion optimization.
Related Reading
Frequently asked questions.
Frequently asked questions- What is the average ROI of cold email?
- There is no reliable market-wide average. The most concrete published figures are Woodpecker's three real campaigns, which returned $6, $32 and $119 for every $1 spent at a $2,000 average deal, at costs per lead of $28.3, $5.92 and $1.66. Compute your own from your cost, meetings held and closed revenue.
- Where does the 36x email marketing ROI figure come from?
- From surveys of email marketing to subscribers. Litmus's State of Email survey of nearly 500 marketing professionals found 35% report $10 to $36 back per $1 and 30% report $36 to $50, while 21% do not measure ROI. It measures newsletters and customer email, not cold outreach.
- How do you calculate cold email ROI?
- Subtract total cost from the revenue closed from cold email leads and divide by total cost. Count every cost line, including data, verification, domains, mailboxes and people's time, and count revenue only from deals the CRM attributes to the campaign. Meetings should be meetings held against written criteria, not meetings booked.
- What is the average ROI of using AI for cold email outreach?
- No published dataset used here separates AI-written campaigns from the rest, so there is no sourced average. Compute it like any program: put the AI tool's cost on the cost line and judge the result on meetings held and revenue closed. Woodpecker's campaigns show how far cost per lead varies on one channel, from $1.66 to $28.3.
About the author.

Hosun Chung is COO at RevenueFlow, which builds and operates outbound revenue engines for B2B companies. Previously at Gleacher Shacklock LLP. Studied at London School of Economics.
Hosun Chung · COO
Connect on LinkedIn →Explore more.
Ready to scale your outreach?
We build GTM engines that book real meetings. See the receipts.
Related articles.
Cold Email Spam Rate Benchmarks: 2026 Performance Data
Industry standards require keeping spam complaint rates below 0.1% to maintain sender reputation. Learn the benchmarks and strategies to protect your cold email deliverability.
Cold Email Follow-Up Benchmarks: 2026 Performance Data
The follow-up benchmarks kept intact and read against their own definitions, plus why RevenueFlow sends one message per campaign instead.
Cold Email Bounce Rate Benchmarks: 2026 Performance Data
A 3.04% platform bounce rate held 1.27% true hard bounces, 2.38% with blocks included, and 12.6% delay notices. What low bounce email data is made of.
Cold Email Subject Line Benchmarks: 2026 Performance Data
Industry data reveals that subject lines determine 35-50% of open rate variation. Discover the benchmarks for length, personalization, and format that drive the highest engagement.
Cold Email Personalization Benchmarks: 2026 Performance Data
LeadMagic, Cognism, Explorium and others sell funding and competitor signals. What published data ties to higher reply rates, and how to turn a signal into a line.
Cold Email Sequence Benchmarks: 2026 Performance Data
Every industry sequence figure, kept intact and read honestly: the opening message produces 30-40% of replies, and here is what the rest of them cost.