E-commerce Cold Email Reply Rate Benchmarks (2026)
Published cold email benchmarks put average reply rates near 3.4%. Here is how to read your e-commerce campaign against real data, with sources.
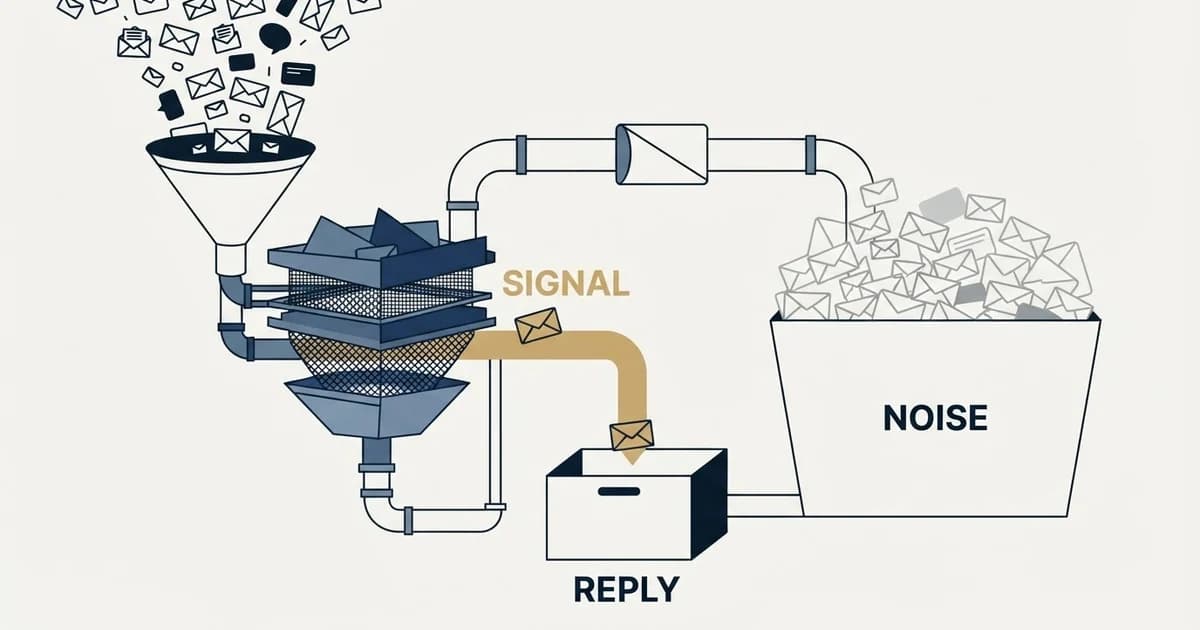
No vendor publishes an e-commerce-only reply rate benchmark. Anchor to platform-wide data instead: Woodpecker reports a 3.43% average cold email reply rate, with 5-10% considered good and 10%+ excellent. For outreach to e-commerce brands, treat 2-4% as functional, 4-8% as well-built, and under 2% as structurally broken.
Key takeaways
- Woodpecker's analysis of 20M+ emails puts the average cold email reply rate at 3.43%, with 5-10% good and 10%+ excellent.
- Backlinko's study of 12 million outreach emails found an 8.5% overall response rate, meaning 91.5% were ignored.
- Reply rate falls as list size grows: 5.8% under 50 contacts, roughly 3% at 200-500, and 2.1% at 500-1,000 or more.
- Advanced personalization replies at roughly 17-18% versus 7-9% for basic or no personalization in Woodpecker's data.
- Published benchmark data reports 8.3% replies for campaigns with 3-5 follow-up steps versus 4.1% with none, and 42% of replies arriving after the first email.
- No published dataset gives a reliable e-commerce-specific reply rate, so any precise DTC-only benchmark figure is invented.
Reviewed and updated September 1, 2026
E-commerce Cold Email Reply Rate Benchmarks (2026): What Good Looks Like
A 2,000-contact sequence into Shopify Plus and BigCommerce brands finishes its last follow-up and the dashboard shows 41 replies. Nothing in that dashboard tells you whether 41 is a win, a disaster, or exactly what should have happened given the list you built and the send volume you chose. Most teams selling into e-commerce spend months in that state, rewriting subject lines against a number they have no frame of reference for.
This report pulls together the cold email benchmark data that has actually been published, explains what it does and does not cover for e-commerce specifically, and gives you a way to grade your own results without guessing.
Start With What the Published Data Actually Covers
Here is the honest constraint that most "industry benchmark" posts skip over. The vendors sitting on large cold email datasets (Woodpecker, Backlinko's outreach study, and similar) publish cuts by campaign size, personalization depth, follow-up count, and sequence length. They do not publish a reliable vertical cut for "companies selling software or services to e-commerce brands." Any article handing you a precise DTC-only reply rate to three decimal places invented it.
What you can do is anchor to the platform-wide distribution, then adjust for the structural realities of the e-commerce buyer. That adjustment is judgment, and it should be labeled as judgment rather than dressed up as data.
The Baseline Numbers
Woodpecker's analysis of more than 20 million emails sent through its platform produces the cleanest published distribution for reply rate, bounce rate, and open rate.
| Metric | Platform average | Good | Excellent |
|---|---|---|---|
| Reply rate | 3.43% | 5-10% | 10%+ |
| Bounce rate | 5.1% | Below 2% | Below 1.5% |
| Open rate | 27.7-44% | 40-60% | 65%+ |
Source: Woodpecker cold email statistics
That 3.43% platform average is worth sitting with, because it is far lower than the number most founders assume is normal. It includes every unsegmented blast and every unwarmed domain on the platform.
Backlinko's study of 12 million outreach emails found an overall response rate of 8.5%, meaning 91.5% of outreach emails were ignored. Source: Backlinko email outreach study. The gap between 3.43% and 8.5% is not a contradiction. The two datasets measure different populations and different definitions of a response. Treat the spread as the real answer: a competent, well-targeted campaign lands somewhere in the mid single digits, and anything sustained above 10% means you have found unusual fit with a narrow list.
What "Reply Rate" Means in Your Dashboard

Before comparing yourself to anything, confirm what your tool is counting. Three definitional traps account for most of the confusion when a founder tells you their reply rate is 14%.
Denominator: sends or contacts. A four-step sequence to 500 people generates roughly 1,500 sends after opt-outs and bounces. Thirty replies is 6% of contacts and 2% of sends. Both are defensible metrics. They are not comparable to each other, and benchmark tables are almost always contact-based.
Automated replies. Out-of-office messages, "I have left the company" notices, and ticketing system acknowledgements all register as replies in most sending platforms. In e-commerce this skews high, because so many target addresses are shared or role-based. Strip them out before you grade yourself.
Positive versus total. Total reply rate includes "not interested," "remove me," and hostile responses. Positive reply rate is the number that predicts pipeline. A campaign at 9% total replies with an 18% positive share is a worse business than one at 5% total replies with a 60% positive share. Track both, and never compare your total reply rate against someone else's positive reply rate.
What Drags Reply Rates Down When You Sell Into E-commerce
Several dynamics are specific enough to this vertical that they belong in your expectations before you send a single email.
Agency and app saturation. Founders and heads of growth at DTC brands receive a constant stream of outreach from Klaviyo consultants, Meta ads agencies, 3PLs, review platforms, and app developers. The category has been prospected hard for a decade. Your opening line competes against a well-worn pattern that recipients recognize within two seconds.
Role-based and shared inboxes. E-commerce companies publish support@, hello@, and info@ addresses everywhere, and scraping tools happily collect them. Those addresses are monitored by customer service staff with no purchasing authority, and they often sit behind spam filters tuned aggressively because they receive heavy inbound volume. A list loaded with role-based addresses will show acceptable delivery and near-zero meaningful replies.
Company size distribution. The e-commerce long tail is enormous and mostly tiny. A filter like "uses Shopify" returns hundreds of thousands of stores where the founder is packing boxes and has no budget for anything. The replies you want come from a much narrower band, typically brands past roughly $2M to $5M in revenue with a dedicated marketing or operations hire.
Seasonality that genuinely stops responses. From mid-October through the first week of January, e-commerce operators are executing the quarter that pays for their year. Reply rates fall sharply, and the replies you do get skew heavily toward "circle back in January." Late January through March, and again June through August, are materially better windows for evaluation conversations.
Deliverability pressure. Google and Yahoo's bulk sender requirements set a spam complaint threshold you have to stay under, with Google's guidance being to keep complaint rates below 0.10% and never let them reach 0.30%. Source: Google Email sender guidelines. Lists built by scraping storefronts tend to carry higher complaint risk than lists built from verified professional data, which pushes more of your volume into spam folders and quietly drags your reply rate down.
The Levers That Actually Move the Number
The published data is unusually clear about which changes produce large effects. Four dominate.
List size and tightness. Woodpecker's data shows reply rate falling steadily as campaign size grows: 5.8% for campaigns under 50 contacts, 4-5% at 50-200 contacts, roughly 3% at 200-500, and 2.1% at 500-1,000 or more. Source: Woodpecker cold email statistics. This is the most reliable finding in cold email. Smaller lists produce better numbers because tight targeting and real research are only possible at small scale.
Personalization depth. In the same dataset, campaigns using advanced personalization reply at roughly 17-18%, against roughly 7-9% for basic or no personalization. Woodpecker's separate analysis of more than 26,000 campaigns found personalized campaigns achieving nearly double the reply rate of non-personalized ones. Source: Woodpecker cold email benchmarks. Backlinko measured a 32.7% lift in response rate from personalized message bodies and a 30.5% lift from personalized subject lines. Source: Backlinko email outreach study.
Follow-ups. Sequences with 3-5 follow-up steps reply at 8.3%, against 4.1% for sequences with none, and 42% of all replies arrive after the first email. Source: Woodpecker cold email statistics. Backlinko found that a single follow-up boosted replies by 65.8%. Woodpecker's campaign-level analysis points to 2-3 follow-ups as the sweet spot for both opens and replies. If your campaign is one email long, compare it against the single-send figures rather than full-sequence totals.
Multiple contacts per account. Backlinko found that reaching several contacts at a target company increased response rate by 93% over single-contact outreach. Source: Backlinko email outreach study. This matters more in e-commerce than in most verticals, because titles are fluid and the person who owns your problem is frequently not the one a database lists first.
Length is the cheapest fix available. Woodpecker's guidance is to keep cold emails under 80 words. Most underperforming e-commerce outreach runs three times that.
Grading Your Own Campaign
Run your numbers through this sequence. Each row points at a different broken layer, and they have to be fixed in order. Rewriting copy while your bounce rate sits at 7% wastes weeks.
| What you see | What it means | Fix first |
|---|---|---|
| Bounce rate above 3% | List quality or verification failure | Re-verify the list, drop catch-all domains |
| Bounce under 2%, open rate under 25% | Deliverability, not copy | Domain warmup, daily volume, spam complaints, subject lines |
| Open rate above 40%, reply rate under 2% | Copy or offer is not landing | Rewrite the first two lines, cut to under 80 words, sharpen the ask |
| Reply rate above 5%, positive share under 20% | Targeting is off | Tighten firmographics, revenue band, and title filters |
| Positive replies healthy, no meetings booked | The ask or the handoff | Lower the commitment in the CTA, remove booking friction |
Two further rules for reading your own data. Give a campaign at least 300 to 500 contacts before drawing any conclusion, because at 3-5% reply rates a 100-contact test produces three to five replies and tells you close to nothing. And compare campaigns only against campaigns with the same structure, since a six-step sequence to 150 hand-researched accounts and a two-step sequence to 3,000 scraped stores are entirely different experiments wearing the same metric name.
Where we differ from standard practice

Much of the advice on this page reflects how outbound is commonly run. We run it differently, and since this page sits on our site it is worth saying where the difference is and what it costs us.
- A sequence of messages to each prospect over several weeks
- Later messages often land in the same email thread
- Every contact is reached more than once, so a distracted reader gets another chance
- The later messages go only to people who did not answer the first
- Reputation cost accrues on the sending domain across everything else it sends
- One message, then that campaign is finished for that contact
- No thread replies and no bumps
- A non-responding audience becomes a new campaign with a genuinely different premise, not a reminder
- More of the work moves into targeting and into the one message
- We reach each contact less often, and that is the cost we accept
The reasoning is mechanical rather than moral. A follow-up arrives underneath a message the recipient has already seen and chosen not to answer, so it is delivered to the population most likely to mark it as spam, and the reputation cost of that lands on the sending domain across every campaign running on it. We set that cost against the replies a sequence recovers and decided the trade was not worth it. The full argument, with the numbers from our own campaigns, is in why we stopped using follow-ups.
A Realistic Target to Set
For outreach into e-commerce brands, measured as contact-based reply rate with automated replies stripped out, a reasonable ladder looks like this.
Below 2% means something structural is broken, usually the list or deliverability. Two to 4% is a functioning campaign with generic targeting. Four to 8% is a well-built campaign on a tight list with genuine personalization and a full follow-up sequence. Above 8% sustained means you have found a narrow segment, a sharp offer, and research the recipient can feel, and your next move is to find more accounts that look exactly like the ones replying rather than to scale volume against a broader list.
The number that actually pays the bills sits underneath all of these: positive replies per thousand contacts, and meetings booked from them. A team obsessing over open rate while booking two meetings a month has optimized the wrong layer entirely.
If you would rather have this built and run for you, with list construction, sending infrastructure, and copy handled end to end, book a strategy call with RevenueFlow and we will map out what your reply rate should realistically look like for the segment you are targeting.
Related Reading
- Legal Services Cold Email Reply Rate Benchmarks (2026): What Good Looks Like
- Real Estate Cold Email Reply Rate Benchmarks (2026): What Good Looks Like
If you would rather have this run for you, RevenueFlow books qualified meetings on a pay-per-meeting basis and publishes client results.
Benchmark figures cited above come from publicly published studies and were verified as of July 2026. Vendor datasets differ in methodology and in how they define a reply, so treat these ranges as directional rather than exact.
Frequently asked questions.
Frequently asked questions- What is a good reply rate for cold email to e-commerce brands?
- Measured on contacts rather than sends, and with out-of-office replies stripped out, 4-8% is a well-built campaign on a tight list with real personalization. Two to 4% is functional but generically targeted. Below 2% usually points to a list or deliverability problem rather than weak copy.
- Is there an official e-commerce cold email benchmark?
- No. The vendors with large cold email datasets publish cuts by campaign size, personalization depth, and follow-up count, not by the vertical a campaign targets. Woodpecker reports a 3.43% platform-wide average reply rate. Any article quoting a precise e-commerce-only figure is extrapolating or inventing it.
- Why is my open rate high but my reply rate near zero?
- That combination usually means delivery is fine and the message is the problem. Common causes are emails over 80 words, an opening line that talks about your company rather than the recipient's situation, an ask that requires too much commitment, or a list of role-based addresses like info@ that are read by staff with no purchasing authority.
- How many contacts do I need before my reply rate means anything?
- At least 300 to 500 contacts. At typical reply rates of 3-5%, a 100-contact test produces three to five replies, which is well inside random variation. Comparing two campaigns at that size will lead you to change things that were never the problem.
- When is the worst time to cold email e-commerce companies?
- Mid-October through the first week of January. Operators are executing peak season, and replies during that window skew heavily toward deferrals. Late January through March and June through August are stronger periods for conversations that require evaluating a new vendor or tool.
About the author.

Hosun Chung is COO at RevenueFlow, which builds and operates outbound revenue engines for B2B companies. Previously at Gleacher Shacklock LLP. Studied at London School of Economics.
Hosun Chung · COO
Connect on LinkedIn →Explore more.
Ready to scale your outreach?
We build GTM engines that book real meetings. See the receipts.
Related articles.
Real Estate Cold Email Reply Rate Benchmarks (2026)
No vendor publishes a real estate cold email benchmark. Here are the published reply-rate tiers that do apply, and how to read your own results.
Legal Services Cold Email Reply Rate Benchmarks (2026)
Cross-industry cold email reply rates average 3.43%. Here is what good looks like when your list is law firms, plus the levers with real data behind them.
Cold Email Conversion Benchmarks: 2026 Performance Data
Complete benchmark data for cold email conversion rates from reply to meeting to opportunity. Learn what drives conversions and how to optimize your full funnel.
Education Cold Email Benchmarks: 2026 Performance Data
Industry benchmark data for education cold email campaigns, including open rates, reply rates, and conversion metrics for companies targeting K-12 schools, higher education, and corporate training organizations.
Automotive Cold Email Benchmarks: 2026 Performance Data
Industry benchmark data for automotive sector cold email campaigns, covering OEMs, suppliers, dealerships, and automotive technology with performance metrics by segment and buyer role.
Real Estate Cold Email Benchmarks: 2026 Performance Data
Comprehensive benchmark data for real estate cold email campaigns, including open rates, reply rates, and conversion metrics for companies targeting brokerages, property managers, developers, and real estate investors.