Spam Complaint Rate: Definition, How It Is Measured, and Where It Breaks
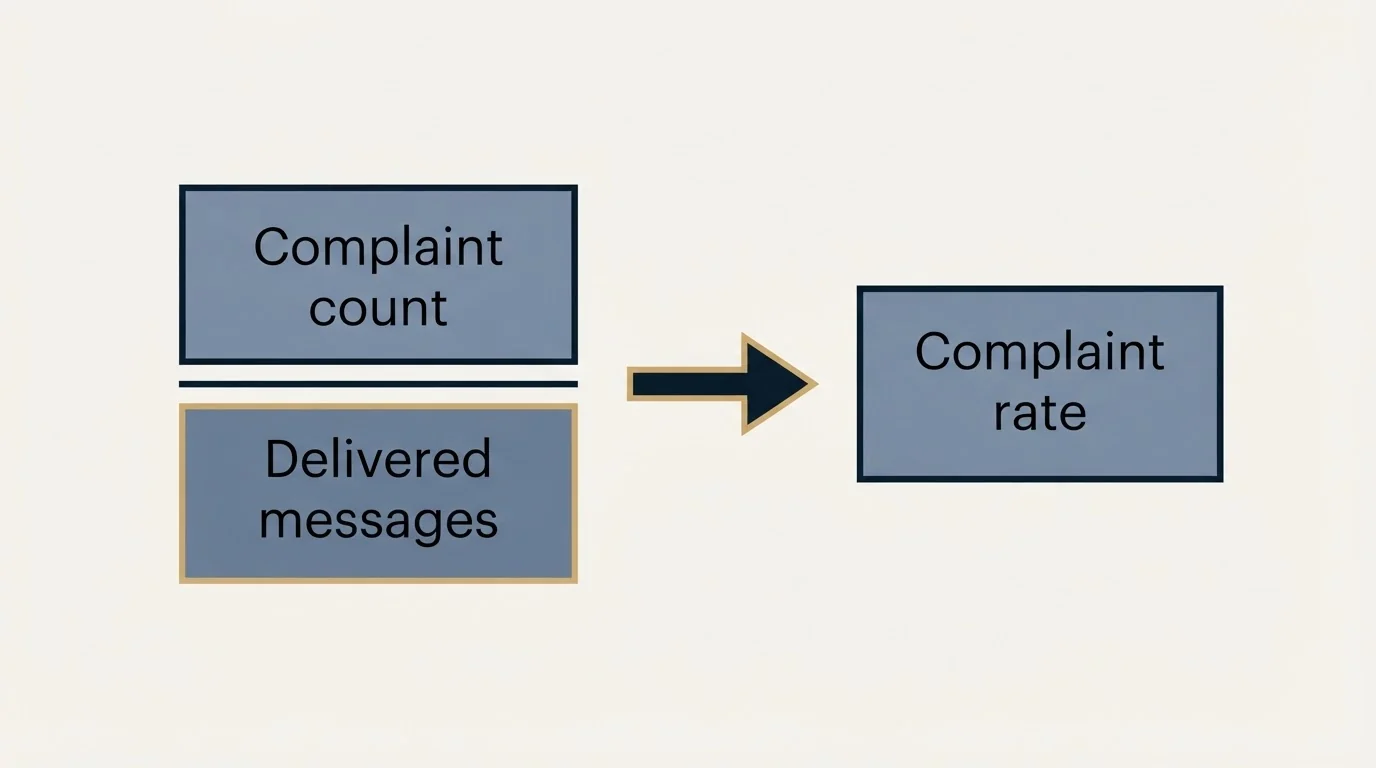
Spam complaint rate is the share of delivered messages recipients actively marked as spam, reported by the receiving provider. Google's sender guidelines say to keep the rate reported in Postmaster Tools below 0.10% and never reach 0.30%. At a single sending domain's daily volume, one complaint can clear that ceiling alone.
Key takeaways
- Google's sender guidelines publish two thresholds for the spam rate reported in Postmaster Tools: stay below 0.10%, and never reach 0.30% or higher.
- The rate is dominated by small integers at cold-outbound volumes, so a single complaint against a few hundred delivered messages can clear the ceiling on its own.
- The metric only stabilises when complaints and delivered volume are aggregated across a whole sending inventory over time, never on one domain on one day.
- It is a Gmail-shaped view. Microsoft 365 and most business mail platforms expose no comparable per-sender rate, so a clean reading is silence about everywhere else.
Spam Complaint Rate: Definition, How It Is Measured, and Where It Breaks
Spam complaint rate is the share of delivered messages that recipients actively marked as spam, as reported by the receiving provider's own feedback surface. It is a rate rather than a count, its denominator is messages the provider accepted rather than messages you attempted, and the only authoritative source for it is the provider that received the mail.
It is the most decisive number in deliverability and the most badly behaved one, for a reason that is arithmetic rather than technical.
How the number is produced
The plumbing first, because it explains both of the breaks that follow.
A complaint is generated when a recipient presses the button their mail client offers for reporting unwanted mail. Deleting a message is not a complaint. Ignoring it is not a complaint. Unsubscribing is not a complaint. The metric counts one specific deliberate action, which is why it is a small number and why it carries so much weight: it is the one signal where a human explicitly told the provider they did not want your mail.
Receiving providers make that signal available to senders through two shapes of surface. A feedback loop forwards individual complaints back to the sender, usually as a report about the message with recipient identifiers removed, which lets a sending system suppress that address automatically. Aggregate reporting surfaces publish the rate over a period without identifying individuals. Google Postmaster Tools is the aggregate kind, and how to read every metric it exposes is covered in Google Postmaster Tools for cold email.
The denominator deserves its own sentence because it is where reporting quietly disagrees. The rate is complaints divided by messages the provider delivered, not messages you sent. Those differ by everything that bounced, was deferred into oblivion, or was refused. A sending platform that computes its own complaint rate against attempted sends will report a lower figure than the provider does, and the provider's figure is the one that governs. Bounce volume is therefore doubly expensive: it damages you directly and it shrinks the denominator of the metric you are being judged on. The rates to expect there are in cold email bounce rate benchmarks.
Where it breaks

The threshold is a rate, and at a single domain's volume the rate is tiny integers
Google's sender guidelines publish the operative numbers: "Keep spam rates reported in Postmaster Tools below 0.10% and avoid ever reaching a spam rate of 0.30% or higher."
Google's stated target for the spam rate reported in Postmaster Tools
Google's stated ceiling, described as a rate to avoid ever reaching
Those are sensible thresholds for a sender pushing large volume. Now do the division for a cold programme, where volume per sending domain is deliberately small.
Work it through illustratively, then run it on your own send sizes rather than these. Take a sending domain with roughly 300 delivered messages in a day. One recipient presses the spam button. That is one divided by 300, which is 0.33 percent, and the domain has cleared the ceiling on the strength of a single click. Now take the same domain with roughly 1,000 delivered messages behind it. The same single click is 0.10 percent, which sits on the target rather than above the ceiling. Same behaviour, same sender, same message, and two readings that a monitoring system would treat as entirely different situations.
Push the illustration one step further and it gets sharper. On a domain with roughly 200 delivered messages in a day, the smallest non-zero rate available to it is one divided by 200, or 0.5 percent. There is no reading between zero and a figure well above the published ceiling, because the arithmetic has no room for one. A domain of that size cannot report a rate of 0.10 percent on any single day. It can report zero, or it can report a number that looks like a crisis, and nothing else exists on the dial.
That is the whole problem in one line. At the volumes a single sending domain actually handles, the rate is a small integer divided by a number that changes daily, so it swings between zero and alarming with no change in anything a sender did. Zero complaints and a rate above the ceiling are separated by one person having a bad morning.
Three things follow from this, and they are the practical content of the entry.
Read the count alongside the rate, always. A rate with a small denominator is not a measurement of sender behaviour. Knowing that the number of complaints was one, and knowing what the denominator was, tells you more than the percentage does. A monitoring rule that fires on a rate alone will fire constantly on healthy domains.
The rate only stabilises across inventory and across time. Aggregate the complaints and the delivered volume across every sending domain over a period long enough to accumulate a real denominator, and the resulting figure describes your programme. Any single domain on any single day describes noise. This is the sense in which the metric is real, and it is not the sense in which most tools present it.
Do the arithmetic before you set an alert. Take your own per-domain daily delivered volume, divide one by it, and see where a single complaint lands you against 0.10 percent and 0.30 percent. If one click clears the ceiling, you now know that your ceiling alert is an alert about one person, and you can decide what you want it to do.
- Step 1Get the count and the denominator, not the percentage
A rate hides whether it was produced by one complaint or fifty. The two situations need different responses.
- Step 2Aggregate across your sending inventory
Sum complaints and delivered volume across domains before dividing. A per-domain daily rate has too small a denominator to mean anything.
- Step 3Read the trend over a period, not the day
A figure that moves from zero to above the ceiling and back with no change in sending is measuring its own denominator.
- Step 4Investigate on a sustained shift, not a spike
A single day above the ceiling on a small denominator is expected. Several days of elevated readings across several domains is a real signal.
None of this makes the thresholds wrong. It makes a single-domain daily reading the wrong instrument to judge yourself against them with, and that is a different claim.
It is a Gmail-shaped view of a multi-provider reality
The second break is about coverage. Read the Google quote again and notice the qualifier: the spam rate reported in Postmaster Tools. That is a Google metric, computed by Google on Gmail recipients, exposed by Google to senders who verify their domain.
Elsewhere the picture goes dark. Microsoft 365, which hosts an enormous share of the business mailboxes a B2B cold list is aimed at, exposes no comparable public per-sender complaint rate to most senders. Neither do the many corporate mail systems and security gateways that sit in front of business inboxes. A complaint registered by a recipient at one of those organisations may be visible to their own administrators, and it is not visible to you.
So a clean complaint rate is evidence about Gmail and silence about everywhere else. That is a genuinely useful thing to have, because Gmail is a large share of most lists and its judgment is influential. It is not the sentence senders usually take from it, which is that the programme is not generating complaints.
- Gmail recipients on domains you have verified are not pressing the spam button often
- Your Gmail-side reading is inside the range Google publishes
- The trend of that reading over time is available to you
- A large and influential slice of most B2B lists is behaving
- Complaints at Microsoft 365 and other business platforms
- Anything filtered by a security gateway ahead of the mailbox
- Recipients who delete or ignore rather than complain
- Domains you never verified in Postmaster Tools
- Whether your mail reached the inbox at all
There is a quieter version of the same gap inside Google's own surface. Postmaster Tools reports on domains you have verified, so a programme running mail across a spread of sending domains sees a complaint rate only for the ones somebody remembered to add. An unverified domain does not report a clean rate. It reports nothing, and an absent reading sitting in a dashboard next to several healthy ones reads as reassurance rather than as a hole. Enumerate the sending domains you actually use and confirm each one is verified before treating the board as coverage.
The habit worth building is to say which provider a number belongs to whenever you quote it. "Our complaint rate is fine" and "our Gmail complaint rate is fine" are different statements, and only the second is one you can support.
What moves it

One asymmetry is worth stating before the tactics, because it changes how much attention the number deserves despite everything above. A complaint is expensive out of all proportion to its frequency. The thresholds are set in tenths of a percent, which means the provider is telling you that fewer than one in a thousand recipients objecting is already the limit of what it will tolerate. Nothing else in outbound is judged on a scale that fine. So the correct posture is to treat the daily reading as noise and the underlying behaviour as extremely serious, which is an uncomfortable pair of instructions and is nonetheless what the arithmetic supports.
Complaints are a targeting and relevance outcome before they are a deliverability one. A recipient who was a plausible fit for the message and got a clear reason for the approach rarely reports it, whatever they think of cold email in general. A recipient who was obviously not the right person, or who cannot tell why this arrived, has a cheap button in front of them.
Volume shape matters for the same reason. We send one message per campaign, sent once, and a later approach to the same person is a separate campaign built on a different premise. The mechanical point here is about the denominator and the numerator together: each prospect contributes to the delivered count once and gets one opportunity to press the button, rather than contributing repeatedly with the probability of a complaint rising each time. Repeat arrivals into an inbox that has not answered are among the most reliable ways to convert indifference into a complaint.
Where a rate has already gone bad, the ordered diagnostic path for the whole stack is in the cold email deliverability guide, the benchmark context for what other cold programmes report is in cold email spam rate benchmarks, keeping your volume inside your own provider's ceilings is covered in email sending limits by provider, and the tooling for reading the raw deliverability record is in reading MXToolbox like a deliverability engineer.
Watching that arithmetic across a whole inventory is what makes the number readable at all, and our pay-per-qualified-meeting outbound is the arrangement where we do the watching.
Verified as of mid-2026. Verify current terms with the vendor before relying on them.
Frequently asked questions.
Frequently asked questions- What is a good spam complaint rate for cold email?
- Google's sender guidelines say to keep the rate reported in Postmaster Tools below 0.10% and to avoid ever reaching 0.30% or higher. Judge yourself against those figures using complaints and delivered volume aggregated across your sending domains over a period, because a single domain's daily rate is mostly measuring its own denominator.
- How is spam complaint rate calculated?
- Complaints divided by messages the receiving provider delivered, not messages you attempted to send. Those differ by everything that bounced or was refused, so a platform computing the rate against attempted sends reports a lower figure than the provider does. The provider's denominator is the one that governs.
- Why did my spam rate jump to 0.30% overnight?
- Almost certainly the denominator. Run the division on your own numbers: with a few hundred delivered messages from one sending domain in a day, one recipient pressing the button produces a rate above the ceiling by itself. Read the complaint count alongside the rate before treating a spike as a change in sender behaviour.
- Does a clean spam complaint rate mean my email is fine?
- It means Gmail recipients on domains you verified in Postmaster Tools are not complaining often. Microsoft 365 and most corporate mail platforms expose no equivalent per-sender rate, and security gateways report nothing to you. It is also silent on placement: a message filed into spam generates no complaint at all.