ABM Benchmarks: Who Was Counted, and When
Five sources publish ABM benchmarks. Only Demandbase's 2026 report states its population on the page; this page dates every figure and says who was counted.
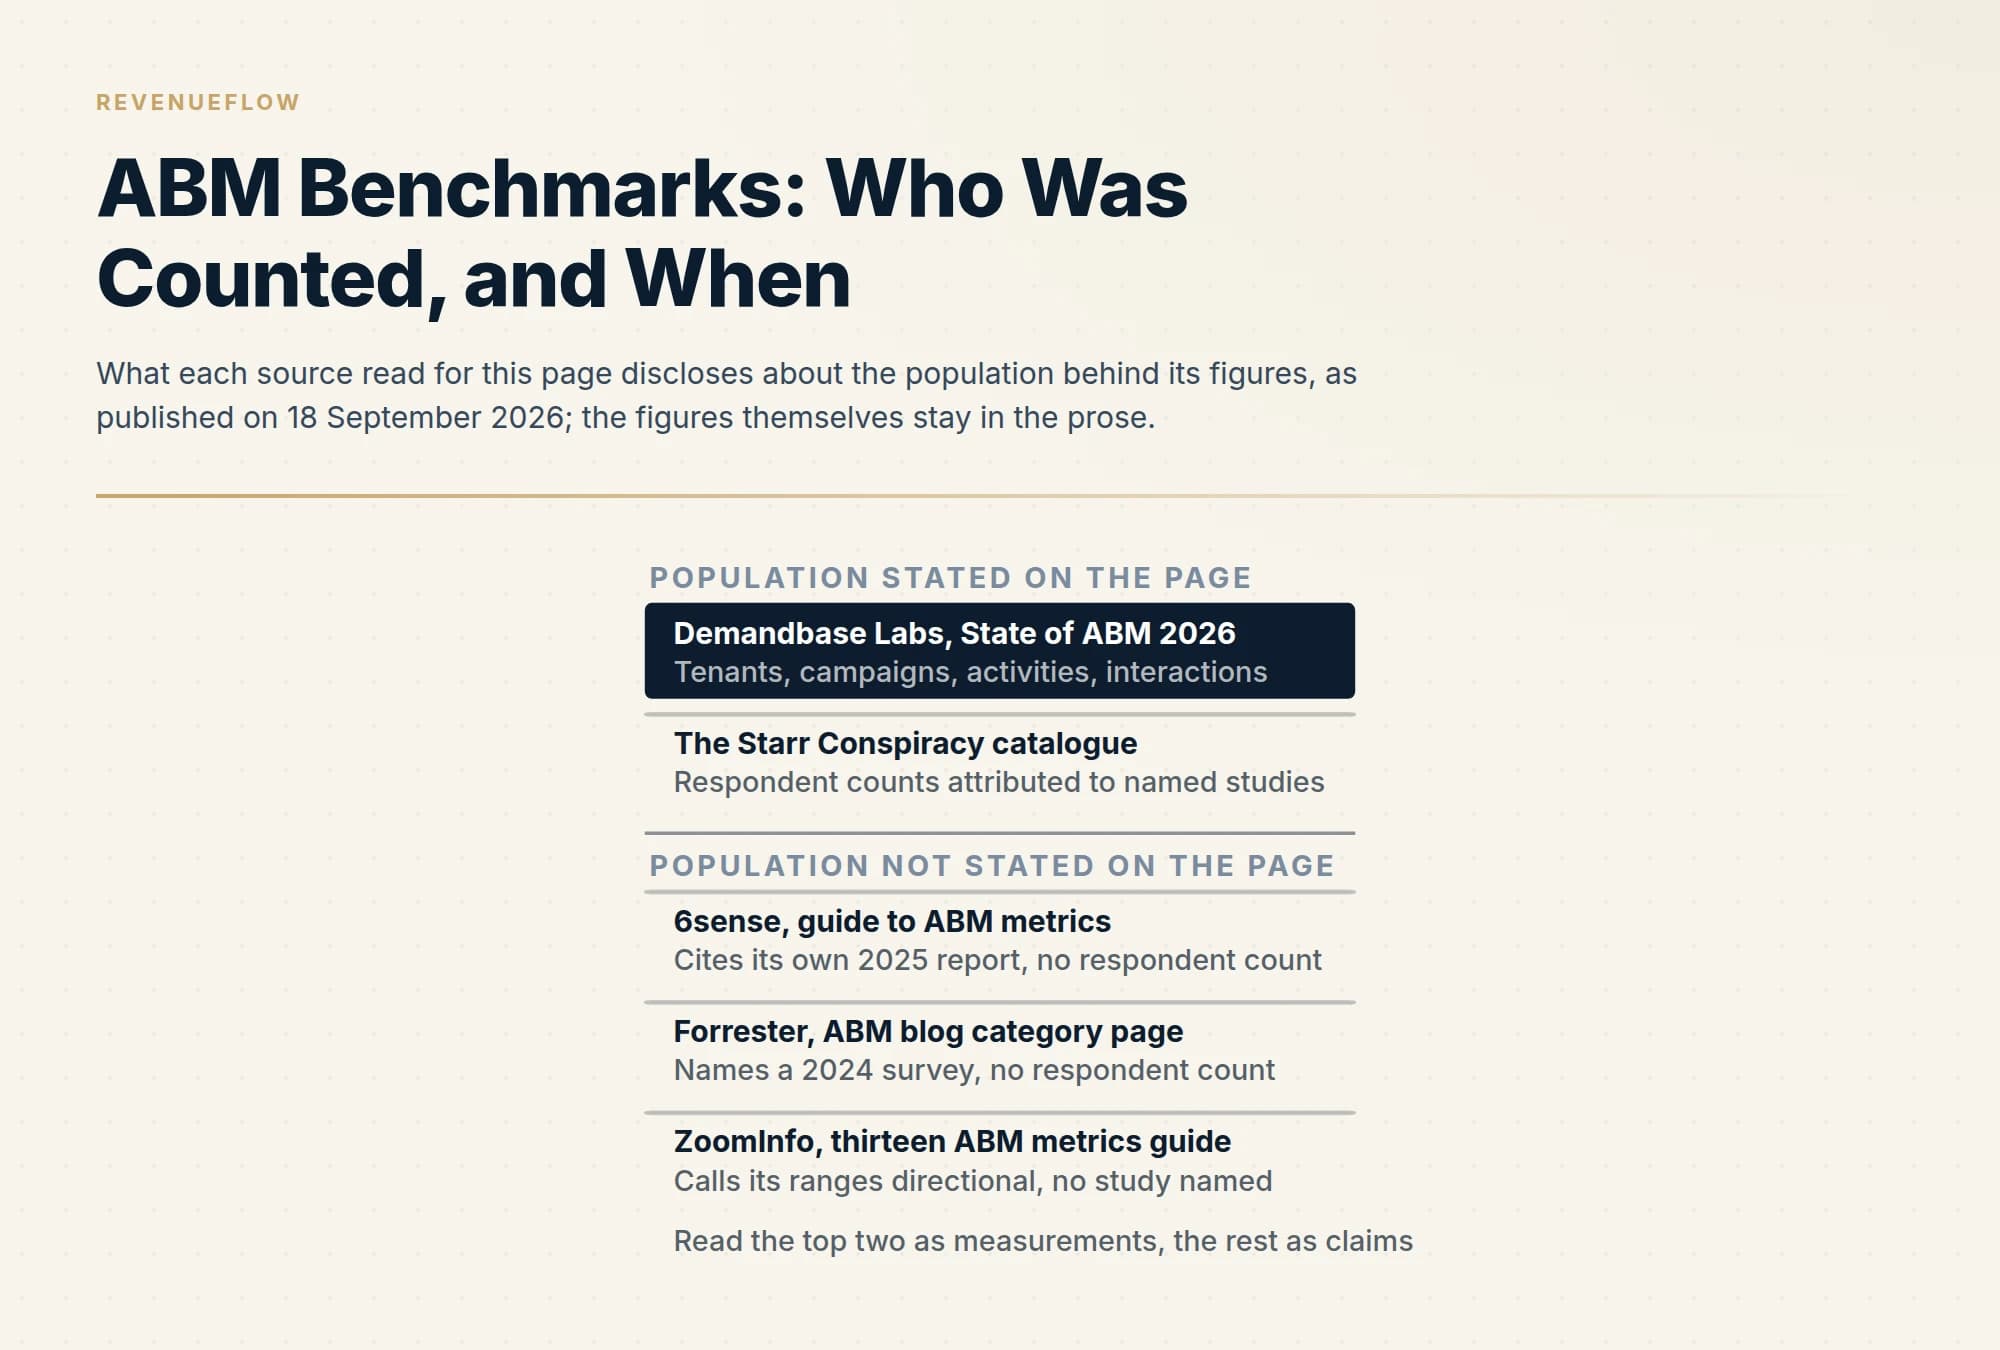
Five sources read on 18 September 2026 publish account-based marketing benchmarks. Demandbase's 2026 report states its population, 1,452 tenants, and gives maturity, buying-group and touch-count figures from telemetry. 6sense, Forrester and ZoomInfo publish figures with no count on the page. The Starr Conspiracy catalogues five publishers with counts for two. Adopt a figure once you know who was counted.
Key takeaways
- Demandbase's State of ABM 2026 report is telemetry across 1,452 tenants: a 22.33 percent median MQA conversion for mature frameworks against 14.19 percent, a 48.5 percent higher win rate for teams tracking three to four buying groups, and a 94 percent conversion for groups receiving 180 to 190 touches.
- 6sense's guide cites its 2025 report for nearly 80 percent adoption, 29 percent of ABM teams measured solely on ABM metrics and 13 percent reporting closed-won revenue upward, with no respondent count on the page.
- Forrester's blog names its 2024 Demand, ABM and Customer Marketing Survey for a 56 percent post-handoff failure rate; ZoomInfo publishes two to three times win-rate lifts and engagement ranges it labels directional.
- The Starr Conspiracy's catalogue, updated 9 September 2026, attributes a 171 percent pipeline lift to ITSMA's 2024 study of 167 respondents and defines maturity as 24 or more months in market, which is why every lift figure conditions on maturity.
Reviewed and updated September 18, 2026
Demandbase's Labs report on the state of ABM in 2026, read on 18 September 2026, states its population in the title: 1,452 companies, which the body defines as 1,452 tenants, each a Demandbase instance, plus 429,634 ad campaigns, 38 million marketing activities and 9.7 million sales interactions. 6sense's guide to ABM metrics, rendered the same day, cites its own 2025 report for the claim that nearly 80 percent of organisations have an ABM programme while only 29 percent of ABM teams are measured solely through ABM-aligned metrics, and does not say how many people were asked. Both are benchmark pages. Only one says what sits under the line.
That is the reading rule here. Every account-based marketing benchmark is a ratio, and the ABM metrics guide works through why the denominator is the number a programme can quietly choose. This page does the other half of the job: it collects the published figures, dates each one, and records for each whether the publisher stated a population, so that a team setting targets knows which numbers were measured and which were asserted. Figures from the four publishers that guide already reads, Zoomforth, Improvado, Salesmotion and Influ2, are not repeated here. The platforms the figures describe are compared in account-based marketing platforms and ABM tools.
How to read a benchmark before you adopt it
Three questions decide whether a published figure can become a target. Who was counted: marketers surveyed about their own programmes, or platform telemetry watching accounts move. When: a fielding window or a publication date, because a 2023 win-rate lift describes 2023 buying committees. And what the ratio divides by, the question source pages most often leave out.
A figure that answers all three is a benchmark. A figure that answers none is a claim, and the honest thing to do with a claim is to record it as one. The sections below apply that test to each publisher, in the order of how much they disclose.
Demandbase Labs: the one with a stated population
Demandbase's State of ABM 2026 report is platform telemetry rather than a survey, and it says so: 1,452 tenants, 429,634 ad campaigns, 38 million marketing activities and 9.7 million sales interactions, analysed to identify the patterns that consistently drive stronger pipeline. Its figures, as published on 18 September 2026:
Per the report, teams operating within more mature frameworks see a 22.33 percent median MQA conversion rate, against 14.19 percent for less mature programmes. Per the same report, companies tracking three to four buying groups see a 48.5 percent higher win rate than organisations taking a broader, less structured approach. Companies using four advertising products report a 58.7 percent win rate, which the report describes as a 71 percent lift over companies running none. The report states that organisations connecting CRM, marketing automation and predictive models achieve MQA-to-pipeline conversion rates above 22 percent against a 14 percent baseline among teams with limited integration. And the report states that buying groups receiving 180 to 190 touches reach a 94 percent conversion rate.
Two cautions travel with those numbers. The population is Demandbase customers, so every figure describes programmes already running on an ABM platform, and the maturity and integration splits compare customers to other customers. And the four-ad-products figure compares Demandbase's own advertising tiers, published by the vendor that sells them. Neither caution makes the figures wrong. Both make them a description of a platform's customer base rather than of B2B marketing at large.
6sense: a survey without a count on the page
6sense's guide to ABM metrics, rendered in a headless browser on 18 September 2026 after the vendor's apex refused plain fetches, cites its 2025 report titled What's (Currently) Measured Isn't What Matters for four figures: nearly 80 percent of organisations report having an ABM programme; only 29 percent of ABM teams are measured solely through ABM-aligned metrics; only 13 percent of ABM programmes report closed-won revenue to leadership; and 57 percent of account-based teams use a combined sourced and influenced attribution approach. The guide also states that marketing qualified accounts from target accounts are tracked almost equally with marketing qualified leads from non-target accounts, 49 percent against 44 percent.
The guide states no respondent count and no fielding window for that report, and the report itself was not opened for this page, so its population is recorded as not stated on the page read. The guide's other numbers, that buyers do 84 percent of their research anonymously and that a deal typically involves 150 to 200 touchpoints, appear without a source and are recorded as claims.
The guide also offers worked examples, such as a company whose best fifth of accounts generate three times the pipeline and convert 40 percent faster, and a range of 15 to 25 percent account-to-opportunity conversion for SaaS against 8 to 12 percent for manufacturing. Those are illustrations, not measurements, and should not be quoted as 6sense benchmarks.
| Source | Method | Population on the page |
|---|---|---|
| Demandbase Labs, 2026 | Platform telemetry | Stated: tenants, campaigns, activities |
| 6sense guide | Survey, via its 2025 report | Not stated |
| Forrester blog | Survey, 2024 | Not stated |
| ZoomInfo guide | Directional ranges | Not stated |
| Starr Conspiracy catalogue | Secondary catalogue | Stated for two of five studies |
Forrester: one figure, one named survey
Forrester's ABM blog category page, read on 18 September 2026, carries one benchmark figure in its post summaries. A post by Kelvin Gee dated 28 January 2025 states that according to Forrester's Demand, ABM, And Customer Marketing Survey, 2024, 56 percent of opportunities handed off to sales fail to close successfully. The survey is named and dated; the respondent count is not on the category page, and the survey itself sits behind client access, so the population is recorded as not stated on the page read.
That figure is useful because it is not a lift. It is a base rate for what happens after handoff, and a team reporting influenced pipeline should hold it beside the pipeline number before promising revenue.
ZoomInfo: ranges labelled directional by their author
ZoomInfo's guide to thirteen ABM metrics, on its pipeline site and marked updated 07/02/2026 on the page, publishes ranges rather than measurements and, to its credit, labels them. It states that B2B organisations with mature ABM programmes report two to three times higher win rates on target accounts than on non-ABM pipeline, and that the lift typically takes 12 to 18 months to materialise. It states that top-performing programmes typically see 60 to 70 percent of target accounts engage within the first 90 days, that a penetration rate of 20 to 40 percent within six months is a healthy early-stage benchmark with best-in-class programmes above 60 percent, and that engaging fewer than 40 percent of a buying committee is a leading indicator of stalled deals. It calls the penetration figure an industry directional range.
No study is named for any of those, and the page's customer example, a Smartsheet result, is a vendor case rather than a benchmark. The ranges are recorded here as ZoomInfo's stated expectations, worth having because a team will meet them in a sales conversation.
The Starr Conspiracy: a catalogue with provenance attached
The Starr Conspiracy publishes an ABM benchmarks page, last updated 9 September 2026 by its own stamp, that catalogues figures from five named publishers and states its verification method: each datapoint cross-checked against the original publisher's report or press release, de-duplicated, date-stamped on capture, with unconfirmed datapoints excluded rather than estimated. It also states its limitations, that most cited research skews toward North American and EMEA enterprise organisations with contract values above 50,000 dollars.
Because it is a secondary source, every figure below is recorded as the catalogue's attribution; the underlying reports were not opened for this page. The catalogue attributes to ITSMA's 2024 Account-Based Marketing Benchmark Study, fielded March to May 2024 with 167 respondents, a 171 percent qualified-pipeline lift for mature programmes over matched non-ABM controls within 12 months, a 76 percent share of mature practitioners reporting higher ROI from ABM than from any other marketing investment, a 23 percent share of programmes classified as mature, an 18-month median time from launch to mature performance, and a median of 4.2 engaged stakeholders per target account against 1.6 in non-ABM treatment. It attributes to Demandbase's State of ABM Report 2024, 412 respondents fielded in the second quarter of 2024, a 91 percent larger average deal size for ABM accounts, a 63 percent engagement rate for named accounts in mature programmes within six months, a median closed-won contract value of 148,000 dollars against 76,000 for non-ABM sources, and 3.4 times the engagement for personalised content. It attributes to Forrester's ABM Wave for the second quarter of 2023 a 36 percent higher win rate and a 30 percent faster cycle on ABM-targeted opportunities, to Momentum ITSMA's 2024 performance study a 208 percent increase in marketing-sourced revenue from ABM-engaged accounts, and to Demand Metric's 2024 report a 70 percent adoption rate, up from 49 percent in 2020.
The catalogue is the only source on this page that states the maturity definition behind its lift figures: 24 or more months in market with documented account selection, dedicated headcount and integrated technology. That definition is why the lifts are large: they compare programmes that survived two years to everything else.
| Row | Demandbase 2026 | 6sense guide | Forrester blog | ZoomInfo guide | Starr catalogue |
|---|---|---|---|---|---|
| Who was counted | Yes | No | No | No | Partial |
| When it was measured | Partial | Partial | Yes | No | Yes |
| What the ratio divides by | Partial | No | Yes | No | Partial |
| Maturity defined | No | No | No | Partial | Yes |
| Limitations stated | No | No | No | Yes | Yes |
| Primary research read here | Yes | Yes | Yes | Yes | No |
What the figures agree on, and where they cannot be compared
Two patterns survive across sources that share nothing else. Maturity is the variable every lift figure conditions on: Demandbase's 2026 telemetry splits on framework maturity, ZoomInfo puts the win-rate lift 12 to 18 months out, and the catalogue's ITSMA attribution puts median time to mature performance at 18 months with a 24-month definition. A programme in its first year comparing itself to any of those numbers is comparing itself to a different population. And coverage of the buying group is the input the telemetry sources reward: Demandbase's buying-group and touch-count figures and ZoomInfo's committee-coverage threshold both say that the number of people reached per account moves the outcome, which is the pattern the ABM campaign examples guide shows in practice.
What cannot be done is to line the figures up. A 22.33 percent MQA conversion from Demandbase telemetry, a 21.3 percent MQA-to-SQO conversion the catalogue attributes to a 2024 TOPO and Gartner study, and Forrester's 56 percent post-handoff failure rate are three ratios over three denominators from three populations. A slide that stacks them is a slide about its author.
Using this for targets
Set targets from the source whose population is closest to your programme, and say which source it was. A team on an ABM platform with a defined buying-group model can read Demandbase's maturity split as a range it might move between. A first-year team should take the 18-month figures as a warning against reading its own numbers early, not as a promise. Every team should hold Forrester's post-handoff failure rate against whatever pipeline it reports, because pipeline is the number benchmarks inflate and closed-won is the one only 13 percent of programmes, by 6sense's survey, report upward at all.
We run outbound rather than ABM programmes, on Email Bison and in-house tooling for email and HeyReach for LinkedIn, one message per campaign, and what we are paid for is a qualified meeting that meets criteria agreed in writing. That gives us no stake in the figures above, and it means the denominator question is answered before launch: the list is the population, and a reply rate is a rate over that list and nothing else. If the constraint is that the target accounts are not taking meetings, RevenueFlow books qualified meetings on a pay-per-meeting basis.
The short version
Five sources, read on 18 September 2026, publish account-based marketing benchmarks. Demandbase's 2026 Labs report states its population and gives maturity, buying-group, integration and touch-count figures from telemetry. 6sense's guide cites its 2025 survey for adoption, measurement and attribution figures with no count on the page. Forrester's blog names a 2024 survey for one post-handoff failure rate. ZoomInfo publishes directional ranges and says so. The Starr Conspiracy catalogues five publishers with respondent counts for two, a maturity definition and a stated method. Adopt a figure only once you can say who was counted, when, and what it was divided by.
Demandbase figures and population are per the Labs report page titled The state of ABM in 2026; 6sense figures per its Guide to Account-Based Marketing Metrics, rendered in a headless browser; the Forrester figure per the post summary dated 28 January 2025 on its ABM blog category page; ZoomInfo ranges per its thirteen ABM metrics guide, marked updated 07/02/2026; catalogue attributions per The Starr Conspiracy's ABM benchmarks page, last updated 9 September 2026. All fetched 18 September 2026. Underlying ITSMA, Momentum ITSMA, Demand Metric, TOPO and Forrester reports were not opened for this page.
Sources: The state of ABM in 2026, Demandbase Labs, Guide to Account-Based Marketing Metrics, 6sense, Account-Based Marketing blog, Forrester, 13 ABM Metrics You Should Be Monitoring, ZoomInfo, ABM Benchmarks, The Starr Conspiracy
Frequently asked questions.
Frequently asked questions- What is a good ABM conversion rate?
- It depends on which ratio and whose population. Demandbase's 2026 telemetry across 1,452 tenants puts median MQA conversion at 22.33 percent for mature frameworks and 14.19 percent for less mature ones, and MQA-to-pipeline above 22 percent for teams with CRM, marketing automation and predictive models connected, against a 14 percent baseline. The Starr Conspiracy catalogue attributes a 21.3 percent MQA-to-SQO conversion to a 2024 TOPO and Gartner study. These are different ratios over different denominators.
- How much does ABM lift win rates?
- Published figures all condition on maturity. Demandbase's 2026 report gives a 48.5 percent higher win rate for companies tracking three to four buying groups and a 58.7 percent win rate for companies using four of its advertising products, a 71 percent lift over none. ZoomInfo's guide states two to three times higher win rates for mature programmes over 12 to 18 months, naming no study. The Starr Conspiracy catalogue attributes a 36 percent lift to Forrester's 2023 ABM Wave.
- How long does ABM take to show results?
- Three sources put it past a year. ZoomInfo's guide says the win-rate lift typically takes 12 to 18 months to materialise. The Starr Conspiracy catalogue attributes an 18-month median time from launch to mature-program performance to ITSMA's 2024 study, and records that study's definition of mature as 24 or more months in market with documented account selection, dedicated headcount and integrated technology. A first-year programme comparing itself to mature-programme lifts is comparing itself to a different population.
- Which ABM benchmark sources state their sample size?
- Of the five read on 18 September 2026, Demandbase's 2026 Labs report states its population on the page: 1,452 tenants, 429,634 ad campaigns, 38 million marketing activities and 9.7 million sales interactions. The Starr Conspiracy's catalogue states respondent counts for two of the five studies it cites, 167 for ITSMA 2024 and 412 for Demandbase's 2024 report. 6sense's guide, Forrester's blog category page and ZoomInfo's guide publish their figures without a count on the page.
About the author.

Hosun Chung is COO at RevenueFlow, which builds and operates outbound revenue engines for B2B companies. Previously at Gleacher Shacklock LLP. Studied at London School of Economics.
Hosun Chung · COO
Connect on LinkedIn →Explore more.
Ready to scale your outreach?
We build GTM engines that book real meetings. See the receipts.
Related articles.
Real Estate Cold Email Reply Rate Benchmarks (2026)
No vendor publishes a real estate cold email benchmark. Here are the published reply-rate tiers that do apply, and how to read your own results.
Legal Services Cold Email Reply Rate Benchmarks (2026)
Cross-industry cold email reply rates average 3.43%. Here is what good looks like when your list is law firms, plus the levers with real data behind them.
Cold Email Conversion Benchmarks: 2026 Performance Data
Complete benchmark data for cold email conversion rates from reply to meeting to opportunity. Learn what drives conversions and how to optimize your full funnel.
Education Cold Email Benchmarks: 2026 Performance Data
Industry benchmark data for education cold email campaigns, including open rates, reply rates, and conversion metrics for companies targeting K-12 schools, higher education, and corporate training organizations.
Automotive Cold Email Benchmarks: 2026 Performance Data
Industry benchmark data for automotive sector cold email campaigns, covering OEMs, suppliers, dealerships, and automotive technology with performance metrics by segment and buyer role.
Real Estate Cold Email Benchmarks: 2026 Performance Data
Comprehensive benchmark data for real estate cold email campaigns, including open rates, reply rates, and conversion metrics for companies targeting brokerages, property managers, developers, and real estate investors.