ABM Metrics: Coverage Decides Every Other Number
Every published ABM metric is a ratio whose denominator somebody chose. Six numbers, the denominator each one needs, and the comparison that settles it.
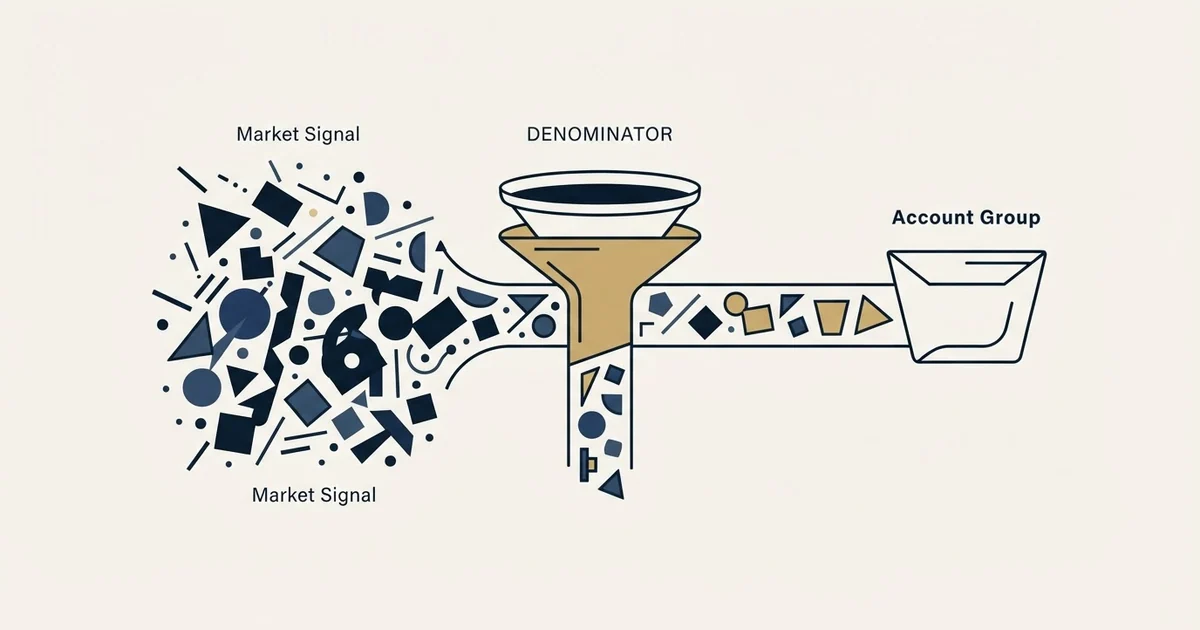
Account coverage in ABM is the share of accounts on your signed target list where you hold a verified contact for someone in the buying group. It is free to compute before any campaign and caps every rate below it, so report it separately, then read reach, response, depth, meetings and pipeline against stated denominators.
Key takeaways
- Coverage, meaning accounts where a verified buying-group contact exists over accounts on the signed list, is free to compute and caps what every other ABM number can show.
- Vendor pages supply the denominator with the metric: Influ2 defines marketing influence as one click or 15 or more impressions within 15 days of a positive sales outcome, a rule rather than a measurement.
- A composite engagement score rises with activity and has no mechanism for falling, so it needs a written decay rule or it should be replaced by the raw counts underneath it.
- The only ABM number that cannot be argued with is the worked accounts compared against accounts from the same signed list that were deliberately left alone over the same period.
Reviewed and updated September 19, 2026
Improvado's account-based marketing metrics guide opens with a summary box asserting that "65% penetration correlates with 3x higher win rates than single-contact engagement". No study is named, no sample size appears, and the page does not say what penetration was divided by. Zoomforth's page on the same subject, published 21 June 2026, sets a target of 60 to 80 percent of target accounts reached each quarter and 3 or more unique contacts reached per target account.
Both of those are ratios, and so is account coverage, the ABM number this page starts from. Neither vendor states what sits under the line, and in account-based work that is the whole argument, because the number under the line is the one your programme can quietly choose.
Every published ABM number is a ratio, and the vendor supplies the bottom half
Zoomforth states the case for a separate measurement framework plainly: "ABM success cannot be measured with standard marketing metrics." That is right, and it is also where the trouble starts, because the replacement metrics arrive already divided.
Account coverage is presented as a percentage of the target list. Penetration is presented as engaged contacts over the size of the buying committee. Influenced pipeline is presented as the value of deals where somebody at the account was exposed to a programme. Each of those three denominators is an estimate, a definition, or a threshold that somebody chose, and in every case the person choosing is either a platform that benefits from a flattering number or a team reporting its own work upward.
Influ2 is unusually clear about this in its own product. Its guide, posted 8 May 2026, defines marketing influence with "the engagement threshold being one click or 15+ impressions" within 15 days of a positive sales outcome. That is a defensible rule and it is a rule rather than a measurement. Move the impression count, widen the window, and the same quarter produces a different influenced-pipeline figure with nothing having changed at any account. The vocabulary underneath ABM works through why influenced is the term that most often goes to a board undefined.
What is account coverage in ABM?
Account coverage in ABM is the share of accounts on your signed target list where you hold a verified contact for someone in the buying group. It is the one ABM metric you can compute for free before any campaign, and it is the denominator that makes every other rate readable, because engagement, response and meetings all sit on top of it.
Take the target list. For each account, do you hold a verified contact for someone in the buying group. The count that comes back is your reachable list. Building the target list you can actually work covers how that check reshapes the tiers; the point here is what it does to reporting.
A programme aimed at 200 accounts that can reach buyers at 60 of them is a 60-account programme. Report engagement against 200 and every rate looks poor, which pushes the team toward rewriting messages that were never delivered. Report against 60 and the rates describe the campaign you actually ran, with the coverage gap sitting beside them as its own number rather than hiding inside everything else.
As an illustration with invented numbers: if 12 of those 60 reachable accounts reply, the account response rate is 12 / 60 = 20% against the reachable list and 12 / 200 = 6% against the signed list. Same replies, same quarter, and a rate under a third of the size, because 140 accounts that received nothing are sitting in the denominator. Coverage, 60 of 200, is 30%, and it belongs on its own line.
ABM engagement, as the phrase is usually searched, is the account-level version of that measurement: the share of reached accounts where more than one contact has done something inside the window, reported against coverage rather than against the target list.
Which ABM metrics show account coverage? Coverage itself is the only direct measure. Reach and buying-group depth show it from inside, because each is divided by something coverage produced, while an engagement rate divided by the full target list hides it completely.
That is why coverage belongs first rather than fifth in a metric list. It is a ratio whose denominator nobody can dispute, because the list is a document somebody in sales signed.
The six numbers, in the order they become readable

Each of these needs the one above it to mean anything, which is why publishing them as an unordered list of KPIs is where most reporting goes wrong.
Coverage. Accounts where you hold a verified contact in the buying group, over accounts on the signed list. This is a data measurement and it belongs to whoever builds lists.
Reach. Accounts that received a delivered message, over reachable accounts. Delivered, rather than sent. A bounced address and an inbox that never received anything are indistinguishable from a decision not to answer, and until they are separated no conclusion about messaging survives.
Account response. Accounts where a named person replied, over accounts reached. This is the cleanest read on the argument you made, and it is the number an outbound-led programme should watch weekly.
Buying-group depth. Engaged contacts at an account, over the roles you decided the purchase requires. The denominator is a judgement and it should be written down before the quarter starts, per tier, so it cannot be adjusted afterwards to make the fraction look better. The account journey and who owns each stage sets out why depth is the earliest honest sign of progress.
Meetings held. Meetings against accounts reached. Not against the target list, and not against accounts engaged, because engagement is the loosest term in the vocabulary.
Pipeline from target accounts, beside pipeline from everything else, over the same period. Cruder than an attribution model and considerably harder to flatter.
What the published lists count instead
The vendor guides are worth reading, and worth reading as artefacts of who publishes them.
Demandbase's measurement guide, under the byline of Chris Moody, its former Chief Evangelist for Marketing, groups the field into engagement, journeys and attribution, and argues that "While leads and opportunities are essential B2B marketing metrics, they are insufficient to measure the success of an account-based marketing strategy." The categories are sensible. What sits inside the first one is an account engagement score, described on that page as a composite combining website visits, content downloads, event attendance and email interactions.
Influ2's list, posted 8 May 2026, is the more useful of the two because it separates leading from lagging indicators and says what its own thresholds are. It also reports, citing research it commissioned from Forrester, that "only 31% of ABM teams currently track total influenced revenue". That is a vendor's claim about its own commissioned survey rather than an independent finding, and it should be read at that confidence level.
Salesmotion's page, updated 11 June 2026, promises "Formulas, benchmarks, and how to report ABM ROI to leadership without vanity numbers" and then gives "an industry benchmark" for each of its seven metrics. Improvado's supplies the correlation quoted at the top of this page. In both cases the benchmark arrives without the population it was measured on, which makes it a decoration rather than a yardstick, the same failure the lead generation statistics genre runs on.
| Publisher | The number it offers | The catch |
|---|---|---|
| Improvado | 65% penetration correlates with 3x higher win rates | No study, sample or denominator named |
| Zoomforth | 60 to 80 percent of target accounts reached a quarter; 3 or more contacts per account | No population behind the target |
| Influ2 | Influence counted at one click or 15+ impressions within 15 days of a positive sales outcome | A rule it chose: move it and the figure moves |
| Demandbase | An account engagement score combining visits, downloads, events and email | A composite that rises with activity and cannot fall |
| Salesmotion | An industry benchmark for each of seven metrics | No population behind the benchmark |
None of that makes the underlying advice wrong. It means the figures in these pages tell you what the category currently wants to be true, and your own series tells you what is.
The published figures themselves, dated and with each publisher's population recorded beside them, are collected in ABM benchmarks.
The same reading applies to the account-based marketing trends published each year, which are mostly a vendor's category forecast rather than a measurement and which arrive without the population anyone could check them against.
The score that cannot fall

The composite engagement score deserves its own warning, because it is the metric every platform leads with and the one least able to disappoint anyone.
A composite that adds points for visits, downloads, opens and event attendance rises whenever activity happens and has no mechanism for falling when an account goes cold. Run it for a year and the chart climbs, which reads as a programme working and is equally consistent with a programme accumulating clicks from accounts that will never buy. Once a leadership team has watched that line rise for four quarters, nobody in the room wants to introduce the decay rule that would make it fall.
The obvious repair is a decay rule, and it helps. The stronger one is to stop publishing the composite at all and publish the two or three counts underneath it: contacts reached at this account, replies from named people, meetings held. Those are interrogable, they fall on their own, and they do not invite a comparison between two accounts whose scores were assembled from completely different components. A composite carries false precision in exactly the place a board reads it as accuracy.
Influ2's own guidance points the same way on the threshold question: "Teams should define a minimum bar before counting an account as engaged, and align that definition with sales upfront."
The comparison that settles the argument
Every ABM programme eventually faces the question of whether the accounts would have closed anyway, and no dashboard answers it. One comparison does.
Take the original signed list. Report the accounts you worked against the accounts from that same list you did not, over the same period, on the same metrics. If the worked accounts show more pipeline, that is evidence. If the two groups look alike, the programme has been measuring its own promotion rule, because a segment selected for engagement will always progress faster than one that was not selected at all.
This is cheap, it needs no platform, and it is the reason to resist the instinct to work every account at once. Holding back a comparison group costs you some coverage in the first quarter and buys you the only number in the programme that cannot be argued with.
What to report upward, and what to keep for yourself
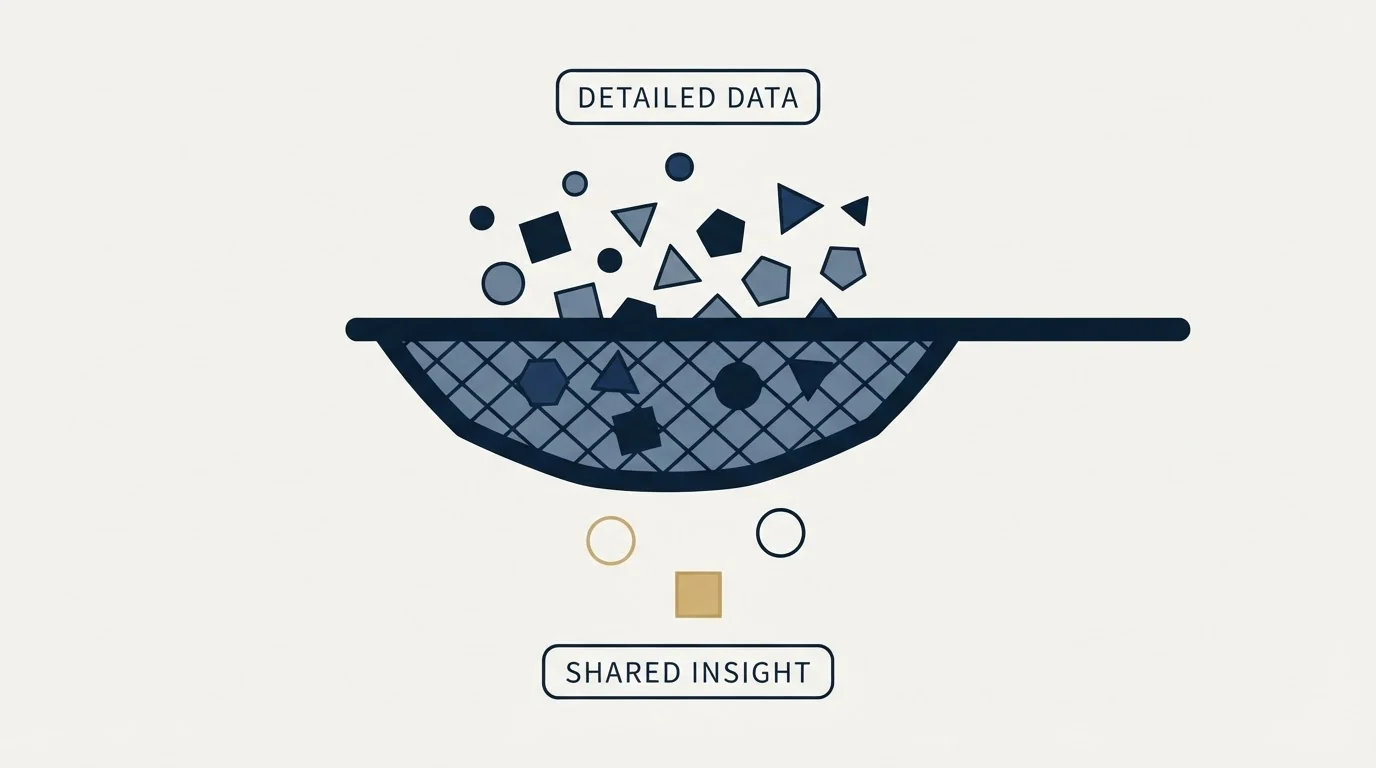
The board wants one number and will accept two. Pipeline created from target accounts, beside pipeline created from everything else, over the same period, is the pair that survives scrutiny, and it is the pair the four account-based plays are ultimately judged on.
Coverage, reach, response and depth are operating numbers. They belong in the weekly review because each one points at a specific repair. A coverage problem is a data project. A reach problem is deliverability. A response problem is the argument. A depth problem is a research and outreach gap inside accounts you have already reached. Reporting all four to a board converts four actionable diagnoses into one vague impression of activity.
Who reads which of these numbers, how often, and in what order on the page is the subject of our guide to ABM reporting.
The platforms sell the fourth job, which is one account view across channels with the scoring and reporting attached, and what those platforms actually sell is worth reading before assuming the reporting requires one. Every number above comes out of a CRM with a target-account flag on it.
The short version
Every published ABM metric is a ratio, and the denominator is chosen rather than measured. Compute coverage first, because it is free, it is undisputed, and it caps what the rest of the programme can do. Report every downstream rate against the reachable list and keep the coverage gap visible beside them.
Separate delivery from response, write the buying-group denominator down before the quarter starts, and give any composite score a decay rule or drop it for raw counts. Then compare the accounts you worked with the accounts from the same list you did not, which is the one number a vendor benchmark cannot supply and your own quarter can.
If the part you want measured first is whether the accounts on your list can be reached at all, that is what a first wave establishes, and we will build one against your target accounts so the coverage number is real before anything is budgeted around it.
Third-party figures above were read first-hand from each publisher's own page. Publication dates are the ones each page displays. Verify current figures at the source before relying on them.
Sources: Improvado, 15 Account Based Marketing Metrics, Zoomforth, Account-based marketing metrics: what to track, Influ2, 6 ABM Metrics That Actually Prove Your Program Is Working, Demandbase, How to measure account-based marketing, Salesmotion, 7 ABM Metrics That Actually Prove ROI
Frequently asked questions.
Frequently asked questions- What is account coverage in ABM?
- It is the share of accounts on your signed target list where you hold a verified contact for someone in the buying group. You can compute it for free before any campaign runs, and it caps every other number: an account with no reachable contact can never reply, engage or book a meeting, however good the message is.
- What ABM metrics show account coverage?
- Coverage itself is the only direct measure: accounts with a verified buying-group contact over accounts on the signed list. Reach and buying-group depth show it from inside, because each is divided by something coverage produced. An engagement rate divided by the whole target list hides it, which is why coverage should be reported as its own number beside every rate.
- Why do ABM benchmarks from vendor pages not transfer?
- A benchmark is only comparable when the two populations match, and vendor pages publish target ranges without naming the population, the sample or the definition behind them. Improvado states that 65% penetration correlates with 3x higher win rates without naming a study. Your own quarter-on-quarter series is measured on the accounts you actually contacted, which is the comparison that holds.
- Should account engagement score go on the board report?
- No. A composite that adds points for visits, downloads, opens and event attendance climbs whenever activity happens and rarely falls, so a rising line is equally consistent with a working programme and with accumulating clicks from accounts that will never buy. Report pipeline from target accounts beside pipeline from everything else instead, over the same period.
About the author.

Ben Carden is CRO at RevenueFlow, which builds and operates outbound revenue engines for B2B companies. Previously at Gartner Enterprise. Studied at London School of Economics.
Ben Carden · CRO
Connect on LinkedIn →Explore more.
Ready to scale your outreach?
We build GTM engines that book real meetings. See the receipts.
Related articles.
5 ABM Campaign Examples and How Each One Is Built
Five worked account-based campaign examples, each built on the same five fields: account set, tier, plays in order, owner and handoff, and the exit condition.
ABM vs ABX: What Demandbase Added to the Model
One of these terms belongs to a vendor. What Demandbase says ABX adds, the three things that genuinely change, and the three that stay identical.
ABM Reporting: Three Readers, Three Cadences
ABM reporting built around who reads it: a weekly operating page, a monthly allocation page and a one-page quarterly board report, each computed from CRM fields.
Lead Verification: What Each Check Actually Proves
Lead verification covers two different jobs. One asks whether a mailbox will accept mail, the other asks whether the person behind the row is real and lawful to contact.
Two Agencies, One Target List: Who Owns Which Accounts
Two outbound suppliers on one market will contact the same companies unless the buyer splits it first. How to cut the list, run the exclusion feed and check the overlap.
Last Outbound Agency Did Not Deliver: Locating the Failure
The leads were bad names a symptom and no stage. Four places an outbound engagement fails, the counts that separate them, and what to change in the next purchase.