B2B Marketing Conversion Rates: Who Published What
Every published B2B conversion benchmark, by channel and by stage, with the publisher, the population, the method and the date beside each figure.
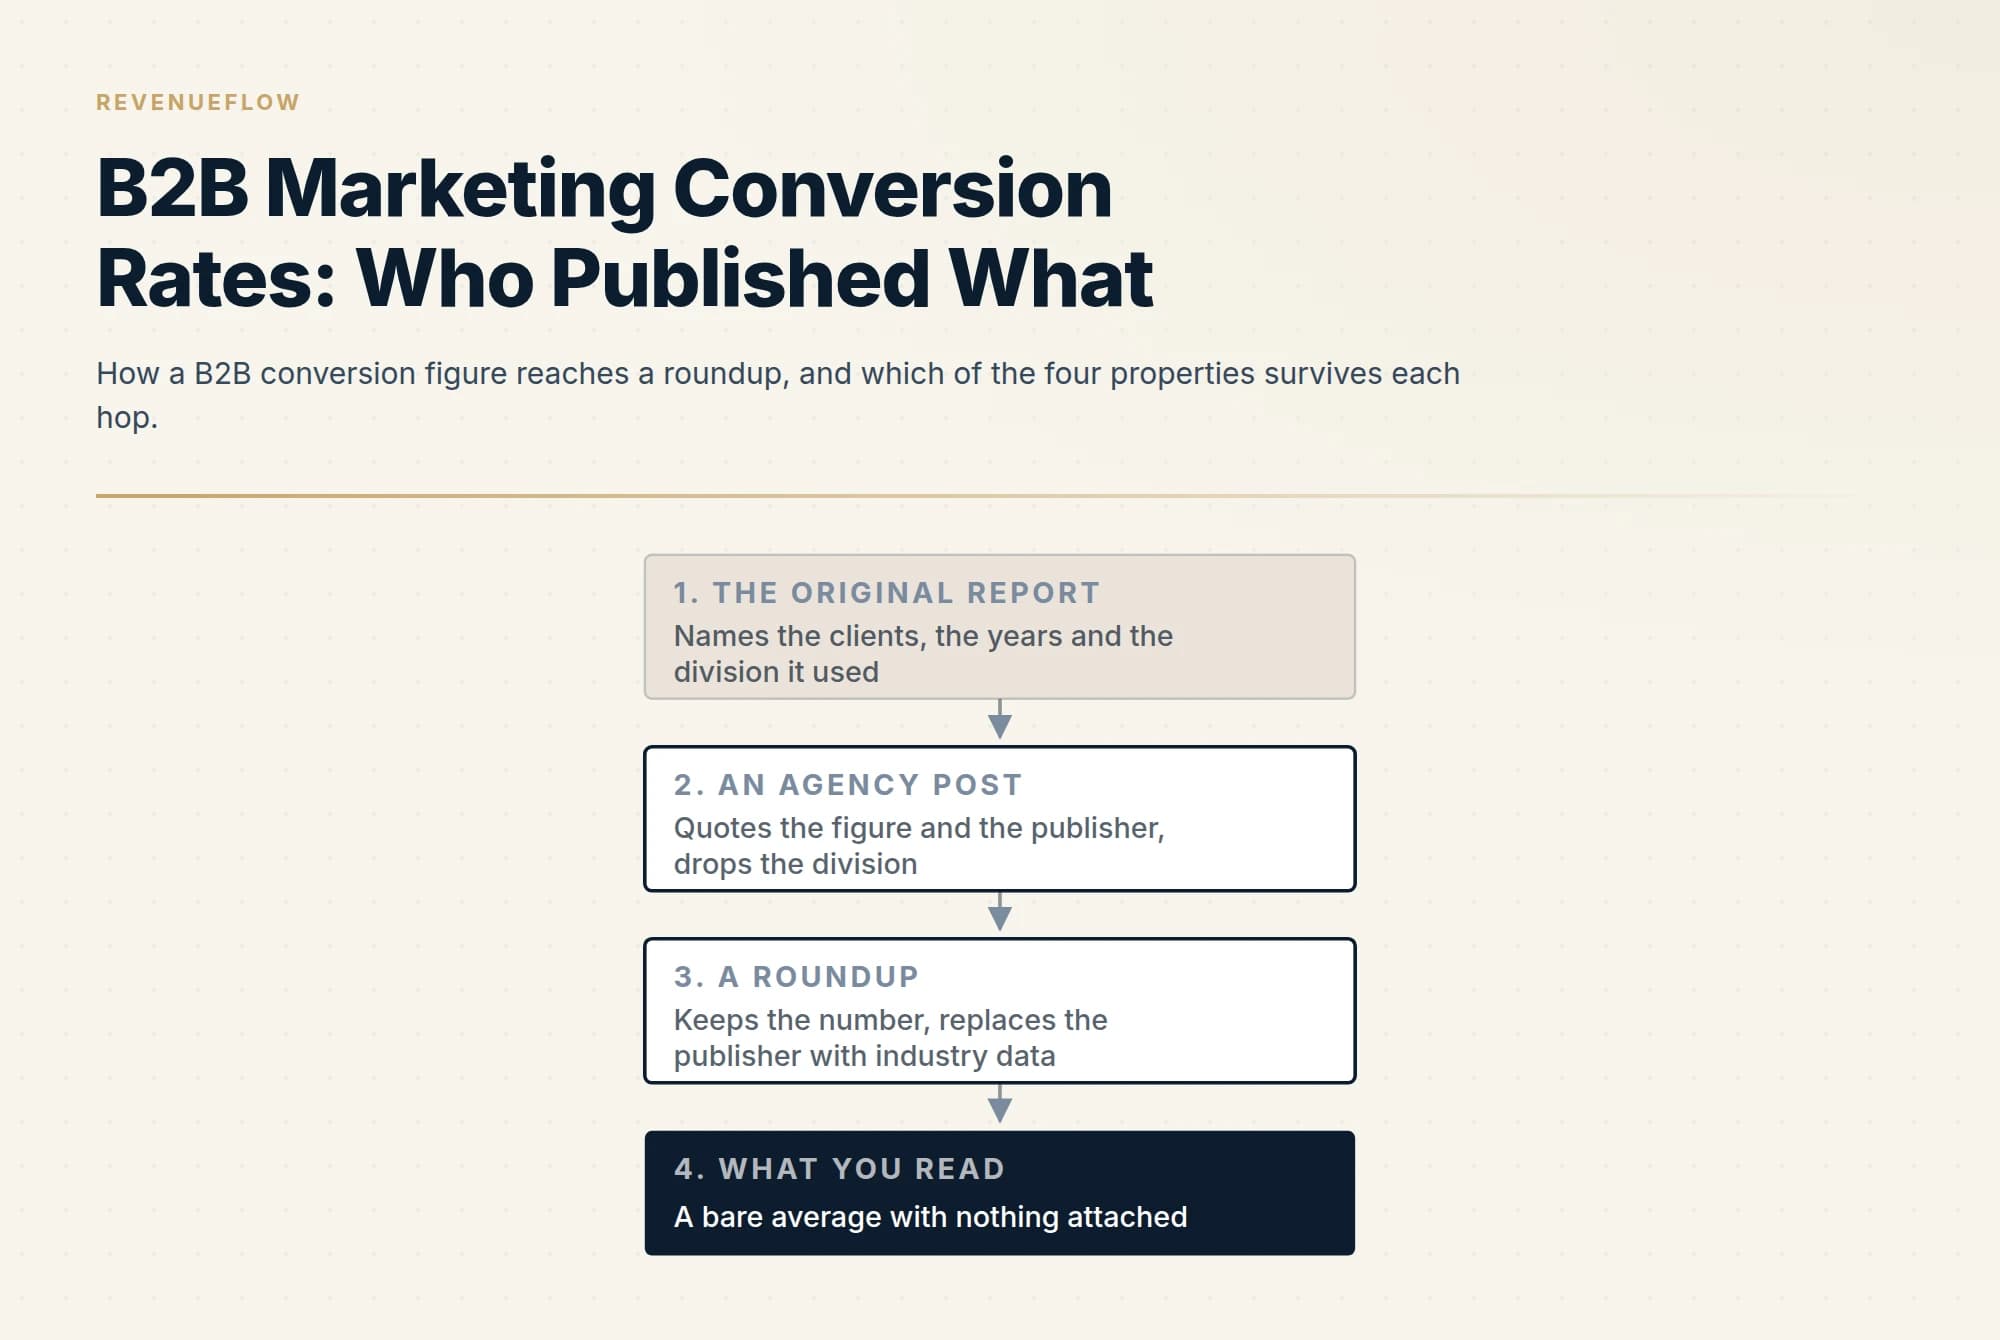
There is no single B2B marketing conversion rate. Two publishers state a population and a method, First Page Sage and Ruler Analytics, and their channel tables still differ by a factor of two on email because they count different events over different companies. Below the top of the funnel almost nothing carries a population.
Key takeaways
- Two publishers of B2B conversion benchmarks state both a population and the division they used; the rest publish a range and leave the reader to guess what was counted.
- First Page Sage divides leads by visitors sent through a channel in a year; Ruler Analytics counts a qualified lead or sale through multi touch attribution, which is why their email figures differ by roughly a factor of two.
- Sourcing thins out as you move down the funnel: lead to opportunity has one populated report and four published good ranges that contradict each other with no population between them.
- Both populated datasets are built from traffic that selected itself, so neither describes a visitor who arrived because a stranger wrote to them.
Reviewed and updated September 21, 2026
Four organisations publish a B2B conversion rate benchmark and four of them are right. Ruler Analytics puts the overall average at 5.13 percent, First Page Sage puts account based marketing at the top of its B2B channel table at 3.8 percent and public relations at the bottom at 0.3 percent, Belkins reports its own lead to appointment rate at 35.98 percent, and New Breed says that for B2B companies a lead to opportunity rate of 10 to 15 percent is generally good. Those four numbers are not competing estimates of one quantity. They are measurements of four different transitions, taken over four different populations, and three of the four say so on the page if you read far enough.
This page is a catalogue of what has actually been published, by channel and by stage, with the publisher, the population, the method and the date beside every figure. It is not a target list. The definitional work underneath it, why a rate with only one end named is a decoration and why the denominator is where the argument lives, is in the conversion rate entry, and the same discipline applied to one object at length is in the landing page benchmark. Neither is restated here.
Who has published one, and what each one counted
Two publishers do the work properly enough to be quotable, and they disagree with each other for reasons that are visible in their own method statements.
First Page Sage publishes a family of separate reports. Its channel report, last updated 28 March 2025 and read on 21 September 2026, describes its source in one sentence: "This report presents conversion rate data from our agency's clients collected between 2018 and 2024." It then states the arithmetic, which almost nobody else does: "We calculate conversion rate by dividing the number of leads that resulted from a marketing channel by the total number of visitors sent through that channel in a one year period." Its funnel report for software, last updated 11 June 2025, states a headcount: "Our data set comes from access to 50+ B2B SaaS clients over the last decade, mostly small-to-midsize businesses in the $10M-$100M revenue range." Its lead to marketing qualified lead report, last updated 1 August 2025, carries a heading called Limitations of Data Set and discloses the mix underneath it: "Our agency's clients skew about 70% B2B", with large business to consumer e-commerce companies making up part of the remainder.
Ruler Analytics publishes one report with a different shape. Its 2026 edition, dated 26 May 2026, is titled around its population, conversions tracked across thirteen industries, and it defines the ending event before it gives a number: "For this study, we define a conversion as a qualified lead or sale, someone who has shown a genuine interest in your product or service and has a higher likelihood of becoming a customer." It also names the instrument, multi touch attribution across online and offline conversions in its own product, which matters because it decides what gets credited to which channel.
Those two are the populated end of the literature. The other end is worth seeing beside them. Belkins publishes its own agency numbers and labels them as such: "Based on our 2023 data, the average lead-to-appointment rate across all channels is 35.98%." That is an honest sentence about one agency's own book of business, and it is roughly seven times the Ruler average, because a lead to appointment rate over a qualified outbound list and a visitor to conversion rate over website traffic are not the same fraction. The same Belkins page then sources its channel figures elsewhere, "based on 2023 data from Ruler Analytics", which is the citation chain made visible.
By channel: two tables that do not describe the same thing
First Page Sage segments its channel table by target audience and publishes a B2B column. Read on 21 September 2026, First Page Sage puts thought leadership search at 2.6 percent, email marketing at 2.4 percent, webinars at 2.3 percent, public speaking at 2.9 percent, organic social at 1.7 percent, video at 1.3 percent, paid search at 1.5 percent, paid social at 0.9 percent, trade shows at 0.7 percent, outdoor advertising at 0.6 percent, public relations and direct mail at 0.3 percent each, and account based marketing at 3.8 percent with no B2C equivalent. Every one of those is leads divided by visitors sent through that channel in a year, which is the definition quoted above.
Ruler Analytics segments by marketing source rather than by activity, and its 2026 averages across all industries read paid search 5.4 percent, artificial intelligence referral 5.8 percent, email 4.9 percent, organic search 4.9 percent, referral 4.8 percent and direct 4.7 percent. Ruler Analytics puts its own overall average at 5.13 percent.
Put the two side by side and email reads at 2.4 percent in First Page Sage's table and 4.9 percent in Ruler Analytics' own. Neither is wrong. First Page Sage divides by visitors sent through the channel and counts a lead; Ruler counts a qualified lead or sale, tracked through multi touch attribution across online and offline conversions, over a different set of companies in a different period. A reader who takes the higher number as the benchmark and the lower one as underperformance has compared two fractions that share a label and nothing else.
| Publisher | Population as stated | Date on the page |
|---|---|---|
| First Page Sage, channel report | Agency clients, data collected 2018 to 2024 | Last updated 28 March 2025 |
| First Page Sage, software funnel | More than fifty B2B software clients over a decade | Last updated 11 June 2025 |
| Ruler Analytics, 2026 benchmarks | Conversions tracked across thirteen industries | Dated 26 May 2026 |
| Belkins, own agency data | Its own book of business in one year | Stated as 2023 data |
| Roundups and calculators | Not stated anywhere on the page | Often only the article year |
By stage: five transitions, and only one of them is well sourced
An outbound or inbound motion produces a chain of transitions rather than a single rate, and the published benchmarks thin out sharply as you move down it. The glossary entry sets out the five outbound conversions in order and what each one answers to; the point here is which of them anybody has actually measured and published.
Visitor to lead is the best covered, because it is what a website analytics product can see, and it is what both populated datasets above are measuring. Lead to marketing qualified lead has one populated source, First Page Sage's dedicated report with the client mix disclosed. Marketing qualified to sales qualified is where the literature falls apart: LeanData's post on declining conversion attributes a thirteen to twenty one percent range to "Forrester and multiple industry benchmark reports" without naming one of them, which means the range cannot be checked, cannot be dated and cannot be compared with your own.
Lead to opportunity is the transition people search for most and the one where the sourcing is thinnest. The lead to opportunity conversion rate is opportunities created divided by leads received over the same period, and the question it gets asked to settle, whether yours is any good, is the one the published figures cannot answer. First Page Sage publishes a dedicated report and, unusually, prints the definition it used, drawing on "both our internal sales data and clients we've worked with from 2019 through 2025" and counting as opportunities only those leads that had passed through the lead, marketing qualified and sales qualified stages. That is one populated source. Beside it sit four incompatible answers to the same question with no population between them: New Breed says a rate of 10 to 15 percent is generally good for B2B companies and 20 to 30 percent excellent, a calculator vendor repeats the 10 to 15 percent figure, a pipeline library gives 5 to 20 percent, and a metrics dictionary gives 12 to 13 percent. Four published good ranges, four publishers, no stated population anywhere. A team reporting 14 percent can be told it is good, excellent, average and below par without leaving the first page of results.
Sales qualified to closed won has the same single source and the same gap. The practical consequence is that the further down the funnel a published benchmark sits, the more likely it is to be somebody's impression written as a number.
What the numbers cannot tell you, and what they can
A published benchmark answers one question well: whether the way you have defined your own metric is unusual. If your visitor to lead rate is an order of magnitude above every populated dataset, the likeliest explanation is that you are counting a different ending event, not that your site is ten times better than the average of fifty software companies. Used that way, an external figure sends you back to your own instrumentation, which is where the useful work is.
It answers the target question badly, and the by channel tables show exactly why. Both of the populated datasets are assembled overwhelmingly from inbound traffic, people who searched, clicked an advertisement aimed at them, or opened a list they had joined. A visitor arriving because a stranger wrote to them has done none of those things, so no figure in either table describes that population. The same argument, worked through for one page type, is in the landing page benchmark, and the reason a cross channel comparison fails before it starts is in the conversion rate entry.
Two live pages on this site carry conversion benchmark tables of their own, cold email conversion benchmarks and SaaS cold email benchmarks. Both describe their data as compiled from publicly available industry research with no named source. By the standard this page applies to everyone else, they are directional and not citable, and they are named here rather than used. The four properties a figure has to carry, who collected it, who was asked, when, and what was divided by what, are set out for the wider literature in sales statistics, and the reason a rate belongs beside its own count in every view is in reply volume versus reply rate.
- Yes: You are reading the original report rather than a roundup quoting it
- Yes: The publisher says who its clients or accounts were
- Yes: The starting and ending events are written down in the publisher's words
- Yes: The date on the data is known, separately from the date on the article
- Yes: The traffic underneath it is the same kind as yours
- Yes: Your own count is published beside your own rate
- No: An outbound motion is being judged against an inbound dataset
The short version
The B2B marketing conversion rate is not one number and the published figures are not competing estimates of it. First Page Sage and Ruler Analytics are the two publishers in this space that name their populations and their arithmetic, and their channel tables still disagree by a factor of two on email because they count different events over different companies. Below the top of the funnel the sourcing thins out fast: lead to opportunity has one populated report and four unsourced good ranges that contradict each other.
Read a benchmark to check your own definitions, not to set a target. Your own series, measured the same way for several consecutive periods with the count published beside the rate, tells you more than any of them, and it is the only version that can detect your own changes. When the constraint turns out to be the supply of qualified conversations rather than the rate at which they convert, see what a first campaign produces against your own market.
Figures above were read on the publishers' own pages on 21 September 2026, with dated snapshots kept as evidence, and each is attributed to the page it appears on. RevenueFlow contributes no conversion data of its own to this page. Verify current figures at source before relying on them.
Frequently asked questions.
Frequently asked questions- What is a good B2B marketing conversion rate?
- Nobody can answer that for you, because the published figures measure different transitions over different populations. Ruler Analytics puts its overall average across thirteen industries at 5.13 percent for a qualified lead or sale; First Page Sage's B2B channel table runs from 0.3 percent to 3.8 percent for leads over visitors. Both are correct and neither is a target for your motion.
- Why do published B2B conversion rates disagree so much?
- Because they are different fractions wearing one label. The publishers choose different starting events, different ending events, different populations and different windows, and most of them do not state any of the four. When two figures for the same channel sit a factor of two apart, the usual explanation is the definition rather than performance.
- Which B2B conversion benchmarks are actually sourced?
- First Page Sage publishes a family of reports that each name the client base and the period, and its channel report also prints the arithmetic it used. Ruler Analytics states its definition of a conversion and the attribution method behind it. Below the top of the funnel, most published ranges name no research at all, including the widely repeated marketing qualified to sales qualified range.
- Can I use a marketing conversion benchmark for outbound?
- No, and the datasets say why. Both of the populated ones are assembled from visitors who searched, clicked an advertisement aimed at them, or opened a list they had joined. Somebody who arrives because a stranger wrote to them has done none of that, so the denominator is a different kind of object and the comparison fails before it starts.
About the author.

Hosun Chung is COO at RevenueFlow, which builds and operates outbound revenue engines for B2B companies. Previously at Gleacher Shacklock LLP. Studied at London School of Economics.
Hosun Chung · COO
Connect on LinkedIn →Explore more.
Ready to scale your outreach?
We build GTM engines that book real meetings. See the receipts.
Related articles.
Sales Enablement Statistics, Traced to Their Sources
The sales enablement figures in circulation, followed to their publishers: which state a population, which are gated, and which are quietly seven years old.
Sales Training Statistics, Traced to Their Sources
Every circulating sales training figure followed to whatever produced it, from a named survey of seventy one professionals to an 1885 memory experiment.
Real Estate Cold Email Reply Rate Benchmarks (2026)
No vendor publishes a real estate cold email benchmark. Here are the published reply-rate tiers that do apply, and how to read your own results.
Legal Services Cold Email Reply Rate Benchmarks (2026)
Cross-industry cold email reply rates average 3.43%. Here is what good looks like when your list is law firms, plus the levers with real data behind them.
Cold Email Conversion Benchmarks: 2026 Performance Data
Complete benchmark data for cold email conversion rates from reply to meeting to opportunity. Learn what drives conversions and how to optimize your full funnel.
Education Cold Email Benchmarks: 2026 Performance Data
Industry benchmark data for education cold email campaigns, including open rates, reply rates, and conversion metrics for companies targeting K-12 schools, higher education, and corporate training organizations.