Average Landing Page Conversion Rate: What It Measures
Four published answers to one question span more than four to one. What each dataset actually counted, and why none of them applies to a page fed by cold outbound.
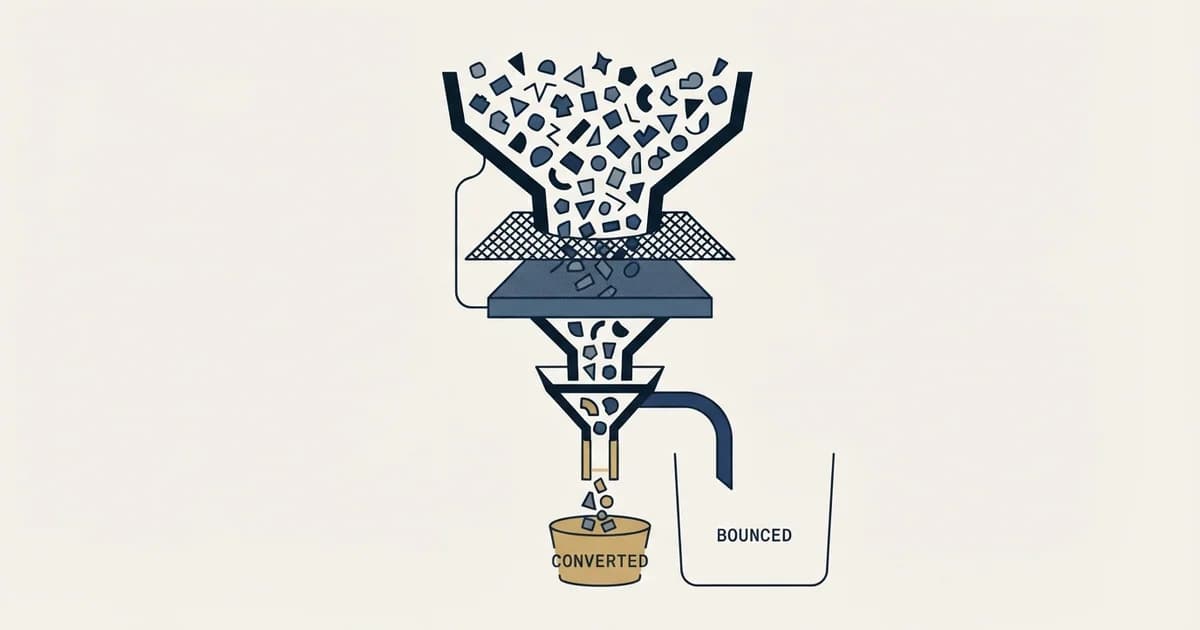
Published figures range from 2.35% to 10.76% because they measure different populations. Unbounce reports a 6.6% median across 41,000 pages from Q4 2024. WordStream reports a 2.35% median across Google Ads accounts, GetResponse a 10.76% average on opt-in pages. Method, conversion definition, page type and traffic source all differ.
Key takeaways
- The most-quoted figure, 6.6%, is described by its own source as a median across 464,000,000 visits to 41,000 landing pages, using Q4 2024 data.
- The published spread runs from a WordStream median of 2.35% to a GetResponse average of 10.76%, and LanderLab states plainly that none of these numbers is wrong.
- Benchmark datasets are built from search, paid and opt-in traffic where the visitor selected themselves, so they cannot be transferred onto a page fed by cold outbound.
- A rate can rise while the number of conversions falls, so publish the absolute count beside the percentage every time.
Reviewed and updated September 2, 2026
Four published answers to this question are 2.35%, 5.89%, 6.6% and 10.76%. That is a spread of more than four to one for what reads like a single number about a single object.
None of them is wrong. LanderLab, which assembles three of those figures side by side, says so itself in six words: "None of these numbers is wrong." A landing page conversion rate benchmark is a measurement of somebody's dataset rather than a property of landing pages, which is why four of them can disagree without any of them being in error. They are measurements of different populations, taken with different definitions, and they are being read as though they were four attempts at the same measurement. That is how a marketer ends up telling a board that a page converting at 4% is either well above par or barely a third of normal, depending which tab was open.
What each number actually counted
The figure most people end up quoting is Unbounce's. Its page states that "The average conversion rate for a landing page is around 6.6% across all industries as of Q4 2024", and it is admirably explicit about the dataset behind it: "464,000,000 visits to 41,000 unique landing pages and 57,000,000 conversion actions".
Read the next sentence on that page, though, because almost nobody carries it forward. On Unbounce's own telling, 6.6% is not an average at all. The page says the figure "is actually the median conversion rate", and explains the choice: with outliers in play, "the median (or middle value in the data set) is actually a better representation". Its stated reason is the whole problem in one line, namely that the definition of a conversion "can vary greatly from one landing page to the next", so a mean across 41,000 pages would be dragged around by whichever pages defined conversion most loosely.
LanderLab names the other three and, unusually, names their methods too. WordStream's broad cross-industry dataset gives a "median of 2.35%", with the "top 25% at 5.31% or higher" and the "top 10% at 11.45% or higher". GetResponse, working from 18 industries of opt-in focused pages, reports an "average of 10.76%". First Page Sage, working from 80 or more B2B clients on an MQL definition, publishes a by-industry table whose rows ran from 1.0% to 3.1% when read on 2 September 2026, with no single B2B aggregate on that page; the 3.6% B2B figure that LanderLab attributes to it was not on First Page Sage's own page that day.
SeedProd's page supplies the fourth and shows the collision inside a single article. Its body attributes to HubSpot the claim that "the average conversion rate across all industries is 5.89%", while its own FAQ block opens "A good landing page conversion rate is around 10% across most industries" and then anchors that to the 6.6% Unbounce median. Three figures in one article, each correctly attributed, none of them the same measurement.
- A median, not a mean
- Broad cross-industry dataset
- Google Ads accounts, so paid search traffic
- Top quartile given as 5.31% or higher
- The lowest of the published figures
- A median, and the page says so
- 41,000 landing pages
- 464 million visits, 57 million conversions
- Labelled Q4 2024 data on the page itself
- The figure most roundups re-quote
- An average, not a median
- 18 industries
- Opt-in focused pages only
- Webinar pages given separately at 22.84%
- The highest of the published figures
Four reasons one object produces different numbers

Each of these is an independent choice, each is defensible, and a published figure rarely states any of them.
Median or mean. Unbounce gives a median and labels it one, in the words "is actually the median conversion rate". LanderLab records the GetResponse figure as an "average of 10.76%". On a distribution with a long tail of very high performers, which this one is, a mean sits well above a median, so part of the distance between Unbounce's 6.6% and GetResponse's 10.76% is arithmetic rather than performance. Quoting a median as "the average" is a small imprecision at the source and a large one three citations downstream, where the qualifier has been dropped.
What counts as a conversion. An email opt-in, a demo request, a trial signup and a purchase are not comparable events and do not occur at comparable rates. GetResponse's dataset is opt-in focused and its figure is the highest of the four; First Page Sage's is MQL-focused and its figure is near the bottom. The datasets are behaving exactly as their definitions predict.
Page type. A gated one-page content offer and a demo request page are both landing pages and behave nothing alike, because the price the visitor pays differs by an order of magnitude. LanderLab's own webinar figure makes the point at full strength: GetResponse found "an average conversion rate of 22.84%" for webinar registration pages against its overall 10.76%. Every field on a form raises that price, which is the argument in landing page lead generation, so a form-length difference alone can move a rate further than any benchmark gap.
Traffic source. This is the one that decides whether a benchmark can be used at all, and it is the next section.
Underneath all four sits a general problem that applies to every rate in marketing and outbound alike: a conversion rate is a pair of definitions plus a division, and a figure quoted without both ends named is a decoration. That argument in full, including why the denominator is where the real disagreement lives, is in conversion rate.
Why none of it transfers onto outbound traffic
Every one of these datasets is assembled from pages fed overwhelmingly by paid search, paid social, organic search and email. Those visitors share one property the number quietly depends on: they selected themselves. Somebody typed a query, opened a list they had subscribed to, or clicked an ad shown to them because a platform judged them likely to click it. By the time they reach the page, an act of intent has already happened.
A visitor arriving from cold outbound has done nothing of the kind. They were not looking, they did not search, they are not on a list they joined, and the only reason they are on the page is that a message they did not ask for gave them a reason to click. Their prior trust is the lowest of any source and their sensitivity to a mismatch between the message and the page is the highest.
So the denominators are different kinds of object, and comparing across them is the same category error as putting an advertising conversion rate and an outbound one on the same chart. The channel with the most self-selected denominator wins, and it wins for a reason that has nothing to do with the page.
The practical consequence is worth stating flatly. A page fed by cold outbound reading below the published median is not evidence of a bad page. It is the expected reading, and treating it as a defect sends a team to rebuild a page when the constraint was somewhere else entirely.
A quieter version of the same problem lives inside a single company. A page fed by branded search and by cold traffic at once reports one blended rate that describes neither audience. Segment by source before drawing any conclusion, and distrust any rate quoted without one.
- Arrived by typing a query or clicking a targeted ad
- Intent demonstrated before arrival
- The population most benchmark datasets are built from
- Reads highest of the three, structurally
- Already agreed to hear from the sender
- Lowest commitment asked, often a second opt-in
- Where the highest published figures come from
- Not comparable to any cold channel
- Was not looking and did not search
- Lowest prior trust of any source
- Most sensitive to a message and page mismatch
- No published benchmark covers this population
What to measure instead
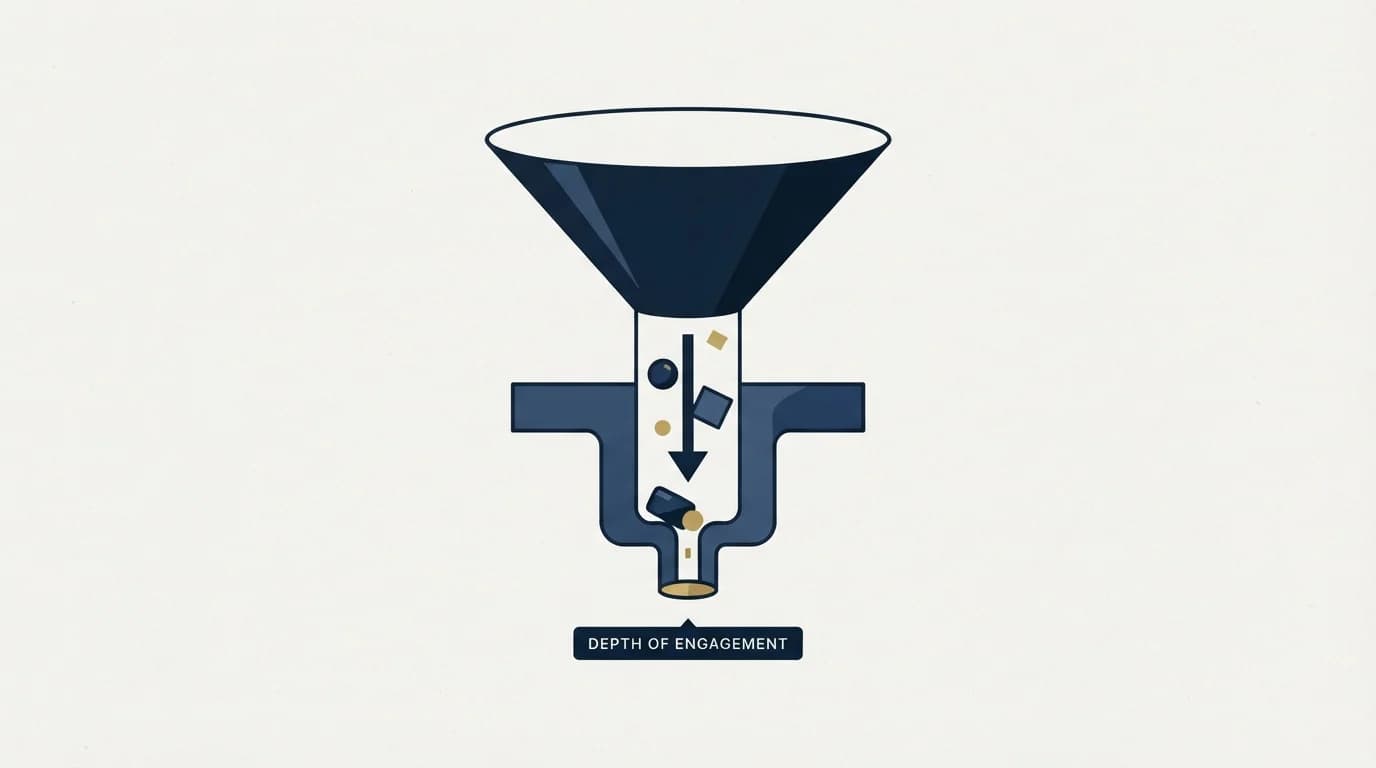
The number that should govern a page is not its submission rate. It is the share of submissions that become qualified conversations, and the cost of producing one.
That measure resists the easy optimisations, and the easy optimisations are why benchmark-chasing is actively harmful rather than merely useless. Removing form fields raises the submission rate. Softening the offer raises it. Both make everything downstream worse, and a page that doubles submissions while halving their quality reads as flat on the right metric and as a triumph on the wrong one. How cost per lead misleads when read on its own is unpicked in cost per lead B2B.
The same trap has a documented sibling. A rate can rise while the absolute number of outcomes falls, because narrowing an audience removes the weakest part of the denominator. Both facts are true and only one of them pays anybody, which is why the rate and the count belong in the same view every time. That case is made at length for reply rates in reply volume versus reply rate and it transfers directly.
Building a baseline that is actually yours
Three weeks of your own data beats any published figure, and the reason is not rigour. It is that your own number is the only one that can detect your own changes.
The same caution travels to other benchmarked figures, and what published deal-size figures assume shows why a figure quoted without its population describes somebody else.
Freeze the definitions first. Write down the starting event, the ending event, and whether the denominator is a cohort or a calendar period, then leave all three alone for the length of the measurement. A migration between platforms almost always redefines at least one of them, and the resulting step change gets attributed to whatever the team happened to be doing that month.
Split by source from day one, because a blended figure cannot be unblended afterwards. Publish the count beside the percentage. And hold off on conclusions until the denominator can carry one: a rate computed over a few dozen visits is dominated by chance, and one extra conversion on a base of twenty moves the percentage visibly while meaning nothing.
Where a percentage is genuinely wanted from a small population, quote it as the fraction it came from. On an invented example, writing eleven of four hundred rather than 2.75% does the work of a confidence interval at none of the cost, because the reader can see the base.
- Yes: You know whether your comparison figure is a median or a mean
- Yes: You know what event the comparison dataset counted as a conversion
- Yes: The starting and ending events on your own page are written down and frozen
- Yes: The rate is split by traffic source rather than blended
- Yes: The absolute count is published beside the percentage
- Yes: The denominator is large enough that one conversion does not move it visibly
- No: An outbound-fed page is being judged against a published all-industry figure
Reading a published benchmark well

None of this makes published figures worthless. It makes them a different tool from the one people reach for.
A benchmark is useful for exposing an assumption. If a page built around a high-commitment ask converts at 12% while the benchmark you are holding it against was drawn from opt-in pages, something in the definition is worth checking before celebrating, and the likeliest explanation is that the ending event being counted is not the one the benchmark counted. Used that way, an external number is a prompt to go and read your own instrumentation, which is genuinely valuable.
Setting a target from one is unreasonable. A benchmark describes whoever collected it, under denominators they usually do not state, on an audience and an offer that are not yours. Published cold email figures deserve exactly the same reading, and are set out with their sources in cold email conversion benchmarks.
Two habits do the real work here. When you meet a benchmark, find the primary source rather than the roundup citing it, and check what that source discloses about its own method. The Unbounce page names its dataset size, its quarter and its choice of median; the roundups read while checking this article carried none of the three. And when a page's rate disappoints, check what is feeding it before rebuilding it. A landing page converts demand that already exists and has no mechanism for creating any, so if the traffic is thin or unqualified then the page was never the constraint. The site-level version of that question is in lead generation website.
Our own outbound runs one message per campaign, one premise, sent once, and a landing page fits that shape as the destination that lets an interested reader act in their own time. If you would rather measure a real reply volume against your own market than tune a page against somebody else's median, see what a first campaign produces.
Figures in this article come from Unbounce, LanderLab and SeedProd, fetched mid-2026 and re-checked on 2 September 2026, with dated snapshots kept as evidence; each is attributed to the page it appears on. The WordStream, GetResponse and First Page Sage figures reach this article through LanderLab rather than from those three sources directly. RevenueFlow contributes no landing page conversion data of its own to this page. Verify current figures at source before relying on them.
Frequently asked questions.
Frequently asked questions- What is a good landing page conversion rate?
- There is no transferable answer, because the published figures count different events. Unbounce reports a 6.6% median across all industries from Q4 2024 data, WordStream a 2.35% median across Google Ads accounts, GetResponse a 10.76% average on opt-in pages. Judge your own page against itself over time with the definitions frozen, rather than against any external number.
- Why do published landing page benchmarks disagree so much?
- Four independent choices, and a published figure rarely states any of them. Whether the number is a median or a mean, what event counts as a conversion, what type of page is in the dataset, and which traffic sources fed those pages. GetResponse measured opt-in pages and reports the highest figure; that is its definition behaving exactly as expected.
- Should I compare my outbound landing page to a benchmark?
- No. Benchmark datasets are dominated by search, paid and email traffic, where the visitor demonstrated intent by searching, subscribing or clicking a targeted ad before arriving. A cold outbound visitor did not select themselves at all, so the two denominators are different populations and a lower rate on outbound traffic is the expected reading rather than a defect.
- What should I measure instead of the conversion rate?
- The share of submissions that become qualified conversations, and the cost of producing one. That measure resists the optimisations that inflate the headline number, because removing form fields and softening the offer both raise submissions while lowering their quality. Publish the absolute count alongside any percentage so a narrowing audience cannot read as an improvement.
About the author.

Ben Carden is CRO at RevenueFlow, which builds and operates outbound revenue engines for B2B companies. Previously at Gartner Enterprise. Studied at London School of Economics.
Ben Carden · CRO
Connect on LinkedIn →Explore more.
Ready to scale your outreach?
We build GTM engines that book real meetings. See the receipts.
Related articles.
Webflow Pricing: The Four Lines on a Real Bill
Webflow bills a site plan, a workspace plan, seats and metered add-ons. What each line pays for, read from the vendor's own pricing page in September 2026.
5 ABM Campaign Examples and How Each One Is Built
Five worked account-based campaign examples, each built on the same five fields: account set, tier, plays in order, owner and handoff, and the exit condition.
ClickFunnels Pricing: The Meter Is Contacts, Not Traffic
Four published tiers, and visitors are unlimited on every one of them. What ClickFunnels actually meters, and the tier where webhooks and the API appear.
What ClickFunnels Is: A Five Stage Commerce Model
ClickFunnels publishes five named stages rather than a page builder. Two translate to B2B outbound. Three assume a sale that completes on the page.
Field Marketing in B2B: What a Programme Costs Per Meeting
Two different practices answer to the name field marketing. The B2B one runs dinners and roadshows for named accounts, and it divides like any other channel.
Two Agencies, One Target List: Who Owns Which Accounts
Two outbound suppliers on one market will contact the same companies unless the buyer splits it first. How to cut the list, run the exclusion feed and check the overlap.