Sales Enablement Statistics, Traced to Their Sources
The sales enablement figures in circulation, followed to their publishers: which state a population, which are gated, and which are quietly seven years old.
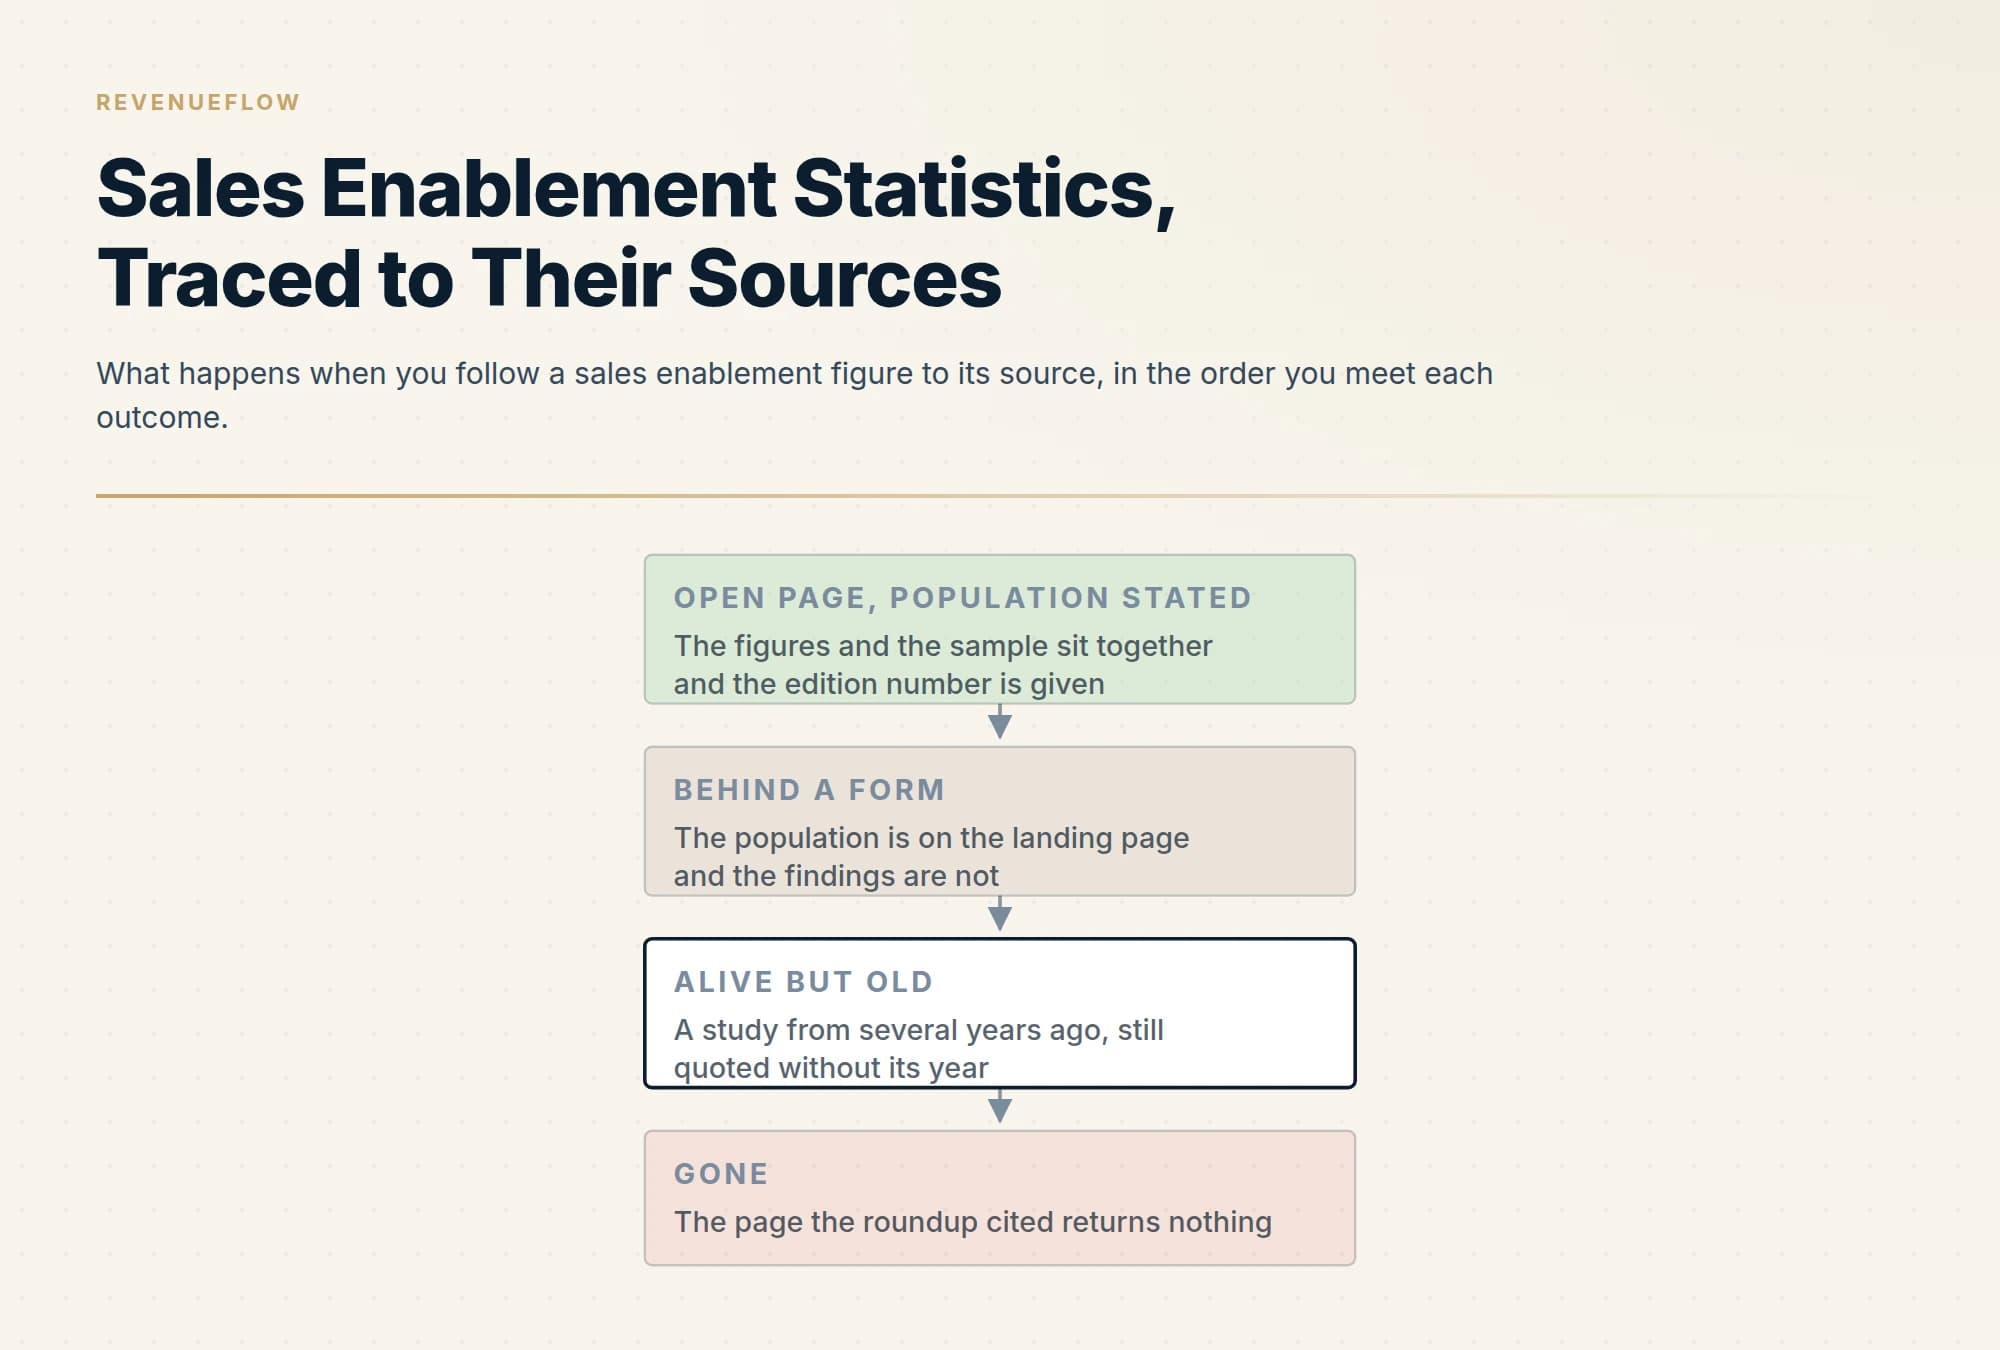
One enablement publisher puts its population, its scope and its figures on an open page, a survey of three hundred and fifty go to market professionals in its eleventh edition. The rest of the category is gated, dated or gone, and a sourced roundup shows a large share of the circulating figures were published in 2019.
Key takeaways
- The roundup that sources every figure reveals, by doing so, that a large share of the sales enablement statistics still circulating were published in 2019, before the category was reorganised twice.
- The one enablement survey that publishes both its population and its findings on an open page draws on three hundred and fifty go to market professionals across twenty one countries in its eleventh edition.
- The best informed roundup author states plainly that most of the research he used had samples between one hundred and five hundred people.
- Several named sources behind widely quoted enablement figures returned a page not found when each was opened, so the figures circulate without anywhere to check them.
Reviewed and updated September 21, 2026
Two pages ranking for this term were read on 21 September 2026. One attaches a source line to every figure it prints. The other attributes its numbers to "recent research" and to "industry research" and names nobody at all. The difference is not tone. The page that cites its sources reveals, by doing so, that a large share of the sales enablement statistics still in circulation were published in 2019.
That is the finding worth having about this literature, and it is only visible from the sourced page. This article follows the figures to whatever produced them, names the ones that carry a population, and says plainly which ones could not be traced. It is the same method our sales statistics page applies to the wider field, aimed at one category the house has not covered.
The one enablement original that publishes both halves
Most research in this space publishes a population or a set of figures, rarely both on a page a reader can open.
Highspot's State of Sales Enablement report is the exception, and it states its scope in a single sentence: "Now in its 11th edition, the State of Sales Enablement Report 2025 draws on insights from 350 go-to-market professionals across enablement, sales, marketing, and operations teams to understand their current business challenges and initiatives." The same paragraph adds the spread: "The study captured diverse perspectives from 21 countries and 61 industries, including technology, financial services, and healthcare."
Three hundred and fifty people, across four functions, in twenty one countries, in an eleventh annual edition. That is a population, a scope and a series, and the figures sit on the open page rather than behind a form. Among them, read on 21 September 2026: "55% of organizations are unable to effectively drive their go-to-market initiatives", "29% of companies still rely on multiple disconnected GTM tools", and "Today, 90% of organizations are either currently using AI to support their go-to-market efforts or are planning to start incorporating it." On the demand side the same page reports that "57% of executives expect their GTM teams to grow this year", and that "Nearly half (47%) of companies today struggle with their customer experience and 41% struggle to engage new buyers."
One qualification travels with all of those, and it is the same one that attaches to every survey in this field. They are statements by people about their own organisations, collected by a company that sells an enablement platform. That does not make them wrong. It makes them evidence about what enablement, sales, marketing and operations professionals report, which is a real and quotable thing, rather than measurements of what is happening inside those companies.
The most honest page on the term is a listicle
The page ranking first for this keyword is a ninety item roundup, and it does something none of the others do. It publishes the list of research it drew on, numbers each entry, and then tells the reader how large those studies were.
Its author writes: "The majority of the research I included used samples of between 100 and 500 people, with only a few having samples in thousands, most notably Salesforce's State of Sales Report." He is describing about twenty named reports, and the sentence is the single most useful thing published about this category. Every confident percentage circulating under the heading sales enablement statistics is, in the main, drawn from studies of a few hundred professionals describing their own organisations.
The same page is candid about who runs that research. Its author notes that going over as many sources as he did, a reader starts to notice a slant in the vendor sponsored research, "towards questions and results that somehow always suggest a solution such as theirs would be a good investment", and says the limited number of independent sources is why vendor sponsored research was included anyway. That is an accurate description of the category and it applies to the figures quoted in the section above as much as to anyone else's.
Following the citations, which is where it falls apart
The list of named reports is the map. Walking it is the test, and the results on 21 September 2026 were these.
Several of the named sources are alive and gated: the landing page states what the research covers and the findings sit behind a form. One of the most cited, a fifth annual sales enablement study published jointly by a research firm and a vendor, serves a page that describes the study and carries no figure and no participant count, and it is dated 2019. A page that does cite its sources properly attributes two of its headline figures to that same 2019 study, including the claim about how sales enablement adoption grew between 2013 and 2019. A seven year old measurement is circulating in 2026 as a current fact, and only a sourced roundup makes that visible.
Others have moved or gone. A vendor report on the value of enablement, named in more than one roundup, returned a page not found for both the plain and the rendered route. A vendor blog post cited for a 2026 statistic returned a blog post not found. The figures those pages produced continue to circulate in roundups that no longer link anywhere useful.
One second hand citation is worth keeping because it carries a population even at one remove: a sourced roundup attributes to a vendor's 2023 value of enablement report the finding that four in five of a twelve hundred person global sample reported using enablement technology daily. The sample size survived the hop, which is unusual, and the original page did not serve, so it is quoted here as a reported figure rather than as a verified one.
Why the age problem is worse here than elsewhere
A statistic ageing badly is a general problem. In this category it is acute, for a reason specific to the subject.
Sales enablement as a function has been reorganised twice in the period those figures cover. The category was renamed toward revenue enablement, the tooling consolidated, and the working assumption about what enablement software does changed with the arrival of generative models. A figure about what share of organisations had an enablement function in 2019 describes a different job under the same name.
That is why the one figure on the open 2025 page worth more than the others is the one about adoption intent: when nine in ten organisations report either using or planning to use artificial intelligence in go to market work, the useful content is not the percentage but the fact that the category's own annual survey now treats it as the organising question. A 2019 study cannot speak to that, and a roundup quoting both in the same list is presenting two eras as one.
What to measure instead of quoting any of it
The reason this matters operationally is that a borrowed enablement statistic is nearly always standing in for a measurement the function could take.
Our guide to sales enablement metrics sets out the three classes of number and argues that only the behavioural one answers the question enablement actually gets asked. The connection to this page is direct: an external percentage about what other organisations report is an activity claim wearing an outcome's clothes, and it licenses nothing about your own programme. Ramp spread against a written competence bar, adherence visible in a consistent monthly sample of recorded calls, and time to answer a real buyer question are measured on your own population, which is the only population that can settle anything about your own programme.
Two practical rules fall out of the reading above. Before quoting a figure, open the page it came from and look for a participant count; if the count is not there, the figure is not quotable. And before comparing two figures, check the study year rather than the article year, because in this category two numbers printed side by side are routinely seven years apart. What the function is for, and the tooling categories that produce each kind of evidence, are covered in sales enablement strategy and sales enablement tools, and the definition itself is in our sales enablement guide.
- Names the research behind each number
- Makes the age of each figure visible
- Lets a reader follow the citation and stop there
- Shows how much of the category is one old study
- Usable as a map even where the figures are not
- Credits figures to industry research and nobody
- Hides how old each number is
- Leaves the reader nothing to follow
- Reads as authoritative because it is confident
- Not quotable at any point
The short version
One enablement publisher puts a population, a scope, an edition number and its figures on an open page, and it is a vendor survey of three hundred and fifty professionals describing their own organisations. One roundup tells you, honestly, that most of the research behind this category used samples between one hundred and five hundred people. Everything else is gated, dated, moved or gone.
So quote the open survey as what it is, check the study year before comparing any two figures, and refuse anything whose source page will not resolve. Then measure your own programme behaviourally, because no percentage about other people's organisations can tell you whether yours landed. If the constraint turns out to be the number of qualified conversations reaching the team rather than what enablement does with them, see what a first campaign produces.
Figures and wording above were read on the publishers' own pages on 21 September 2026, with dated snapshots kept as evidence, and each is attributed to the page it appears on. RevenueFlow sells outbound rather than enablement software and contributes no enablement data of its own here. Verify current figures at source before relying on them.
Frequently asked questions.
Frequently asked questions- Which sales enablement statistics are actually sourced?
- Very few. One vendor's annual survey publishes its population, its country and industry spread, its edition number and its figures on an open page. Beyond that, the named sources behind the circulating figures are mostly gated behind forms, several years old, or no longer resolve at all. A roundup that prints a source line per figure is the fastest way to see which.
- How old are the sales enablement statistics people quote?
- Older than they look. A sourced roundup attributes several of its headline figures to a joint research study published in 2019, including the widely repeated claim about how enablement adoption grew between 2013 and 2019. Those are quoted in 2026 without their year, beside figures from current surveys, as though they described the same period.
- Are vendor sponsored enablement surveys worth reading?
- Yes, quoted as what they are. They are the only recurring research in the category, and the best of them disclose the population, the countries and the edition. The caution is structural rather than about honesty: the publisher sells the remedy the figures imply, so the questions asked tend to be the ones whose answers support the purchase.
- What should an enablement team measure instead?
- Ramp spread against a written competence bar, behavioural adherence visible in a consistent monthly sample of recorded calls, and the time it takes a recent joiner to answer a real buyer question. All three are measured on your own population, which is the only one that can settle whether your own programme landed.
About the author.

Hosun Chung is COO at RevenueFlow, which builds and operates outbound revenue engines for B2B companies. Previously at Gleacher Shacklock LLP. Studied at London School of Economics.
Hosun Chung · COO
Connect on LinkedIn →Explore more.
Ready to scale your outreach?
We build GTM engines that book real meetings. See the receipts.
Related articles.
Sales Training Statistics, Traced to Their Sources
Every circulating sales training figure followed to whatever produced it, from a named survey of seventy one professionals to an 1885 memory experiment.
B2B Marketing Conversion Rates: Who Published What
Every published B2B conversion benchmark, by channel and by stage, with the publisher, the population, the method and the date beside each figure.
Real Estate Cold Email Reply Rate Benchmarks (2026)
No vendor publishes a real estate cold email benchmark. Here are the published reply-rate tiers that do apply, and how to read your own results.
Legal Services Cold Email Reply Rate Benchmarks (2026)
Cross-industry cold email reply rates average 3.43%. Here is what good looks like when your list is law firms, plus the levers with real data behind them.
Cold Email Conversion Benchmarks: 2026 Performance Data
Complete benchmark data for cold email conversion rates from reply to meeting to opportunity. Learn what drives conversions and how to optimize your full funnel.
Education Cold Email Benchmarks: 2026 Performance Data
Industry benchmark data for education cold email campaigns, including open rates, reply rates, and conversion metrics for companies targeting K-12 schools, higher education, and corporate training organizations.