Mid-Market Cold Email Benchmarks: 2026 Performance Data
Industry data shows mid-market cold emails achieve 4-8% reply rates with optimal balance of deal size and sales velocity. Discover the benchmarks for reaching mid-market decision-makers.
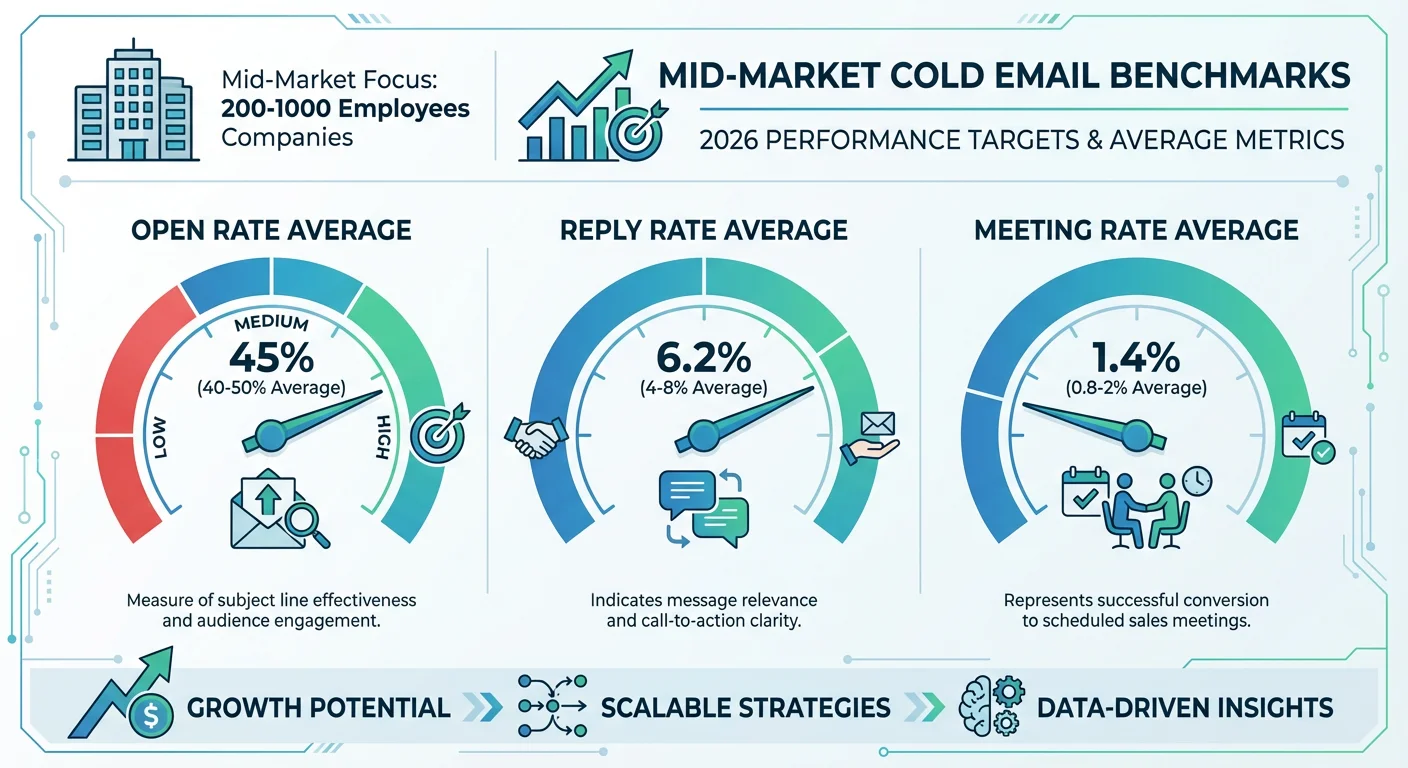
Mid-market cold email campaigns (targeting companies with 200-1000 employees) typically achieve 4-8% reply rates with 40-50% open rates. Optimal sequences are 6-7 emails long, and multi-threading to 3-4 contacts increases meeting rates by 60-80%. Email-to-meeting conversion ranges from 0.8-2%, with sales cycles of 45-120 days depending on deal size.
Key takeaways
- Mid-market companies (200-1000 employees) generate reply rates of 4-8%, positioned between SMB and enterprise performance.
- Smaller mid-market companies (200-350 employees) show the highest engagement with 45-55% open rates and 5-9% reply rates.
- Multi-threading to 3-4 contacts increases meeting rates by 60-80% compared to single-contact outreach.
- The optimal mid-market sequence length is 6-7 emails, producing reply rates of 8-14%.
- Mid-market email-to-meeting conversion ranges from 0.8-2%, with sales cycles typically lasting 45-120 days based on deal size.
Reviewed and updated September 15, 2026
Mid-Market Cold Email Benchmarks: 2026 Performance Data
Mid-market companies (typically 200-1000 employees) represent the sweet spot for many B2B cold email campaigns. They offer larger deal sizes than SMB without the lengthy sales cycles and complex buying committees of enterprise accounts. Industry data shows mid-market campaigns typically achieve 4-8% reply rates with deal values 3-10x higher than SMB.
This benchmark report covers the specific performance metrics for cold email campaigns targeting mid-market companies.
About This Data
The benchmarks presented in this report are compiled from publicly available industry research, aggregated data from sales engagement platforms, and typical ranges observed across B2B cold email campaigns targeting mid-market companies. These figures represent industry estimates and general ranges rather than definitive standards. Your actual results will vary based on your specific offering, target industry, and execution quality.
We recommend using these benchmarks as directional guidance while establishing your own mid-market-specific baselines.
Mid-Market Overview
Understanding mid-market characteristics helps contextualize performance benchmarks.
Mid-Market Definition
| Metric | Typical Range |
|---|---|
| Employee count | 200-1000 |
| Annual revenue | $20M - $500M |
| Department structure | Established, specialized |
| Buying process | Formal but manageable |
| Decision-makers | Multiple, accessible |
Mid-Market Email Characteristics
| Characteristic | Mid-Market Pattern |
|---|---|
| Decision-maker accessibility | Medium |
| Inbox competition | Medium-High |
| Response speed | Moderate |
| Evaluation process | Semi-formal |
| Budget availability | Good |
| Vendor evaluation rigor | Medium |
Mid-Market Open Rate Benchmarks
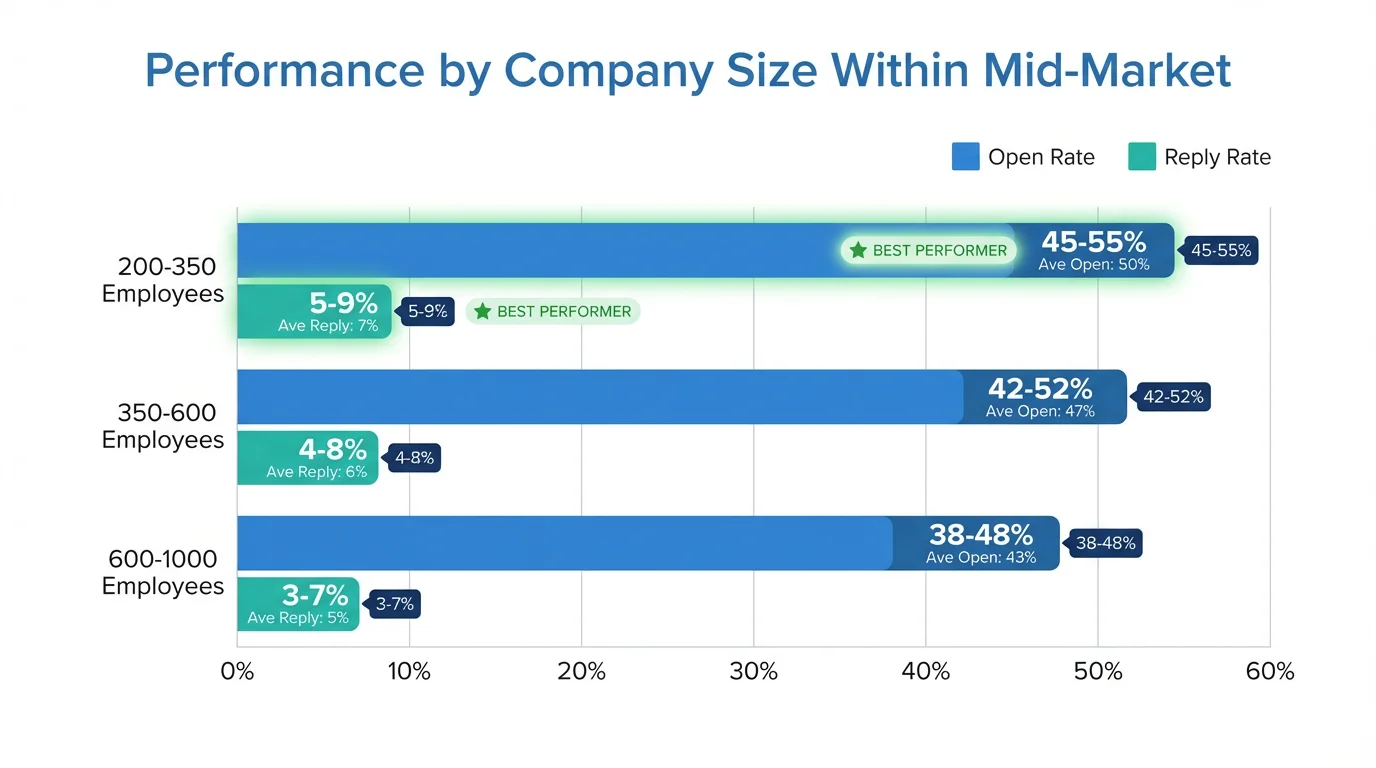
Mid-market targets show moderate to good email engagement.
Open Rates by Company Size (Within Mid-Market)
| Employee Range | Typical Open Rate | Notes |
|---|---|---|
| 200-350 | 45% - 55% | Higher engagement |
| 350-600 | 42% - 52% | Moderate |
| 600-1000 | 38% - 48% | More enterprise-like |
Open Rates by Industry
| Industry | Mid-Market Open Rate |
|---|---|
| Technology | 40% - 50% |
| Healthcare | 38% - 48% |
| Financial Services | 36% - 46% |
| Manufacturing | 42% - 52% |
| Professional Services | 45% - 55% |
| Retail | 40% - 50% |
| Education | 43% - 53% |
Open Rates by Role
| Role | Open Rate |
|---|---|
| C-Suite | 35% - 45% |
| VP | 40% - 50% |
| Director | 45% - 55% |
| Manager | 48% - 58% |
| Senior Individual Contributor | 50% - 60% |
Mid-Market Reply Rate Benchmarks
Mid-market reply rates fall between SMB and enterprise levels.
Reply Rates by Company Size
| Employee Range | Typical Reply Rate |
|---|---|
| 200-350 | 5% - 9% |
| 350-600 | 4% - 8% |
| 600-1000 | 3% - 7% |
Reply Rates by Role
| Role | Reply Rate | Decision Authority |
|---|---|---|
| C-Suite | 3% - 6% | Final approval |
| VP | 4% - 8% | Strong influence |
| Director | 5% - 9% | Department decisions |
| Manager | 5% - 8% | Evaluation/recommendation |
Reply Rates by Industry
| Industry | Mid-Market Reply Rate |
|---|---|
| Professional Services | 6% - 10% |
| Technology | 4% - 8% |
| Healthcare | 4% - 7% |
| Financial Services | 3% - 7% |
| Manufacturing | 4% - 8% |
| Education | 5% - 9% |
Mid-Market Conversion Benchmarks
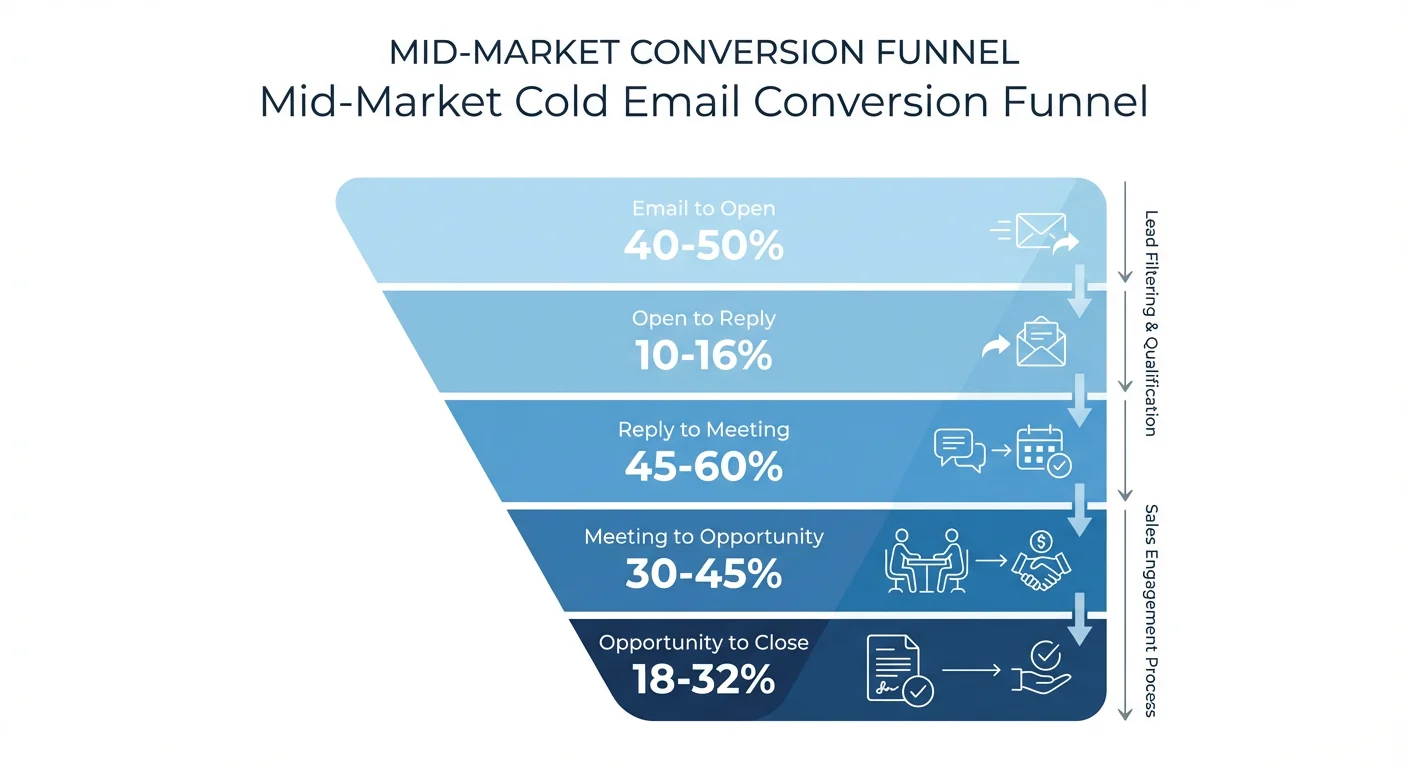
Mid-market conversion rates reflect more structured buying processes.
Full Funnel Conversion
| Stage | Mid-Market Rate |
|---|---|
| Email to open | 40% - 50% |
| Open to reply | 10% - 16% |
| Reply to meeting | 45% - 60% |
| Meeting to opportunity | 30% - 45% |
| Opportunity to close | 18% - 32% |
Meeting Conversion Benchmarks
| Metric | Mid-Market Benchmark |
|---|---|
| Email to meeting | 0.8% - 2% |
| Replies to meeting | 45% - 55% |
| Meetings per 1000 emails | 8 - 20 |
Sales Cycle Length
| Deal Size | Typical Cycle |
|---|---|
| Under $25K | 30-60 days |
| $25K - $75K | 45-90 days |
| $75K - $150K | 60-120 days |
| Over $150K | 90-180 days |
Multi-Threaded Outreach Benchmarks
Mid-market accounts often benefit from contacting multiple stakeholders.
Multi-Threading Impact
| Approach | Meeting Rate | Notes |
|---|---|---|
| Single contact | 0.8% - 1.5% | Baseline |
| 2 contacts | 1.2% - 2.2% | +40-50% |
| 3-4 contacts | 1.5% - 2.8% | +60-80% |
| 5+ contacts | 1.8% - 3.2% | +80-100% |
Optimal Contact Mix
| Role | Include in Sequence |
|---|---|
| Primary decision-maker | Always |
| Budget holder | When different from above |
| End user/champion | Strong advocate potential |
| Technical evaluator | For technical products |
| Procurement | Later in process |
Multi-Thread Sequence Structure
| Week | Contact Strategy |
|---|---|
| Week 1 | Primary contact, emails 1-2 |
| Week 2 | Add secondary contact, continue primary |
| Week 3 | Add third contact if no response |
| Week 4 | Continue all threads, reference others |
Mid-Market Sequence Benchmarks
Optimal sequences for mid-market differ from SMB and enterprise.
- Day 0Value prop, research-based
Email 1
- Day 3-4Case study, social proof
Email 2
- Day 7-8Different angle
Email 3
- Day 12-14Insight or resource
Email 4
- Day 18-21Question-based
Email 5
- Day 28-35Breakup
Email 6
Sequence Length Performance
| Length | Reply Rate | Notes |
|---|---|---|
| 4 emails | 6% - 10% | Minimum |
| 5 emails | 7% - 12% | Good |
| 6 emails | 8% - 13% | Optimal |
| 7 emails | 8% - 14% | Near maximum |
| 8+ emails | 9% - 15% | Diminishing returns |
Optimal Mid-Market Sequence
| Timing | Approach | |
|---|---|---|
| Email 1 | Day 0 | Value prop, research-based |
| Email 2 | Day 3-4 | Case study, social proof |
| Email 3 | Day 7-8 | Different angle |
| Email 4 | Day 12-14 | Insight or resource |
| Email 5 | Day 18-21 | Question-based |
| Email 6 | Day 28-35 | Breakup |
Reply Distribution
| Position | Share of Replies |
|---|---|
| Email 1 | 28% - 38% |
| Email 2 | 20% - 28% |
| Email 3 | 14% - 20% |
| Email 4 | 10% - 16% |
| Email 5 | 8% - 12% |
| Email 6 | 5% - 10% |
Mid-Market Timing Benchmarks
Optimal timing for mid-market audiences.
Best Days
| Day | Performance |
|---|---|
| Tuesday | Highest |
| Wednesday | High |
| Thursday | High |
| Monday | Medium |
| Friday | Medium-Low |
Best Times
| Time Window | Performance |
|---|---|
| 8-10 AM | Highest |
| 10-12 PM | High |
| 2-4 PM | Medium |
| 4-6 PM | Medium-Low |
Timezone Considerations
| Strategy | Impact |
|---|---|
| Single timezone send | Baseline |
| Timezone-optimized | +15% - 25% improvement |
Mid-Market Messaging Benchmarks
Messaging that resonates with mid-market decision-makers.
Effective Value Propositions
| Value Prop Type | Reply Rate Impact |
|---|---|
| ROI/efficiency gains | +25% - 40% |
| Competitive advantage | +20% - 35% |
| Risk reduction | +15% - 30% |
| Scalability | +20% - 35% |
| Innovation enablement | +15% - 30% |
Subject Line Performance
| Type | Open Rate |
|---|---|
| Personalized (company/name) | 48% - 60% |
| Question-based | 45% - 55% |
| Peer reference | 50% - 62% |
| Challenge-focused | 42% - 52% |
| Generic | 30% - 40% |
Email Length
| Length | Reply Rate |
|---|---|
| 50-75 words | 5% - 8% |
| 75-100 words | 5% - 9% |
| 100-125 words | 4% - 8% |
| 125-150 words | 3% - 6% |
Mid-market emails can be slightly longer than SMB to accommodate more context.
Mid-Market Personalization Benchmarks
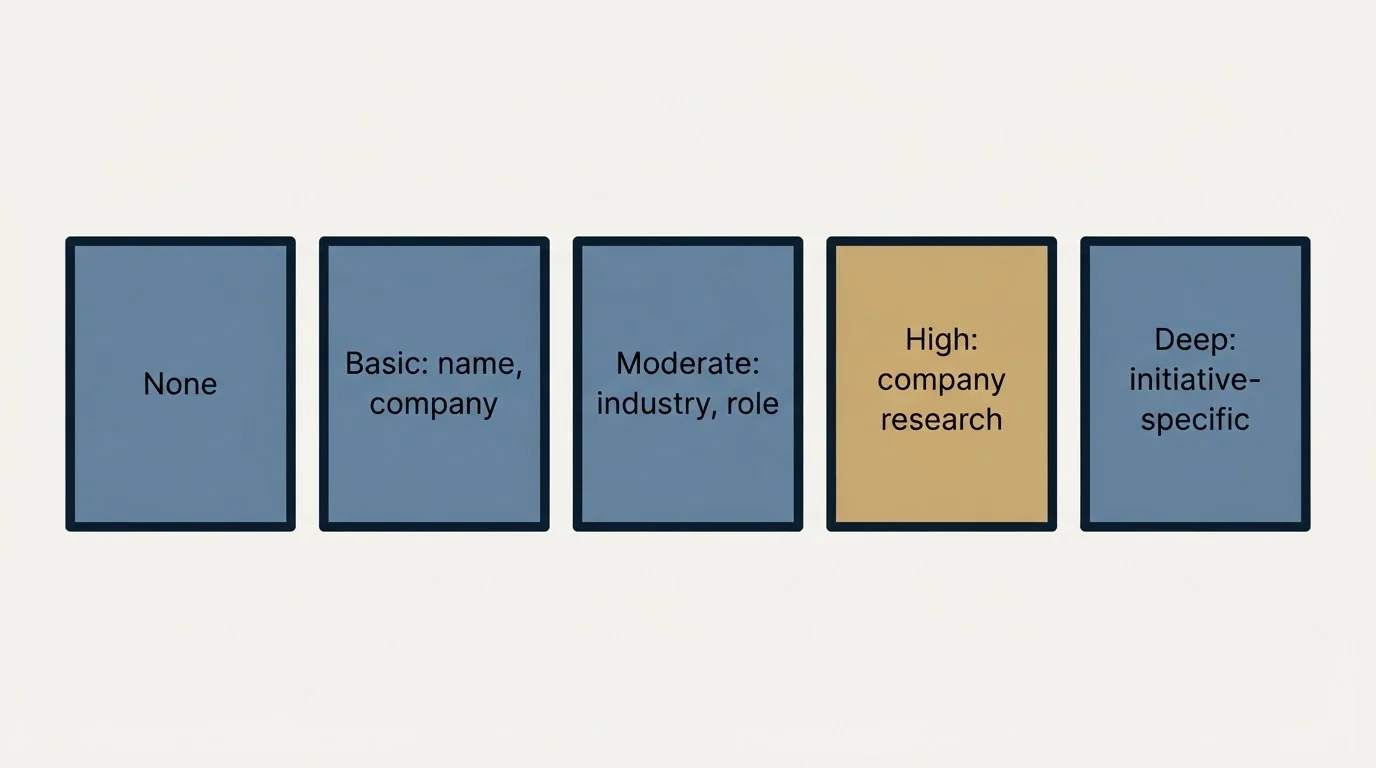
Personalization impact on mid-market campaigns.
Personalization Level Impact
| Level | Reply Rate |
|---|---|
| None | 2% - 4% |
| Basic (name, company) | 3% - 5% |
| Moderate (industry, role) | 5% - 8% |
| High (company research) | 7% - 11% |
| Deep (initiative-specific) | 9% - 15% |
High-Impact Personalization Elements
| Element | Reply Rate Lift |
|---|---|
| Company initiative reference | +50% - 80% |
| Recent news/trigger | +40% - 60% |
| Mutual connection | +60% - 100% |
| Technology stack mention | +30% - 50% |
| Competitive context | +35% - 55% |
Mid-Market ROI Benchmarks
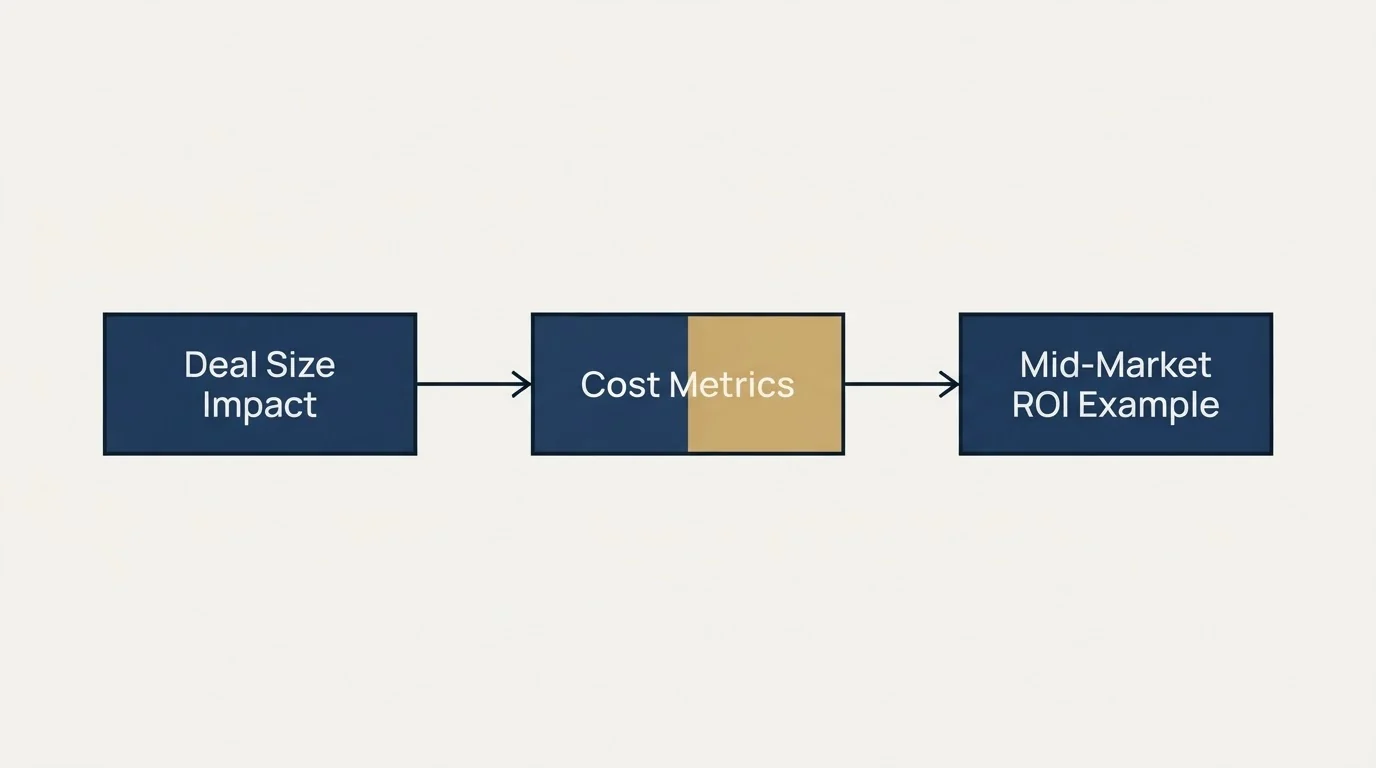
Understanding mid-market-specific ROI characteristics.
Cost Metrics
| Metric | Benchmark |
|---|---|
| Cost per email | $0.15 - $0.50 |
| Cost per reply | $20 - $80 |
| Cost per meeting | $150 - $500 |
| Cost per opportunity | $500 - $2000 |
| Customer acquisition cost | $2000 - $8000 |
Deal Size Impact
| Average Deal | Typical Close Rate | Time to Close |
|---|---|---|
| $25K - $50K | 22% - 35% | 45-75 days |
| $50K - $100K | 18% - 30% | 60-100 days |
| $100K - $200K | 15% - 25% | 90-150 days |
| Over $200K | 12% - 22% | 120-180 days |
Mid-Market ROI Example
| Metric | Value |
|---|---|
| Emails sent | 3,000 |
| Cost per email | $0.25 |
| Total cost | $750 |
| Meetings booked | 24 (0.8%) |
| Deals closed | 5 (21%) |
| Average deal | $60,000 |
| Revenue | $300,000 |
| ROI | 399x |
Mid-market ROI can be exceptional due to larger deal sizes relative to cost.
Multi-Channel Mid-Market Benchmarks
Multi-channel approaches are particularly effective for mid-market.
Channel Combination Performance
| Channels | Reply Rate | Notes |
|---|---|---|
| Email only | 4% - 8% | Baseline |
| Email + LinkedIn | 6% - 12% | Strong improvement |
| Email + LinkedIn + Phone | 8% - 15% | Maximum impact |
LinkedIn Integration Benchmarks
| Activity | Impact |
|---|---|
| Profile view before email | +10% - 20% open rate |
| Connection request | +15% - 25% reply rate |
| LinkedIn message + email | +25% - 40% total response |
Mid-Market Challenges and Considerations
Common Challenges
| Challenge | Mitigation |
|---|---|
| Multiple stakeholders | Multi-thread approach |
| Longer evaluation | Patience, value drip |
| More formal process | Prepare for RFP/security review |
| Budget cycles | Time outreach appropriately |
| Competition | Differentiation focus |
Buying Committee Dynamics
| Role | Key Concern | Messaging Focus |
|---|---|---|
| Economic buyer | ROI, budget | Business case |
| Technical evaluator | Capabilities | Features, integration |
| End user | Usability | Experience, support |
| Champion | Success | Partnership, results |
| Procurement | Terms, risk | Compliance, pricing |
Best Practices for Mid-Market
Strategic Approaches
| Strategy | Implementation |
|---|---|
| Account-based mindset | Research before outreach |
| Multi-threading | Contact 2-4 stakeholders |
| Value-first messaging | Lead with insights |
| Patient follow-up | Longer sequences |
| Multi-channel | Add LinkedIn, phone |
Avoiding Pitfalls
| Pitfall | Prevention |
|---|---|
| Treating like SMB | Adapt for complexity |
| Treating like enterprise | Move faster |
| Single-threaded only | Multi-thread accounts |
| Generic messaging | Research and personalize |
| Impatience | Allow for longer cycles |
Setting Mid-Market Goals
Based on industry benchmarks, here are realistic targets:
| Metric | Conservative | Ambitious |
|---|---|---|
| Open rate | 40% | 50%+ |
| Reply rate | 4% | 8%+ |
| Meeting rate | 0.8% | 1.8%+ |
| Close rate | 18% | 28%+ |
| ROI | 50x | 150x+ |
Optimizing Mid-Market Performance
Mid-market represents an ideal balance of deal size, accessibility, and sales cycle efficiency. Success requires adapting your approach to the semi-formal buying processes while maintaining the personalization and persistence that drives cold email success.
If you want to improve your mid-market cold email performance or need help building campaigns for this segment, our team specializes in creating effective outreach programs for B2B companies.
Get a free campaign audit and see how your current mid-market performance compares to industry benchmarks. We will identify specific opportunities to improve your targeting, multi-threading, and conversion rates.
Related Reading
Frequently asked questions.
Frequently asked questions- What reply rate should I expect from mid-market cold email campaigns?
- Mid-market cold email campaigns typically achieve 4-8% reply rates. Within this segment, smaller companies (200-350 employees) perform best at 5-9%, while larger mid-market organizations (600-1000 employees) typically see 3-7% reply rates. Professional services shows the highest industry reply rate at 6-10%, while financial services tends lower at 3-7%.
- How many emails should I send in a mid-market cold email sequence?
- The optimal mid-market sequence length is 6-7 emails, producing reply rates of 8-14%. While 4-email sequences achieve 6-10% reply rates, they underperform the optimal range. Sequences of 8+ emails show diminishing returns despite reaching 9-15% reply rates. The 6-7 email range balances engagement effectiveness with resource efficiency.
- Does contacting multiple people at mid-market companies improve results?
- Multi-threading significantly improves mid-market outcomes. Contacting 3-4 people increases meeting rates by 60-80% compared to single-contact outreach. Two contacts improve results by 40-50%, while 5+ contacts deliver 80-100% improvement. The recommended approach is starting with a primary decision-maker, adding a secondary contact in week two, and a third contact by week three if there's no response.
- What's the typical sales cycle length for mid-market deals?
- Mid-market sales cycles range from 30-180 days based on deal size. Deals under $25K typically close in 30-60 days, $25K-$75K deals take 45-90 days, $75K-$150K deals require 60-120 days, and deals over $150K extend to 90-180 days. This reflects mid-market companies' semi-formal evaluation processes and established department structures.
- What email-to-meeting conversion rate is realistic for mid-market?
- Mid-market campaigns typically convert 0.8-2% of emails to meetings, translating to 8-20 meetings per 1,000 emails sent. Of replies received, 45-55% convert to meetings. This is part of a longer funnel where 40-50% of emails are opened, 10-16% of opens generate replies, and 30-45% of meetings become opportunities.
About the author.

Hosun Chung is COO at RevenueFlow, which builds and operates outbound revenue engines for B2B companies. Previously at Gleacher Shacklock LLP. Studied at London School of Economics.
Hosun Chung · COO
Connect on LinkedIn →Explore more.
Ready to scale your outreach?
We build GTM engines that book real meetings. See the receipts.
Related articles.
Cold Email Spam Rate Benchmarks: 2026 Performance Data
Industry standards require keeping spam complaint rates below 0.1% to maintain sender reputation. Learn the benchmarks and strategies to protect your cold email deliverability.
Cold Email Follow-Up Benchmarks: 2026 Performance Data
The follow-up benchmarks kept intact and read against their own definitions, plus why RevenueFlow sends one message per campaign instead.
Cold Email Bounce Rate Benchmarks: 2026 Performance Data
A 3.04% platform bounce rate held 1.27% true hard bounces, 2.38% with blocks included, and 12.6% delay notices. What low bounce email data is made of.
Cold Email Subject Line Benchmarks: 2026 Performance Data
Industry data reveals that subject lines determine 35-50% of open rate variation. Discover the benchmarks for length, personalization, and format that drive the highest engagement.
Cold Email Personalization Benchmarks: 2026 Performance Data
LeadMagic, Cognism, Explorium and others sell funding and competitor signals. What published data ties to higher reply rates, and how to turn a signal into a line.
Cold Email Sequence Benchmarks: 2026 Performance Data
Every industry sequence figure, kept intact and read honestly: the opening message produces 30-40% of replies, and here is what the rest of them cost.