Nonprofit Cold Email Benchmarks: 2026 Performance Data
Industry benchmark data for nonprofit cold email campaigns, including open rates, reply rates, and conversion metrics for companies targeting foundations, charitable organizations, and NGOs.
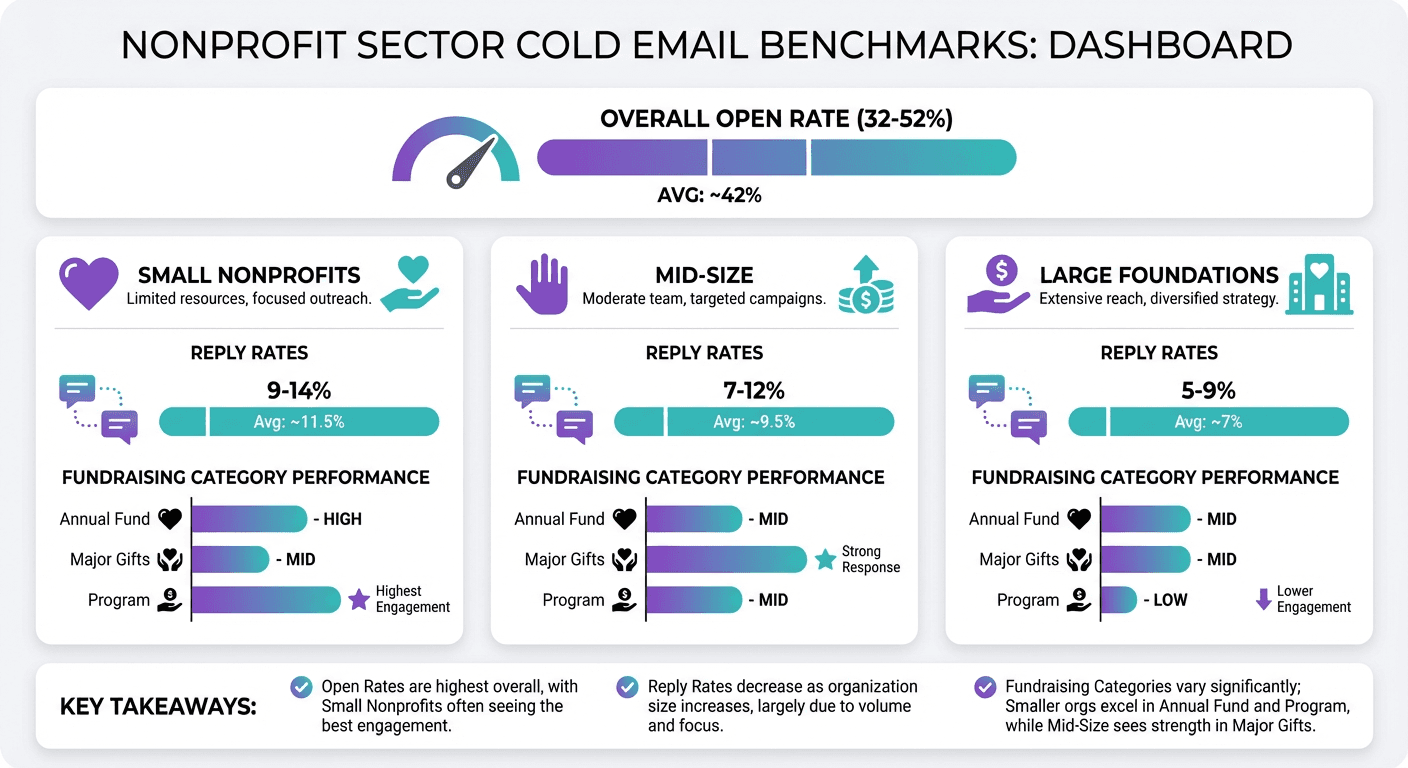
Nonprofit cold email benchmarks for 2026 show average open rates of 32-42%, reply rates of 2-3.5%, positive reply rates of 1-2%, and meeting booking rates of 0.6-1.5%. Small nonprofits (under $1M budget) perform significantly better than larger organizations, with open rates reaching 48-62% and meeting rates of 2-4%. Fundraising and donor management solutions achieve the highest engagement at 45-58% open rates and 1.8-3.5% meeting rates because they directly enable mission revenue.
Key takeaways
- Small nonprofits with budgets under $1M show open rates of 48-62% and meeting rates of 2-4%, significantly outperforming larger organizations due to executive directors managing their own email without gatekeeping.
- Fundraising and donor management solutions achieve the strongest nonprofit engagement with open rates of 45-58% and meeting booking rates of 1.8-3.5% because donor revenue directly enables mission work.
- Average nonprofit cold email performance includes open rates of 32-42%, reply rates of 2-3.5%, positive reply rates of 1-2%, and meeting booking rates of 0.6-1.5%.
- Executive directors at smaller organizations deliver the highest engagement with open rates of 45-58%, reply rates of 4.5-7%, and meeting booking rates of 1.8-3.5% because they make purchasing decisions directly.
- Major foundations with budgets over $50M show the lowest engagement at 32-45% open rates and 0.7-1.5% meeting rates due to formal procurement processes and gatekeeping.
Reviewed and updated August 28, 2026
The nonprofit sector presents unique opportunities and challenges for B2B companies selling technology, services, and solutions to foundations, charitable organizations, and NGOs. While nonprofits operate under resource constraints, they increasingly recognize the need for technology to improve operational efficiency and mission impact.
This benchmark report provides nonprofit-specific data to help companies evaluate their cold email performance when targeting nonprofit organizations. The metrics represent typical performance ranges observed across companies selling into the nonprofit vertical.
Methodology Note
Nonprofits encompass diverse segments from small community organizations to major national foundations to international NGOs. The benchmarks in this report are compiled from industry research and commonly observed performance ranges. Your results will vary based on your target segment, product type, and the specific subsector you are addressing.
Key Nonprofit Cold Email Metrics
Nonprofit professionals balance mission focus with operational efficiency. They are often receptive to solutions that help them do more with limited resources, but budget constraints and procurement processes can affect engagement patterns.
Average
Average
Average
Average
Bar widths are equal here because these stage values are not a single comparable measure.
Open Rates
Open rates in the nonprofit sector tend to be moderate to strong, with significant variation based on organization size and subsector.
Nonprofit Industry Benchmarks:
- Below average: Under 32%
- Average: 32-42%
- Good: 42-52%
- Excellent: 52%+
By Organization Type:
| Organization Type | Typical Open Rate Range |
|---|---|
| Small Nonprofits (under $1M budget) | 48-62% |
| Mid-Size Nonprofits ($1-10M budget) | 42-55% |
| Large Nonprofits ($10-50M budget) | 38-50% |
| Major Foundations ($50M+ budget) | 32-45% |
| Healthcare Nonprofits | 35-48% |
| Educational Nonprofits | 38-50% |
| International NGOs | 35-48% |
Smaller nonprofits show higher open rates because executive directors often manage their own email without gatekeeping.
Reply Rates
Nonprofit professionals are generally mission-driven and appreciate solutions that support their work, though resource constraints can affect response patterns.
Nonprofit Industry Benchmarks:
- Below average: Under 2%
- Average: 2-3.5%
- Good: 3.5-5.5%
- Excellent: 5.5%+
By Organization Type:
| Organization Type | Typical Reply Rate Range |
|---|---|
| Small Nonprofits | 4.5-7.5% |
| Mid-Size Nonprofits | 3.5-5.5% |
| Large Nonprofits | 2.5-4.5% |
| Major Foundations | 2-3.5% |
| Healthcare Nonprofits | 2.5-4% |
| Educational Nonprofits | 3-5% |
| International NGOs | 2.5-4% |
Positive Reply Rates
Nonprofit buyers often request pricing information, nonprofit discount details, or case studies from similar organizations before committing to meetings.
Nonprofit Industry Benchmarks:
- Below average: Under 1%
- Average: 1-2%
- Good: 2-3.5%
- Excellent: 3.5%+
Meeting Booking Rates
Converting nonprofit interest to scheduled meetings may take longer due to volunteer board involvement and committee-based decision-making.
Nonprofit Industry Benchmarks:
- Below average: Under 0.6%
- Average: 0.6-1.5%
- Good: 1.5-2.5%
- Excellent: 2.5%+
By Organization Type:
| Organization Type | Typical Meeting Rate Range |
|---|---|
| Small Nonprofits | 2-4% |
| Mid-Size Nonprofits | 1.5-3% |
| Large Nonprofits | 1-2% |
| Major Foundations | 0.7-1.5% |
| Healthcare Nonprofits | 0.8-1.8% |
| Educational Nonprofits | 1-2.2% |
| International NGOs | 0.8-1.8% |
Benchmarks by Nonprofit Product Category
Performance varies significantly based on the type of solution you are selling to nonprofit organizations.
Fundraising and Donor Management
CRM, donor databases, and fundraising platforms.
Typical Performance Ranges:
- Open rates: 45-58%
- Reply rates: 4.5-7%
- Positive reply rates: 2.2-4.5%
- Meeting booking rates: 1.8-3.5%
Fundraising solutions see the strongest engagement because donor revenue directly enables mission work.
Nonprofit Accounting and Finance
Fund accounting, grant management, and financial systems.
Typical Performance Ranges:
- Open rates: 40-52%
- Reply rates: 3.5-5.5%
- Positive reply rates: 1.8-3.5%
- Meeting booking rates: 1.2-2.5%
Marketing and Communications
Email marketing, website platforms, and donor communications.
Typical Performance Ranges:
- Open rates: 45-58%
- Reply rates: 4-6.5%
- Positive reply rates: 2-4%
- Meeting booking rates: 1.5-3%
Program Management and Impact
Program delivery, case management, and impact measurement.
Typical Performance Ranges:
- Open rates: 42-55%
- Reply rates: 3.5-5.5%
- Positive reply rates: 1.8-3.5%
- Meeting booking rates: 1.2-2.5%
Volunteer Management
Volunteer coordination, scheduling, and engagement platforms.
Typical Performance Ranges:
- Open rates: 45-58%
- Reply rates: 4-6.5%
- Positive reply rates: 2-4%
- Meeting booking rates: 1.5-3%
Membership and Association Management
Member databases, event management, and association platforms.
Typical Performance Ranges:
- Open rates: 42-55%
- Reply rates: 3.5-5.5%
- Positive reply rates: 1.8-3.5%
- Meeting booking rates: 1.2-2.5%
Advocacy and Grassroots
Advocacy platforms, grassroots organizing, and civic engagement tools.
Typical Performance Ranges:
- Open rates: 42-55%
- Reply rates: 4-6%
- Positive reply rates: 2-4%
- Meeting booking rates: 1.3-2.6%
Benchmarks by Target Persona
Nonprofit organizations involve various decision-makers with different responsibilities.
Executive Directors and CEOs
Typical Performance Ranges:
- Open rates: 45-58%
- Reply rates: 4.5-7%
- Positive reply rates: 2.2-4.5%
- Meeting booking rates: 1.8-3.5%
Executive directors at smaller organizations are highly accessible and often make purchasing decisions directly.
Development Directors and Fundraising Leadership
Typical Performance Ranges:
- Open rates: 48-62%
- Reply rates: 5-8%
- Positive reply rates: 2.5-5%
- Meeting booking rates: 2-4%
Fundraising leaders are particularly receptive to solutions impacting donor engagement and revenue.
Program Directors
Typical Performance Ranges:
- Open rates: 42-55%
- Reply rates: 3.5-5.5%
- Positive reply rates: 1.8-3.5%
- Meeting booking rates: 1.2-2.5%
Program directors evaluate solutions for mission delivery impact.
Finance Directors and CFOs
Typical Performance Ranges:
- Open rates: 38-50%
- Reply rates: 3-5%
- Positive reply rates: 1.5-3%
- Meeting booking rates: 1-2%
Finance leaders focus on cost-effectiveness and compliance requirements.
Marketing and Communications Directors
Typical Performance Ranges:
- Open rates: 45-58%
- Reply rates: 4.5-7%
- Positive reply rates: 2.2-4.5%
- Meeting booking rates: 1.8-3.5%
Operations and IT
Typical Performance Ranges:
- Open rates: 38-50%
- Reply rates: 3-5%
- Positive reply rates: 1.5-3%
- Meeting booking rates: 1-2%
Operations roles are more common at larger organizations.
Nonprofit Subsector Variations
Performance varies by nonprofit subsector based on technology adoption and funding patterns.
Subsector Performance Ranges
| Subsector | Open Rate Range | Reply Rate Range |
|---|---|---|
| Human Services | 42-55% | 3.5-5.5% |
| Education | 40-52% | 3.5-5.5% |
| Healthcare | 35-48% | 2.5-4% |
| Arts and Culture | 45-58% | 4-6.5% |
| Environmental | 42-55% | 4-6% |
| Religious Organizations | 45-58% | 4.5-7% |
| Advocacy and Policy | 42-55% | 4-6% |
| International/Global | 38-50% | 3-5% |
| Community Foundations | 40-52% | 3.5-5.5% |
| Youth Development | 45-58% | 4-6.5% |
Arts, religious organizations, and youth-serving nonprofits often show stronger engagement due to the relationship-oriented nature of these subsectors.
Budget Cycle Considerations
Nonprofit purchasing follows distinct patterns tied to fiscal years and funding cycles.
Fiscal Year Timing
Calendar Year Fiscal (January-December):
- Budget planning: October-November
- New budget spending: January-March
- Year-end purchases: October-December
July Fiscal Year (common for educational nonprofits):
- Budget planning: April-May
- New budget spending: July-September
- Year-end purchases: April-June
Grant Cycle Impact
Many nonprofit purchases are grant-funded:
- Federal grant cycles often align with October fiscal year
- Foundation giving decisions typically occur in Q4 or Q1
- Capital campaigns may create one-time purchasing opportunities
Seasonal Patterns
High Engagement Periods:
- January-February: New year initiatives and budget deployment
- September-October: Fall planning and year-end preparation
- Post-successful fundraising campaigns
Lower Engagement Periods:
- November-December: Donor-focused, year-end giving push
- Summer months: Reduced staffing at some organizations
- Around major program delivery periods
What Top Performers Do Differently

Companies achieving top-quartile performance in nonprofit cold email share common characteristics.
Mission Alignment and Understanding
Top performers demonstrate genuine understanding of nonprofit missions and sector-specific challenges. Generic B2B messaging significantly underperforms.
Nonprofit Pricing and Value Messaging
Successful campaigns proactively address nonprofit pricing, discounts, and ROI in resource-constrained environments.
Peer Organization References
Nonprofits heavily rely on peer recommendations. References to similar organizations (by size, subsector, or geography) strengthen engagement.
Impact and Outcome Focus
Rather than feature-focused messaging, top performers emphasize impact on mission delivery and organizational effectiveness.
Patience for Longer Cycles
Nonprofit purchasing often involves board approval, committee review, and grant alignment. Top performers build relationships over time.
- Yes: Mission Alignment and Understanding
- Yes: Nonprofit Pricing and Value Messaging
- Yes: Peer Organization References
- Yes: Impact and Outcome Focus
- Yes: Patience for Longer Cycles
Improving Your Nonprofit Cold Email Performance
If your metrics fall below these benchmarks, focus on these high-impact areas.
For Below-Average Open Rates
Subject Line Optimization for Nonprofits:
- Reference specific nonprofit challenges or subsector issues
- Use mission-oriented language
- Mention nonprofit-specific benefits or pricing
- Avoid overly commercial or sales-focused language
List Quality Considerations:
- Nonprofit staff turnover can be high
- Verify current role and organization
- Segment by budget size, subsector, and mission area
- Consider board and volunteer leader contacts where appropriate
For Below-Average Reply Rates
Messaging Adjustments:
- Lead with mission impact and organizational effectiveness
- Clearly communicate nonprofit pricing or discounts
- Reference similar organization success stories
- Keep messages mission-aligned and respectful of constraints
Targeting Refinements:
- Segment by budget size and subsector
- Target organizations showing growth or capacity-building initiatives
- Consider grant and funding cycle timing
- Align with sector events and trends
For Below-Average Meeting Rates
Response Handling:
- Provide nonprofit pricing information readily
- Offer flexible meeting formats and demonstrations
- Provide case studies from similar organizations
- Be prepared for committee or board involvement
When Silence Is A Timing Signal:
- Nonprofit professionals are busy with mission work, so no reply usually means the calendar is wrong rather than the offer
- Note the sector development or funding opportunity that changes their priorities
- Reach them again in a separate campaign built on that opportunity, not as a second message under the first
Nonprofit Pricing Strategies
Addressing pricing is critical in nonprofit sales.
Common Pricing Approaches
- Nonprofit discounts (typically 10-50% off commercial pricing)
- Tiered pricing by budget size
- Grant-eligible pricing structures
- Implementation support or training inclusion
Proactively addressing nonprofit pricing in outreach can significantly improve engagement.
Board and Committee Dynamics
Nonprofit purchasing often involves governance bodies.
Board Involvement Considerations
- Executive committee approval may be required for significant purchases
- Technology committees may evaluate solutions
- Finance committees review major investments
- Provide materials suitable for board presentation
Offer resources and information formatted for board review to facilitate decision-making.
Benchmarking Your Performance

To effectively benchmark your nonprofit cold email campaigns:
Segment Your Data
Break down performance by:
- Budget size and organizational scale
- Subsector and mission area
- Target persona and role
- Geographic region
- Product category
Track Full Funnel Metrics
Beyond initial response rates, track:
- Time from first reply to demonstration
- Demo to purchase conversion
- Contract value by organization size
- Referrals within nonprofit networks
Account for Funding Cycles
Nonprofit purchasing aligns with fiscal years, grant cycles, and campaign outcomes. Evaluate performance relative to funding patterns.
The Path Forward
Nonprofit cold email can be effective when executed with sector knowledge and mission-aligned messaging. The combination of resource constraints and genuine need for efficiency creates opportunities for solutions that clearly demonstrate value.
Success requires understanding nonprofit operations, addressing pricing proactively, and communicating in terms that resonate with mission-driven professionals.
If your current performance falls below these benchmarks, consider whether your team has the nonprofit sector expertise to optimize effectively. Our done-for-you cold email campaigns combine deep understanding of nonprofit organizations with proven outreach methodologies to help companies achieve above-benchmark results in the nonprofit market.
Get your free campaign strategy to see how your nonprofit cold email metrics compare to industry benchmarks and identify specific opportunities for improvement.
Related Reading
Frequently asked questions.
Frequently asked questions- What are typical cold email response rates when targeting nonprofit organizations?
- Average nonprofit cold email performance includes open rates of 32-42%, reply rates of 2-3.5%, positive reply rates of 1-2%, and meeting booking rates of 0.6-1.5%. Small nonprofits with budgets under $1M perform significantly better with open rates of 48-62% and meeting rates of 2-4%, while major foundations show lower engagement at 32-45% open rates and 0.7-1.5% meeting rates.
- Which types of nonprofit products get the best cold email response rates?
- Fundraising and donor management solutions achieve the strongest engagement with open rates of 45-58%, reply rates of 4.5-7%, and meeting booking rates of 1.8-3.5%. Marketing and communications tools perform similarly with 45-58% open rates and 1.5-3% meeting rates. These categories outperform because they directly impact donor revenue and mission visibility, making them higher priorities for nonprofit leadership.
- Should I target executive directors or development directors at nonprofits?
- Executive directors deliver higher engagement with open rates of 45-58%, reply rates of 4.5-7%, and meeting booking rates of 1.8-3.5%, particularly at smaller organizations where they make purchasing decisions directly. Development directors are better targets specifically for fundraising solutions where they have budget authority and domain expertise. At larger nonprofits, decision-making often involves multiple stakeholders regardless of initial contact.
- Do small nonprofits respond better to cold email than large ones?
- Yes, small nonprofits with budgets under $1M show significantly higher engagement with open rates of 48-62%, reply rates of 4.5-7.5%, and meeting rates of 2-4% compared to major foundations which average 32-45% open rates and 0.7-1.5% meeting rates. Smaller organizations have less gatekeeping as executive directors typically manage their own email and make purchasing decisions more directly without extensive committee involvement.
- What cold email meeting booking rate should I expect from nonprofit outreach?
- Average nonprofit meeting booking rates range from 0.6-1.5%, with small nonprofits performing best at 2-4% and major foundations lowest at 0.7-1.5%. Excellent performance exceeds 2.5% overall. Meeting conversion takes longer in nonprofits due to volunteer board involvement and committee-based decision-making, so sales cycles extend beyond initial engagement even when interest is expressed.
About the author.

Hosun Chung is COO at RevenueFlow, which builds and operates outbound revenue engines for B2B companies. Previously at Gleacher Shacklock LLP. Studied at London School of Economics.
Hosun Chung · COO
Connect on LinkedIn →Explore more.
Ready to scale your outreach?
We build GTM engines that book real meetings. See the receipts.
Related articles.
Cold Email Conversion Benchmarks: 2026 Performance Data
Complete benchmark data for cold email conversion rates from reply to meeting to opportunity. Learn what drives conversions and how to optimize your full funnel.
Education Cold Email Benchmarks: 2026 Performance Data
Industry benchmark data for education cold email campaigns, including open rates, reply rates, and conversion metrics for companies targeting K-12 schools, higher education, and corporate training organizations.
Automotive Cold Email Benchmarks: 2026 Performance Data
Industry benchmark data for automotive sector cold email campaigns, covering OEMs, suppliers, dealerships, and automotive technology with performance metrics by segment and buyer role.
Real Estate Cold Email Benchmarks: 2026 Performance Data
Comprehensive benchmark data for real estate cold email campaigns, including open rates, reply rates, and conversion metrics for companies targeting brokerages, property managers, developers, and real estate investors.
Fintech Cold Email Benchmarks: 2026 Performance Data
Comprehensive benchmark data for fintech cold email campaigns, including open rates, reply rates, and conversion metrics specific to financial technology companies targeting banks, financial institutions, and businesses.
Media Cold Email Benchmarks: 2026 Performance Data
Comprehensive benchmark data for media and entertainment industry cold email campaigns, covering publishers, streaming platforms, advertising, and content creators.