Optimizely Cost: What the Plans Page Publishes
Optimizely's plans page carries no prices, by either fetch route. What its own pages do disclose, where the circulating figures come from, and what rivals publish.
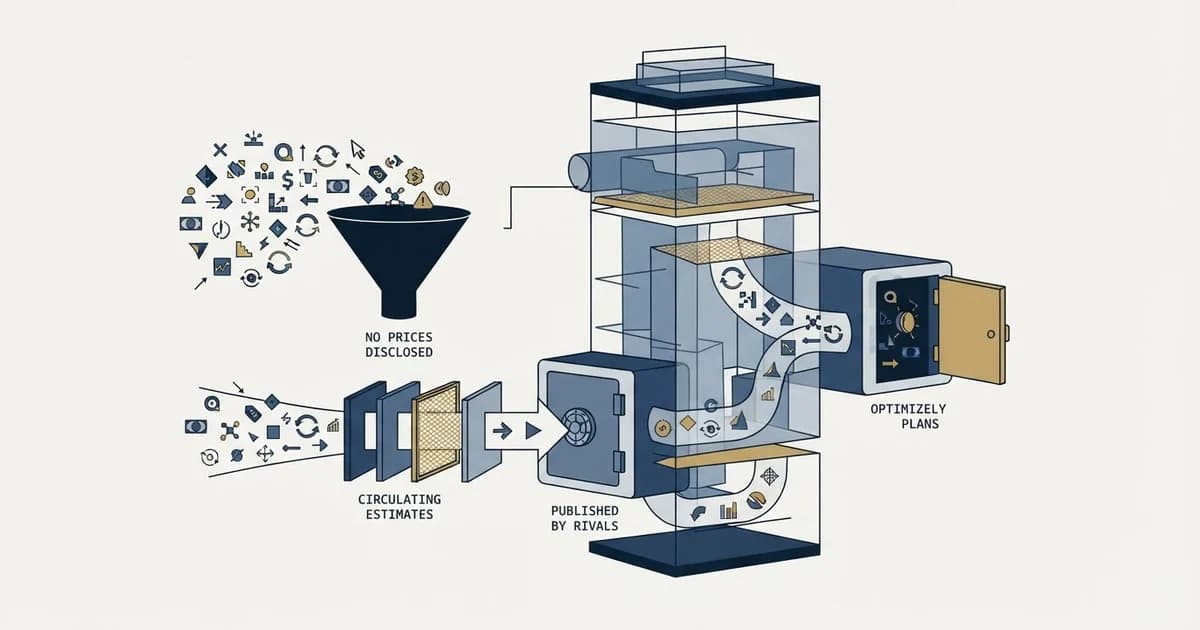
Optimizely pricing is not published: the plans page carries a form and the sentence that every Optimizely plan is individually packaged, above ten separately marketed products and no rate. The one figure with a stated method is Vendr's marketplace listing, a median of $81,447 a year across 126 purchases, with a low of $26,460 and a high of $261,075.
Key takeaways
- Optimizely's plans page returns zero currency figures by plain fetch and by headless browser; it publishes three headline products, seven more tools and a packaging statement.
- Vendr's listing states the median buyer pays $81,447 a year, from a low of $26,460 to a high of $261,075, a factor of ten that marks a distribution rather than a price.
- Alternatives with a rate card include Statsig Pro at $150 a month with 5 million events, GrowthBook Pro at $40 per seat per month and PostHog with a free monthly allowance.
- Before any quote matters, count monthly conversions on the pages you would test; below the sample a test needs, the platform choice is not the decision in front of you.
Reviewed and updated September 18, 2026
Optimizely pricing is not published, and the Optimizely cost question has no rate card behind it. Fetched twice, once over plain HTTP and once through a headless browser to rule out client side rendering, the page at optimizely.com/plans returns zero currency figures by either route. What it returns instead is a form and one sentence: "Every Optimizely plan is individually packaged. Tell us a bit about your digital needs, and we'll create a plan together."
That is the answer to the cost question, and it is worth taking seriously rather than treating as a gap to be filled by whatever number a roundup happens to carry.
Below is what the vendor's own pages do disclose, where the figures circulating on other sites come from, what the alternatives with published ladders charge, and the test that decides whether any of these numbers matter to a B2B team.
Optimizely pricing: how much does it cost?
Optimizely's plans page publishes no price. It carries a form and one sentence, "Every Optimizely plan is individually packaged", above three headline products, Agentic CMS, Agentic Experimentation and an Agent Platform, and seven more tools. The only figure with a stated method is Vendr's marketplace listing, which says the median buyer pays $81,447 a year across 126 purchases, with a low of $26,460 and a high of $261,075.
Why there is no rate card, read from the page itself
The reason is structural and the plans page shows it. Optimizely is not one product with tiers. The page presents three headline products, Agentic CMS, Agentic Experimentation and an Agent Platform, and then a block titled "Even more tools for marketers" listing seven more: Content Marketing Platform, Analytics, Personalization, Commerce, Asset Management, Data Platform and Feature Management.
Ten separately marketed products, typically bought in combination, do not reduce to a ladder. A price would have to name which products, at what traffic, on which deployment, for how many users.
One card rarely covers a whole bill, and the four lines on a Webflow invoice separate the site subscription, the workspace subscription, paid seats and metered add-ons.
That list is also the short answer to what Optimizely is used for, worth stating plainly because the question is usually asked apart from the price and usually answered by the vendor's own implementation partners.
The experimentation product is the one adjacent to most B2B marketing work, and its own bullet list on that page names "A/B, multi-page, feature and server-side testing", a "Proprietary Stats Engine for results you can trust", "Real-time personalization and audience targeting" and "Warehouse-native analytics to measure impact". Those are capability claims from the vendor rather than measurements, and they describe an enterprise experimentation platform rather than a testing widget.
The customers page points the same way. Its own filter list runs across B2B services, financial services, healthcare, insurance, manufacturing, education and charities, and its featured stories are a national mint, a group running seventeen brands off a legacy CMS, and a team replacing five analytics tools. This is a platform sold to organisations with a digital estate, and the shape of the buyer explains the shape of the pricing.
Where the numbers on other pages come from

Search the cost question and the results are mostly published by companies that sell experimentation software, plus one procurement marketplace. The marketplace is the only one of them publishing a figure with a stated method behind it, and it is worth quoting precisely rather than paraphrasing.
Vendr's Optimizely marketplace listing states that the "Median buyer pays $81,447 per year", with a low of $26,460 and a high of $261,075, and describes that as "Based on data from 126 purchases, with buyers saving 13% on average". The same page's summary card reports "$81,447 Avg Contract Value" and "100 Deals handled".
Two things about that figure deserve to travel with it. It is a contract value from a procurement intermediary's own anonymised dataset rather than a rate Optimizely puts on a page, and the same listing says "Published list pricing is rarely the final number" while disagreeing with itself on the sample: 126 purchases in the body against 100 deals in the card. Neither number is unreasonable, and the gap between the low and the high is a factor of ten, which is the more useful signal. A spread that wide says the figure is a distribution across ten products and many deployment sizes rather than a price for a thing.
Vendr's own description of the pricing drivers matches what the vendor's pages imply: traffic volume, feature selection, deployment complexity, and the feature tier of the product bought.
Quoted only
Optimizely, VWO
- Optimizely publishes a form and no figures
- Ten separately marketed products
- VWO's pricing page renders no currency figure either
- VWO varies quotas per monthly active user instead of rates
Published ladder
Statsig, GrowthBook
- Statsig Pro $150 a month, 5M events included, then $0.05 per 1K events
- Statsig Developer free with 2 million events a month
- GrowthBook Pro $40 per seat per month
- GrowthBook Starter free for up to three users
Usage first
PostHog
- A monthly free allowance on every product
- 1 million events and 5,000 session recordings free
- Experiments billed with feature flags
- Pay as you go above the allowance; usage stops without a card
What the alternatives publish instead
What the alternatives publish instead is the comparison worth making, because a published ladder is what lets a team budget without a sales cycle. A feature-by-feature table separates these products badly; what each vendor is willing to put a number on separates them well.
Statsig publishes a ladder. Its Developer tier is free with 2 million events a month, unlimited flag and config checks, 50,000 session replays a month, unlimited seats and one year of analytics retention. Its Pro card is $150 a month, described on that page as "5M events included, then $0.05 per 1K events", plus 100,000 session replays a month. Enterprise is quoted, and is where warehouse native deployment, SSO and role based access sit.
GrowthBook prices per seat. Its Starter tier is free for up to three users on one project, with unlimited feature flags, unlimited experiments and unlimited traffic. GrowthBook's Pro card is $40 per seat per month and three projects, adding a visual editor, multi arm bandits, safe rollouts and a power calculator. The page disagrees with itself on the user ceiling: the Pro card says up to 30 users while the page's own FAQ says the Pro tier adds up to 50 users, so confirm the number before sizing a team on it. Enterprise is quoted, with the page offering "Pricing tailored to your scale and licensing requirements". Both cloud and self hosted deployments are offered.
PostHog leads with the free allowance. Its pricing page opens with "97% of companies use PostHog for free" and publishes a monthly allowance per product that renews whether or not a card is on file: 1 million analytics events, 5,000 session recordings, 1 million feature flag requests, 1,500 survey responses, with experiments billed alongside feature flags. Above that it is pay as you go, and the page states that usage stops at the free tier limits without a card, so an account cannot be charged by surprise.
PostHog pricing carries a second published layer beside the usage meters: its platform packages page lists Boost at $250 a month and Scale at $750 a month, covering SSO enforcement, SAML and collaboration features, with Enterprise the only one of the three left to a conversation.
VWO answers the same way Optimizely does. Its pricing page returns no currency figures, and that page varies quotas per monthly active user instead of carrying rates, an approach set out alongside the other meters in landing page optimization tools.
| Before the pricing call | Source |
|---|---|
| Name which of the ten products you would deploy | The plans page lists them; the price is per product |
| Have monthly page views and conversions to hand, counted | Your own analytics |
| Price a published ladder against the same requirement | Statsig, GrowthBook and PostHog pricing pages |
| Decide what a test needs to be conclusive at your volume | Sample arithmetic, not the vendor |
| Treat a third-party contract value as a budget number | Vendr's figure is a distribution across 126 purchases |
| Compare an enterprise DXP with a single-purpose tool on price alone | Ten products against one |
The test that decides whether the price matters
There is a question that comes before the quote, and for most B2B teams it settles the purchase without a conversation.
Traffic settles more than the test plan, and ClickFunnels leaving visitors unpriced meters the contact database and the sending instead.
An experimentation platform converts traffic into a decision, and it needs a sample to do it. A campaign landing page receiving a few hundred visitors a month, converting at single or low double digit numbers, cannot separate a real effect from noise however good the platform is. The arithmetic behind that threshold is worked through in landing page optimization tools, and the same sample logic applied to email is in cold email A/B testing benchmarks.
Two supporting reads make the point concrete. What the published conversion benchmarks actually counted, and why none of them describes an outbound fed page, is in average landing page conversion rate. And the reason a rate computed over a few dozen records is dominated by chance is in conversion rate.
Below that threshold the useful spend is on observation and on asking real buyers, both of which work at low sample, and on the flow of visitors rather than on the landing page itself. Whether a campaign page or the demand reaching it is the constraint is the prior question, worked through in landing page lead generation. Above it, an experimentation platform becomes the correct centre of the stack, and then the question of whether a quoted enterprise suite or a published ladder fits is a real one.
What we are not saying
Nothing above is a claim that Optimizely is overpriced, and nothing here is a quote. The vendor puts no list price on the page that would carry one, saying instead that "Every Optimizely plan is individually packaged", so no independent page can tell you what yours would be, and any article naming a single figure is repeating a third party's contract data or another article.
The honest position on a quote only vendor has three parts. Say what the vendor's own pages disclose, which here is a product list and a packaging statement. Name any external figure as somebody else's measurement, with its method attached. And be clear about what would have to be true for the purchase to make sense at all, which for an experimentation platform is a traffic volume rather than a budget.
That last part is where most of the value sits, and it is also the part a vendor comparison page has no incentive to write.
The short version

Optimizely publishes no prices on the page that would carry them. That plans page, read twice by two routes, returns a form and the line "Every Optimizely plan is individually packaged", and the reason is that it markets ten products that are bought in combination.
The one external figure with a stated method is Vendr's marketplace listing, whose line is "Median buyer pays $81,447 per year", against a range of $26,460 to $261,075, on a page that names 126 purchases in one place and 100 deals in another. Treat it as a distribution across products and deployment sizes rather than as a price.
Alternatives carrying a rate card on the page include Statsig at $150 a month with 5 million events, GrowthBook at $40 per seat per month, and PostHog with a monthly free allowance and pay as you go above it. VWO, like Optimizely, shows none on its pricing page.
Before any of that matters, count the conversions your pages produce in a month. Below the sample a test needs, the platform choice is not the decision in front of you. If the shortage is qualified traffic rather than tooling, see what one campaign produces against your own market.
Vendor statements and figures above are taken from each vendor's own pages, except the contract value figures, which are Vendr's own marketplace data and are attributed to it. Verify current terms with the vendor before relying on them.
Frequently asked questions.
Frequently asked questions- How much does Optimizely cost?
- Optimizely does not publish a price. Its plans page carries a form and the line that every Optimizely plan is individually packaged, above three headline products and seven more tools, and no currency figure appears by plain fetch or in a rendered browser. The only external figure with a stated method is Vendr's median of $81,447 a year across 126 purchases, which is contract data rather than a rate.
- Why is there no Optimizely pricing page with plans?
- Because Optimizely is not one product with tiers. The plans page presents Agentic CMS, Agentic Experimentation and an Agent Platform, then a block of seven more tools: Content Marketing Platform, Analytics, Personalization, Commerce, Asset Management, Data Platform and Feature Management. Ten products bought in combination do not reduce to a ladder, so a price has to name products, traffic, deployment and users.
- What do Optimizely alternatives cost?
- Statsig's Developer tier is free with 2 million events a month and its Pro card is $150 a month with 5 million events included, then $0.05 per thousand events. GrowthBook's Starter tier is free for up to three users and Pro is $40 per seat per month. PostHog publishes a monthly free allowance of 1 million events and 5,000 session recordings, then pay as you go. VWO, like Optimizely, shows no price.
- Is the Vendr figure for Optimizely a real price?
- It is a contract value from a procurement intermediary's anonymised dataset rather than a rate Optimizely puts on a page. Vendr's listing says the median buyer pays $81,447 a year, based on 126 purchases, with buyers saving 13 percent on average, and its summary card reports 100 deals handled. Treat it as a distribution across ten products and many deployment sizes, useful for knowing whether a quote is unusual.
About the author.

Ben Carden is CRO at RevenueFlow, which builds and operates outbound revenue engines for B2B companies. Previously at Gartner Enterprise. Studied at London School of Economics.
Ben Carden · CRO
Connect on LinkedIn →Explore more.
Ready to scale your outreach?
We build GTM engines that book real meetings. See the receipts.
Related articles.
Webflow Pricing: The Four Lines on a Real Bill
Webflow bills a site plan, a workspace plan, seats and metered add-ons. What each line pays for, read from the vendor's own pricing page in September 2026.
ClickFunnels Pricing: The Meter Is Contacts, Not Traffic
Four published tiers, and visitors are unlimited on every one of them. What ClickFunnels actually meters, and the tier where webhooks and the API appear.
FullEnrich Pricing: You Pay Only for Found Data
FullEnrich spends credits only on data it finds and verifies, and a mobile number costs ten times a work email. The bands, and the mix that decides the bill.
Unbounce Alternatives: Two Boundaries, Four Meters
Teams leave Unbounce at two published boundaries: the 500 visitor entry ceiling and testing starting on the third tier. Each alternative moves one, both or neither.
Crunchbase Pricing: The Annual Rate Is Introductory
The annual figure Crunchbase shows a new visitor is a first year rate, and its own help centre says so. Where the price lives, and why the export cap decides it.
Typeform Alternatives: Read the Response Meter First
Typeform meters responses with a hard ceiling and counts seats inside the plan. What Tally, Fillout, Formbricks and Jotform count instead, from their own pricing pages.