Revenue Per Employee: Do You Need Reps or Systems?
Lovable earns $2.74M per employee with 146 people. Apple earns $2.51M with 166,000. Here is what the ranking says about your next go-to-market hire.
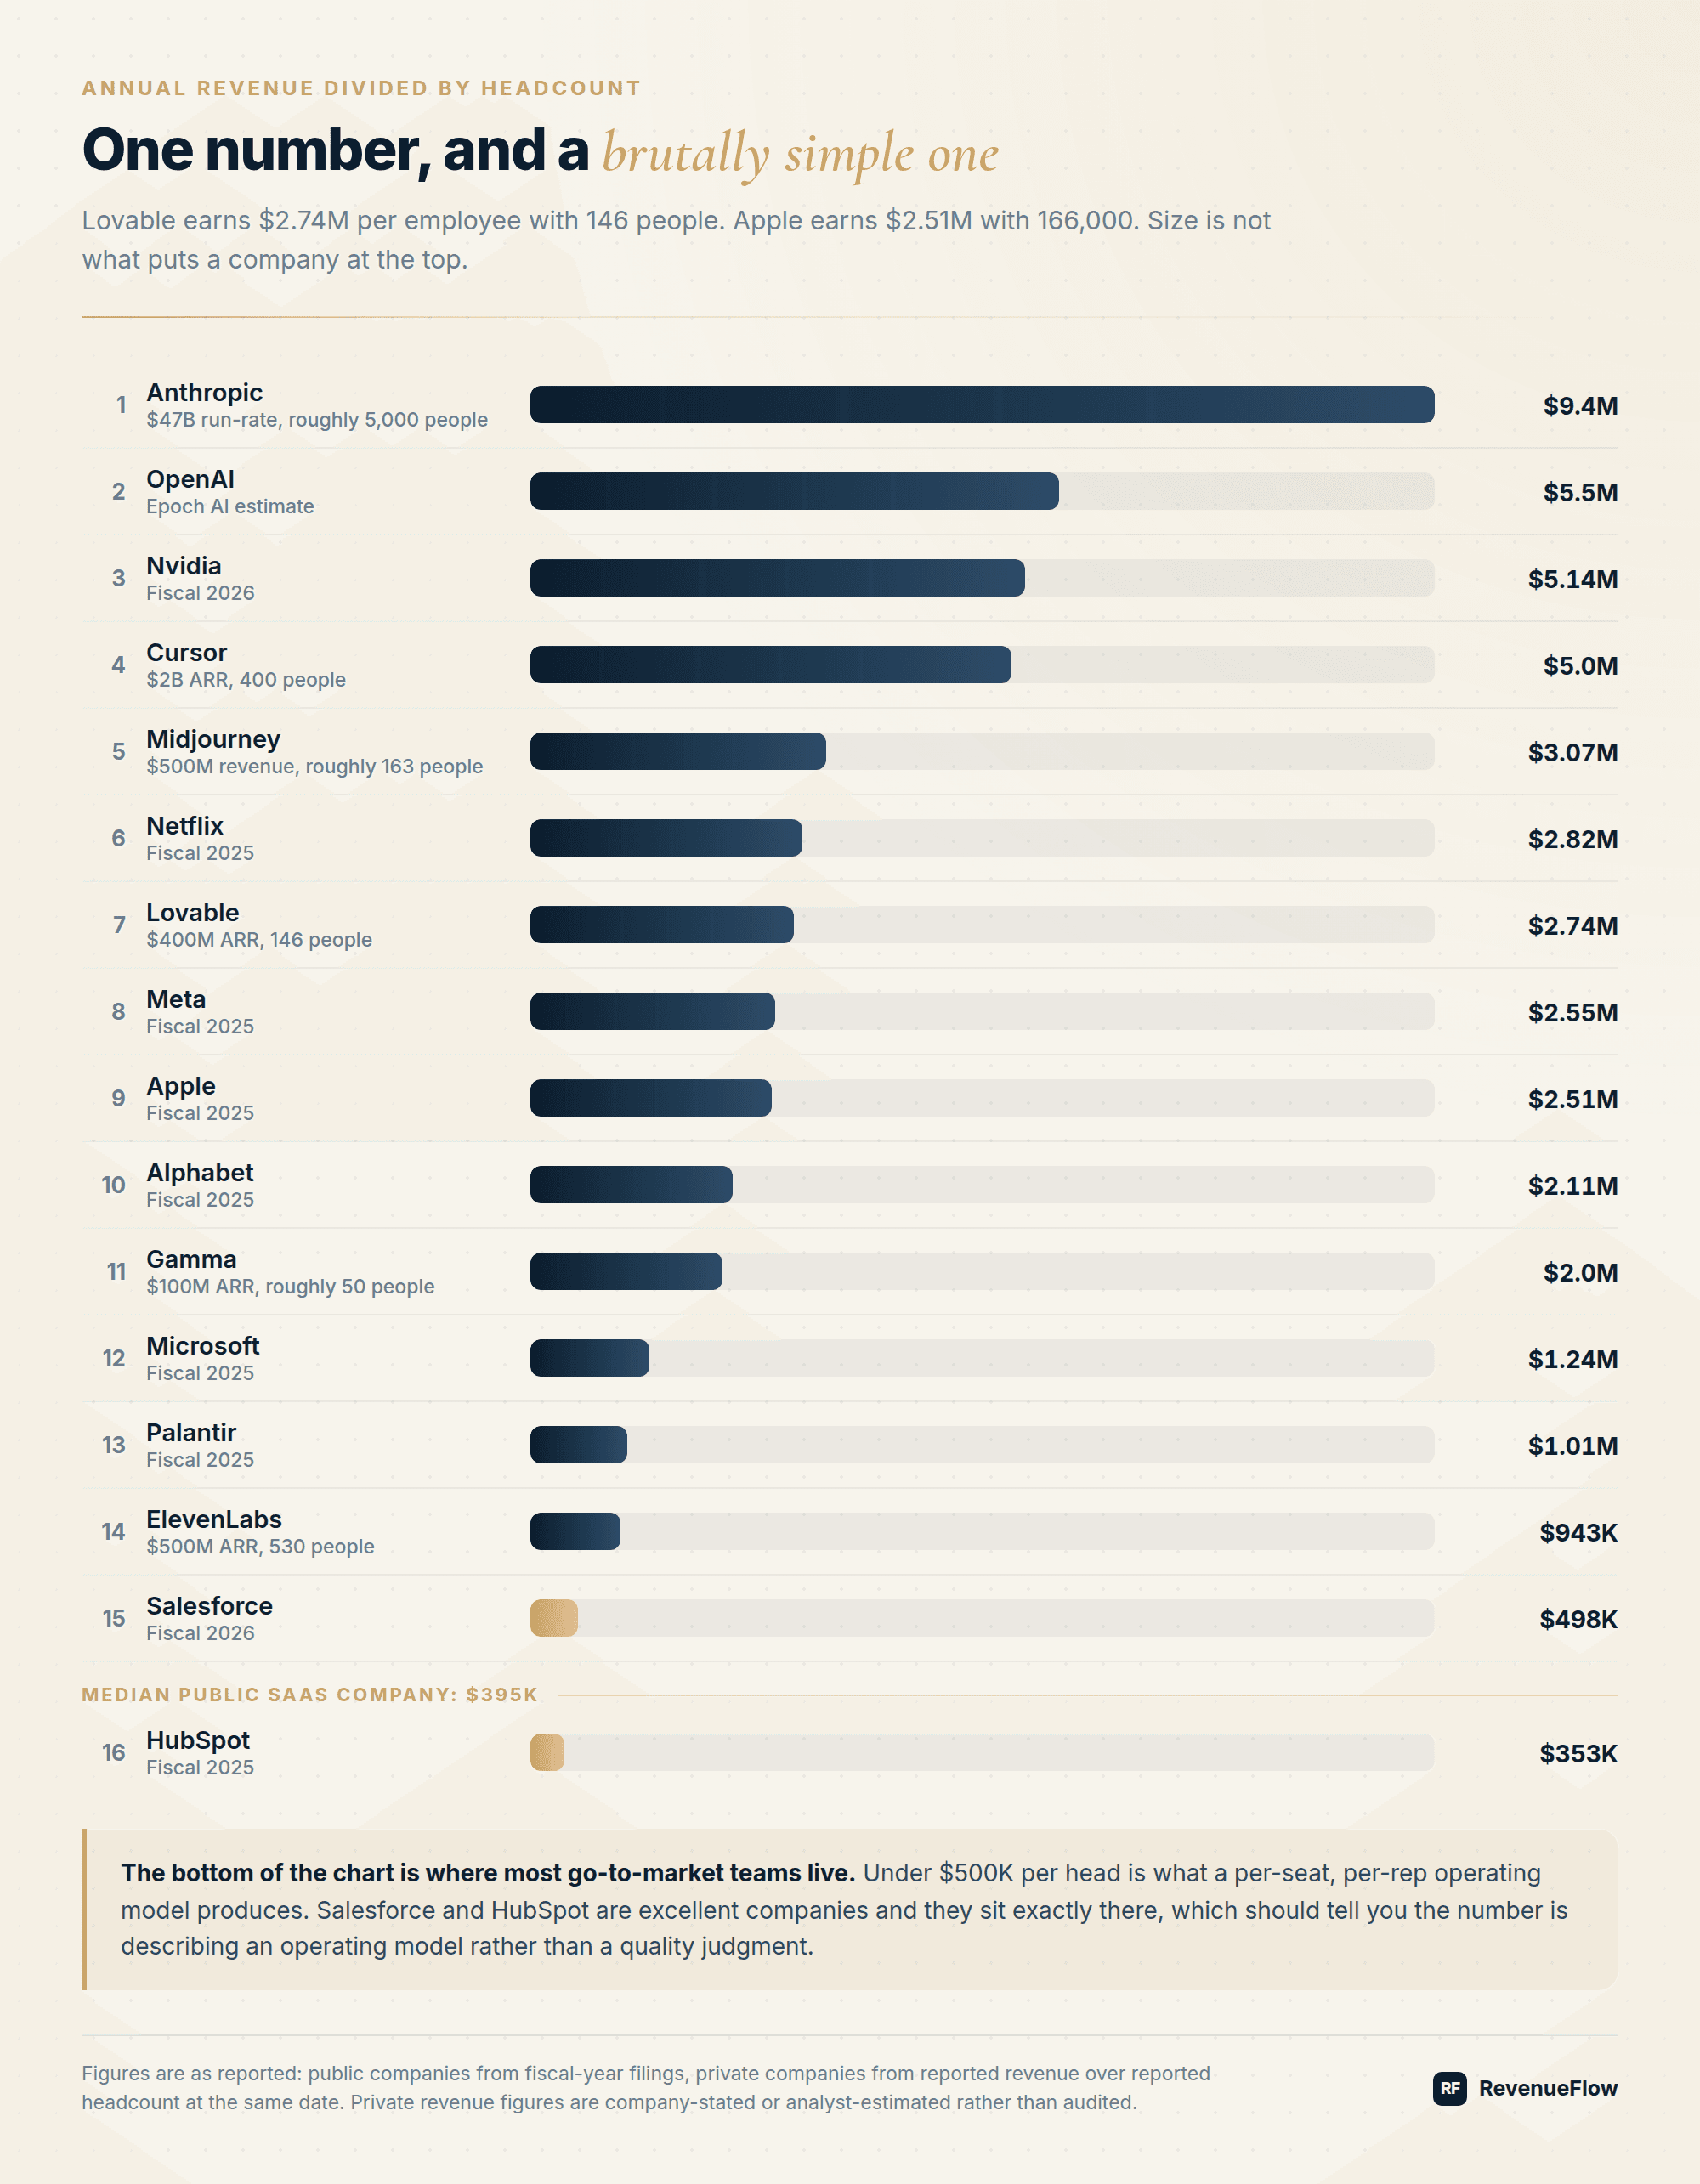
Revenue per employee (annual revenue divided by headcount) reveals whether a company scales through hiring reps or through reusable systems. Lovable generates $2.74M per employee with 146 people; Salesforce generates $498K with a much larger, quota-carrying workforce. Companies under $500K per head typically run a per-seat, per-rep go-to-market model with a hard structural ceiling.
Key takeaways
- Lovable earns $2.74M in revenue per employee with 146 people, while Apple earns $2.51M with 166,000 employees.
- Anthropic tops the ranking at $9.4M per employee on a $47B run-rate with roughly 5,000 people.
- The median public SaaS company sits at $395K in revenue per employee.
- Salesforce ($498K) and HubSpot ($353K) sit at the bottom of the chart, reflecting a per-seat, per-rep operating model rather than poor company quality.
- In a quota-carrying model, a rep's quota multiple of fully loaded cost sets a near-fixed ceiling on revenue per go-to-market head, and that ceiling does not compound over time.
Reviewed and updated September 5, 2026
Revenue Per Employee: The Cleanest Read on Whether You Need Reps or Systems
Lovable earns $2.74M in revenue per employee, with 146 people.
Apple earns $2.51M, with 166,000.
One number, and a brutally simple one. Annual revenue divided by headcount. Public companies from fiscal-year filings, private ones from reported revenue over reported headcount at the same date.
| # | Company | Basis | Revenue per employee |
|---|---|---|---|
| 1 | Anthropic | $47B run-rate, roughly 5,000 people | $9.4M |
| 2 | OpenAI | Epoch AI estimate | $5.5M |
| 3 | Nvidia | Fiscal 2026 | $5.14M |
| 4 | Cursor | $2B ARR, 400 people | $5.0M |
| 5 | Midjourney | $500M revenue, roughly 163 people | $3.07M |
| 6 | Netflix | Fiscal 2025 | $2.82M |
| 7 | Lovable | $400M ARR, 146 people | $2.74M |
| 8 | Meta | Fiscal 2025 | $2.55M |
| 9 | Apple | Fiscal 2025 | $2.51M |
| 10 | Alphabet | Fiscal 2025 | $2.11M |
| 11 | Gamma | $100M ARR, roughly 50 people | $2.0M |
| 12 | Microsoft | Fiscal 2025 | $1.24M |
| 13 | Palantir | Fiscal 2025 | $1.01M |
| 14 | ElevenLabs | $500M ARR, 530 people | $943K |
| 15 | Salesforce | Fiscal 2026 | $498K |
| 16 | HubSpot | Fiscal 2025 | $353K |
The median public SaaS company sits at $395K.
Three things worth sitting with
Size is not what puts a company at the top. Lovable does it with 146 people. Gamma clears Microsoft with about 50. Neither of them hired their way there.
The split is not AI versus everything else. Nvidia sits above Cursor. Apple, Alphabet, Meta and Microsoft land in the same band as Lovable and Gamma. ElevenLabs is at $500M ARR and still sits below Microsoft. The real divide runs between companies that added people to add revenue and companies that added systems.
The bottom of the chart is where most go-to-market teams live. Under $500K per head is what a per-seat, per-rep operating model produces. Salesforce and HubSpot are excellent companies and they sit exactly there, which should tell you the number is describing an operating model rather than a quality judgment.
Why per-rep go-to-market lands where it lands
The arithmetic is almost closed-form. In a quota-carrying model, revenue grows by adding quota carriers, and cost grows with them at close to the same rate. Whatever multiple of fully loaded cost you set as a rep's quota is, near enough, the ceiling on revenue per go-to-market head. Then marketing, ops, enablement and support headcount drag the company average below that ceiling.
Nothing in that model compounds. Each new seat starts at zero, ramps on the same curve the last one did, and produces roughly what the last one produced. You can improve the inputs at the margin with better targeting and better training, but the structure caps you where it caps you. That is the mechanism behind the $180K-a-year SDR line item versus the automation stack comparison, and it is why the in-house versus outsourced SDR debate rarely changes the ratio much. Both options buy capacity by the head.
Systems behave differently only when they are genuinely reusable. A script that sources and verifies a segment runs again next quarter at close to zero marginal cost. A rep does not.
- Revenue grows by adding quota carriers, and cost grows with them at close to the same rate
- Each new seat starts at zero, ramps on the same curve the last one did
- Nothing in that model compounds
- A script that sources and verifies a segment runs again next quarter at close to zero marginal cost
- It does not ramp again
- Your revenue per employee is a design decision, not a hiring budget
The decision rule
Most sales orgs hear "we need more pipeline" and answer "we need more reps." That answer pins you to the bottom of the chart permanently.
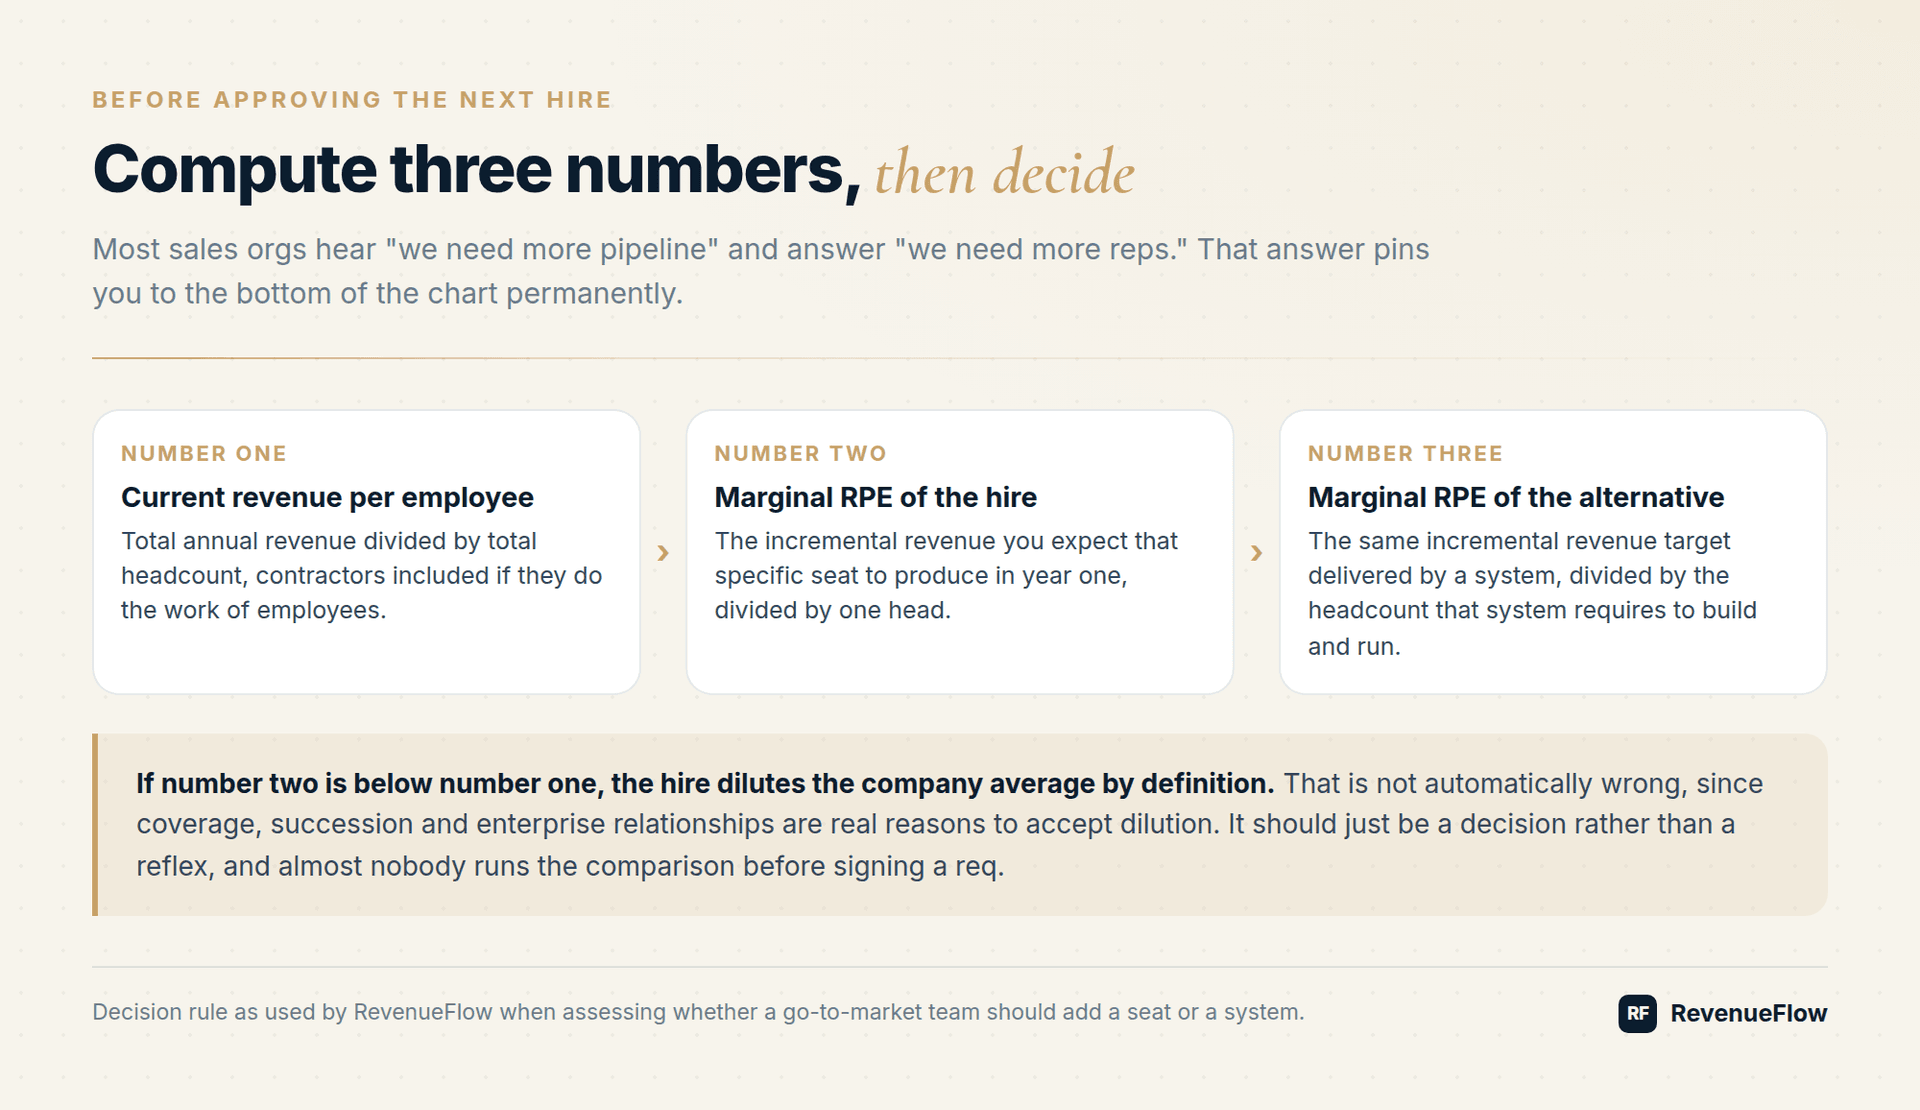
Before approving the next hire, compute three numbers.
- Current revenue per employee. Total annual revenue divided by total headcount, contractors included if they do the work of employees.
- Marginal revenue per employee of the hire. The incremental revenue you expect that specific seat to produce in year one, divided by one head.
- Marginal revenue per employee of the alternative. The same incremental revenue target delivered by a system, divided by the headcount that system requires to build and run.
If number two is below number one, the hire dilutes the company average by definition. That is not automatically wrong, since coverage, succession and enterprise relationships are real reasons to accept dilution. It should just be a decision rather than a reflex.
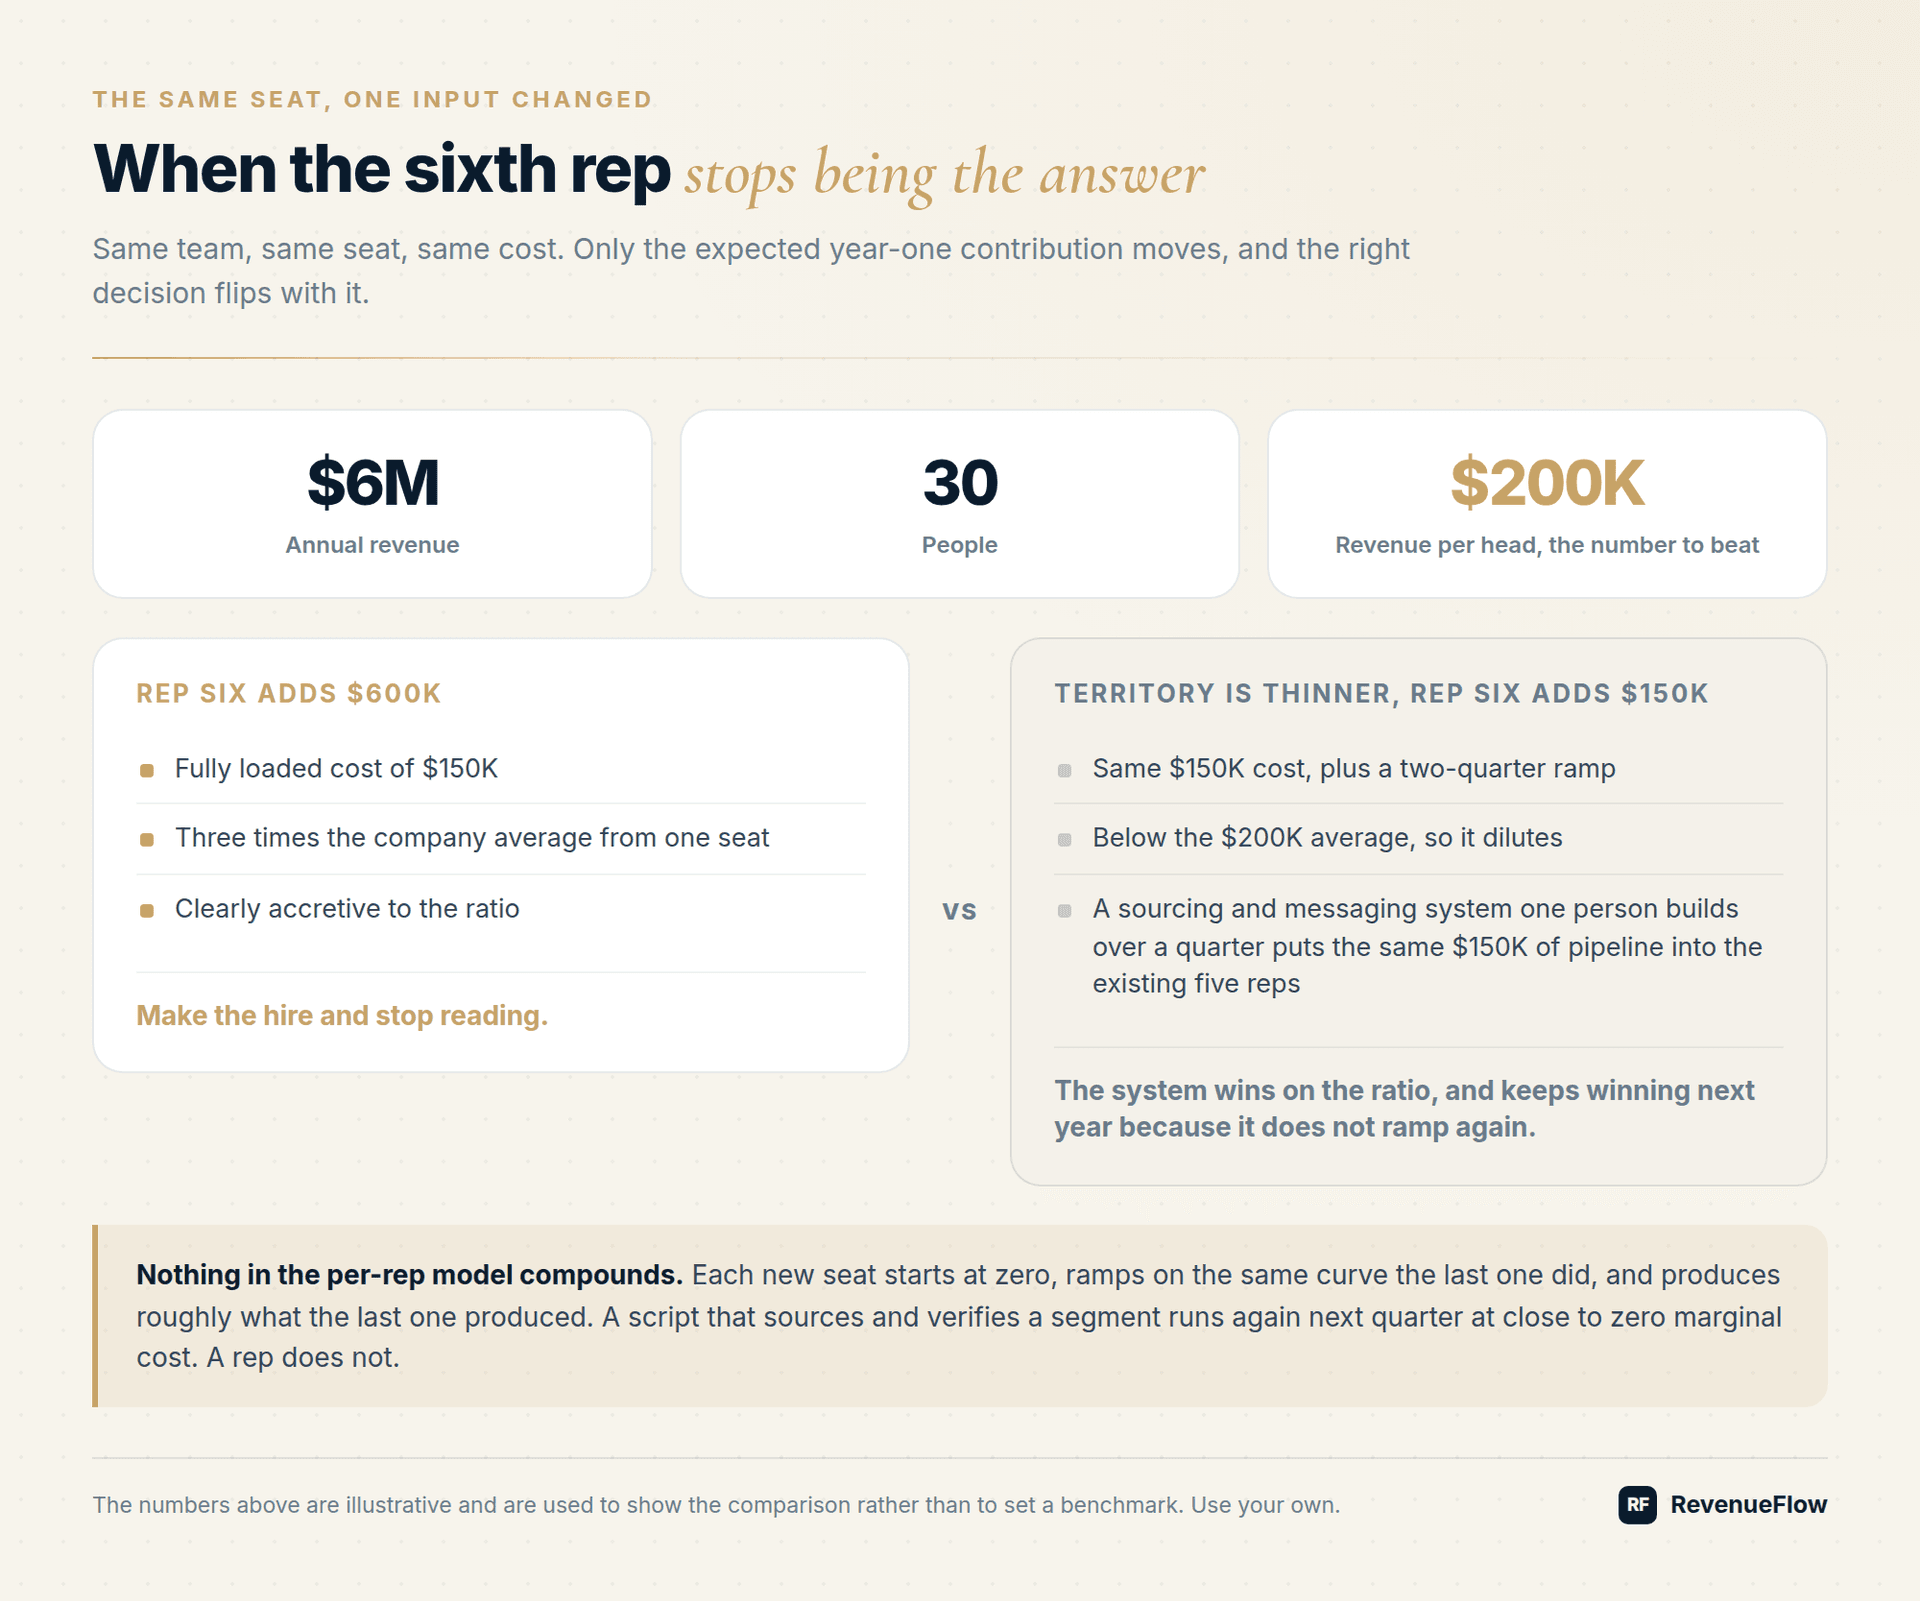
Suppose a team at $6M of revenue with 30 people, which is $200K per head. Rep number six is expected to add $600K in year one at a fully loaded cost of $150K. Three times the company average from one seat is clearly accretive, so make the hire and stop reading.
Now change one input. Territory is thinner than it was, so the same seat is expected to add $150K in year one. That is below the $200K average, and it arrives with a $150K cost and a two-quarter ramp. Run the third number against it: if a sourcing and messaging system that one person builds over a quarter can put the same $150K of pipeline into the existing five reps, the system wins on the ratio and keeps winning next year, because it does not ramp again.
The numbers above are illustrative. Use your own. The point is the comparison, and almost nobody runs it before signing a req.
Where revenue per employee misleads
I would not use this metric alone, and neither should you.
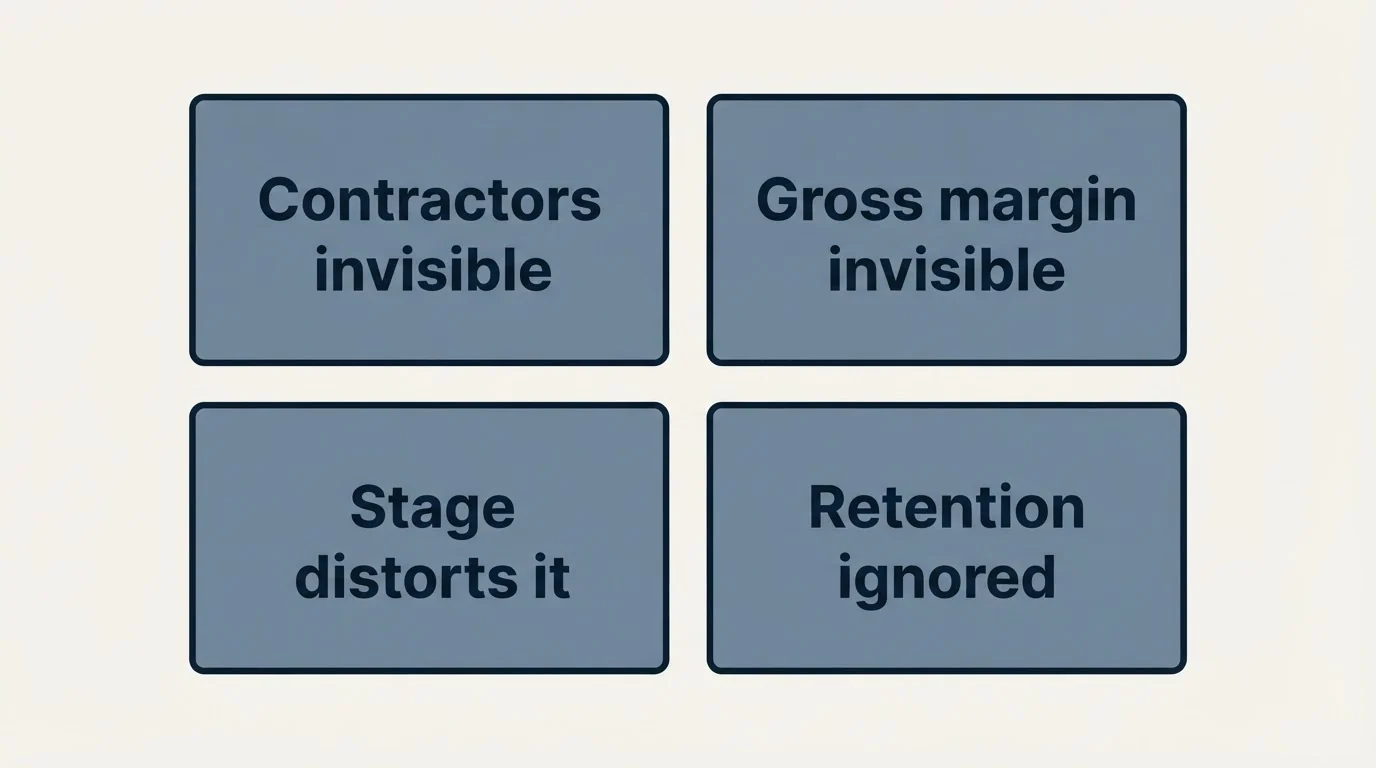
- Contractors and outsourced labour do not appear in headcount. A high ratio can be bought rather than engineered. Check the ratio against total cost of people, however they are contracted.
- Gross margin is invisible in it. Nvidia is a hardware business. A reseller can post an enormous ratio on thin margin. Gross profit per employee is the stricter version of this metric, and worth running alongside.
- Stage distorts it. A company that just hired ahead of a launch looks worse than it is, and one that just cut looks better than it is for about two quarters.
- It says nothing about retention. Revenue that churns still counts in the numerator this year.
Use it as a direction of travel and a challenge to a hiring plan, not as a scoreboard.
What to do if you are at the bottom of the chart
Instrument before you restructure. You cannot improve the ratio you cannot see, so start with cost per qualified meeting and cost per closed deal, including software and contractor spend rather than salaries alone. Publishing an honest lead generation cost baseline internally is usually the moment the conversation changes.
Then replace the layers where a human seat adds the least. Sourcing, list building, research and first-touch drafting absorb an enormous share of a rep's week and none of it requires the judgment you hired them for. That is the work an AI SDR or an AI appointment setter can genuinely take, provided a human still signs off before anything sends. Keep the seat for the conversation, the negotiation and the relationship, where it is worth every dollar.
Doing that well needs someone who can build and maintain the systems, which is the whole argument for the GTM engineer role, and it usually means restructuring the team around the high-leverage work rather than adding a layer to the org chart.
The companies at the top of this chart answered "we need more pipeline" with software. Your revenue per employee is a design decision, not a hiring budget.
We build AI-native pipeline systems and you pay per qualified meeting, not a retainer. No paying for activity. You only pay when we book you a qualified sales meeting. See if you qualify.
Figures are as reported: public companies from fiscal-year filings, private companies from reported revenue over reported headcount at the same date. Private revenue figures are company-stated or analyst-estimated rather than audited.
Frequently asked questions.
Frequently asked questions- What is revenue per employee and how is it calculated?
- Revenue per employee is a company's annual revenue divided by its total headcount. For public companies it is calculated from fiscal-year filings; for private companies it uses reported revenue over reported headcount at the same date. It is used as a simple proxy for whether a business scales through people or through systems.
- Why does Lovable have a higher revenue per employee than Apple?
- Lovable generates $2.74M per employee with only 146 people, slightly above Apple's $2.51M with 166,000 employees, because Lovable's revenue comes from systems rather than from scaling headcount. The article notes that size is not what drives a high ratio; companies like Lovable and Gamma reach the top without large workforces.
- Does a low revenue-per-employee ratio mean a company is badly run?
- No, the article states this explicitly, using Salesforce ($498K) and HubSpot ($353K) as examples of excellent companies that still sit at the bottom of the chart. A low ratio describes a per-seat, per-rep operating model rather than a quality judgment on the business.
- How do I decide whether to hire another sales rep or build a system instead?
- Compute three numbers: current revenue per employee, the marginal revenue per employee the new hire is expected to produce in year one, and the marginal revenue per employee an automated system alternative would produce for the same target. If the hire's marginal number is below the company average, it dilutes the ratio and the system alternative should be weighed seriously, since it can keep producing without ramping again next year.
- What are the limitations of using revenue per employee as a metric?
- The article warns against using it alone because contractors and outsourced labour don't appear in headcount, which can inflate the ratio without reflecting true efficiency, and gross margin is invisible in the metric, so a hardware or reseller business can post a high ratio on thin margin while looking comparable to a high-margin software company.
About the author.

Tim Carden is CMO / CTO at RevenueFlow, which builds and operates outbound revenue engines for B2B companies. Studied at McGill University.
Tim Carden · CMO / CTO
Connect on LinkedIn →Explore more.
Ready to scale your outreach?
We build GTM engines that book real meetings. See the receipts.
Related articles.
ZoomInfo Renamed Its Ticker to GTM. It Now Trades Under $1B
ZoomInfo took the ticker GTM in May 2025. By late July 2026 it traded under $1B. Here is what the GTM software category is actually worth, with dates attached.
We Burned $430K on Go-To-Market. Here Is What Survived
In 2025 we spent more than $430K testing go-to-market plays. Six survived. Here is what the money bought, what it did not, and what I would do differently.
The 15 Most Valuable AI Companies Founded After ChatGPT
The 15 most valuable AI companies founded after ChatGPT are worth about $160B. The top sales agent company ranks last at $1.2B, and the gap has a cause.
Per-Seat Pricing Is Dying: The Market Is Pricing the Funeral
Six go-to-market software companies lost $224B in 19 months. Every one ships AI, so AI is not the variable. Seat pricing is, and HubSpot proved it publicly.
The Paris AI Map: 23 Companies and $35B
23 AI companies, more than $35B of reported value, and 10 of them inside one 2km circle. Here is the Paris AI map and why the density is the real asset.
We Spent $100K Testing Sales Tech. 8 Layers Survived
There are 4,664 tools in the sales tech market. We spent about $100,000 testing them and kept eight layers, in a fixed order, with one owner each.