SMB Cold Email Benchmarks: 2026 Performance Data
SMB cold email benchmarks by company size, decision-maker title and industry, with the reading habits that stop a benchmark table producing a bad decision.
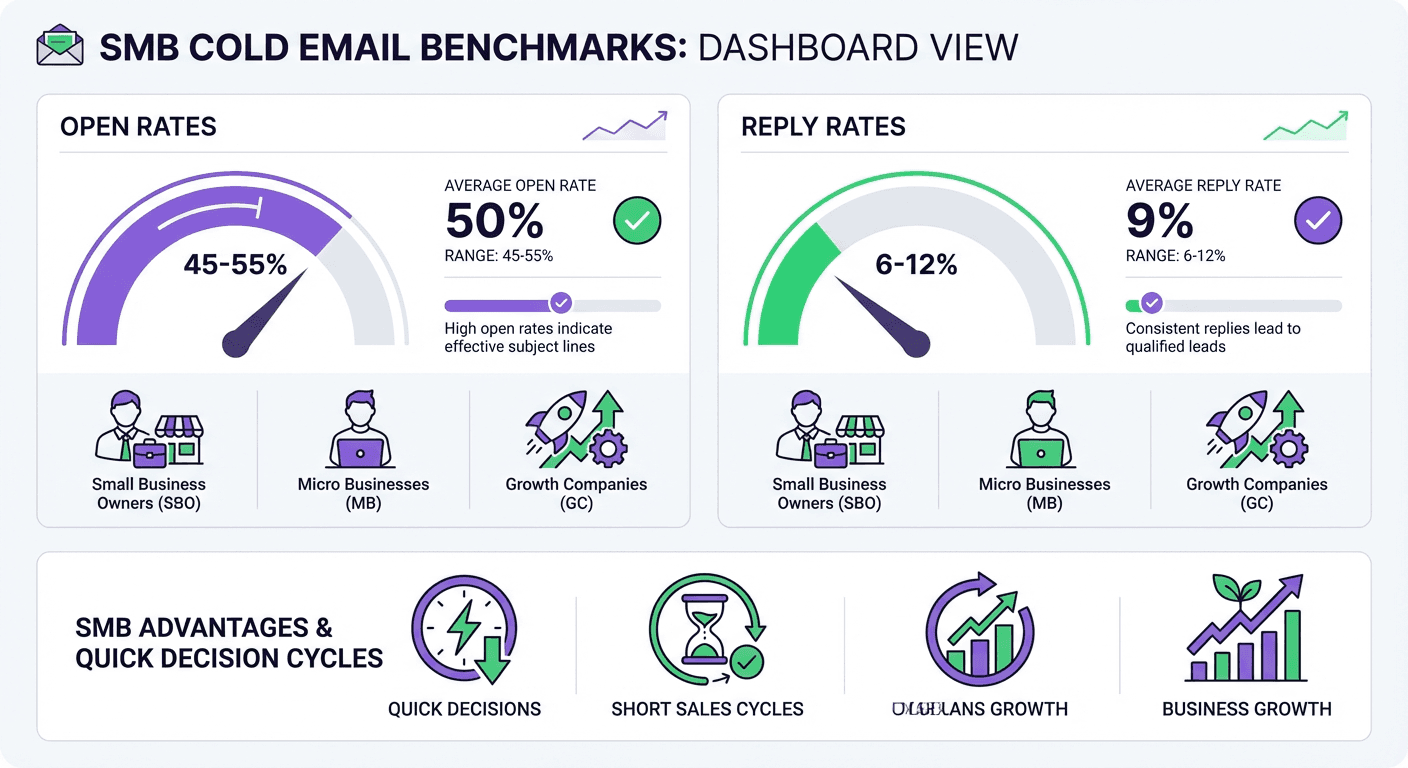
SMB cold email campaigns typically show reply rates from 4 to 15 percent depending on company size, with micro businesses at the top and 51 to 200 employee companies at the bottom. Sales cycles run shorter than enterprise, and bounce rates run higher because small-company email turnover is faster.
Key takeaways
- Company size drives more of the spread in these tables than campaign quality does, so compare against the row matching your list rather than the headline range.
- Owner and founder titles sit at the top of the SMB reply range, and manager titles at the bottom, on the same copy.
- Open-rate figures mix people with privacy proxies that load tracking images automatically, so treat them as directional rather than as a measurement.
- SMB bounce rates run higher than enterprise because small-company email turnover is faster, which makes list verification a deliverability control rather than a nicety.
Reviewed and updated August 28, 2026
SMB Cold Email Benchmarks: 2026 Performance Data
A 5 percent reply rate is a disaster for a micro-business list and a strong result for a 200-person manufacturer. Both numbers describe the same campaign quality; only the audience changed. That is the whole reason segment-specific benchmarks exist, and it is also the reason a benchmark table is dangerous when read as a target rather than as a range.
This report covers cold email performance against small and medium businesses, typically 1 to 200 employees, and the tables below are ranges rather than standards.
About This Data
The benchmarks in this report are compiled from publicly available industry research, aggregated data from sales engagement platforms, and the ranges commonly observed across B2B cold email campaigns targeting SMB companies. They are industry estimates rather than definitive standards, and no figure here is measured from a single controlled study.
Actual results vary with the offer, the industry, the list quality and the execution, and those four move performance further than any benchmark spread suggests. Use these as directional guidance while establishing your own SMB baselines, and treat your own numbers as the standard as soon as you have enough of them.
How to Read a Benchmark Without Being Misled by It
Three habits make the difference between a benchmark that helps and one that produces a bad decision.
Check the denominator before comparing anything. A reply rate over 200 sends and a reply rate over 20,000 sends are not comparable numbers, and at small volumes a single replier moves the rate by percentage points. Before treating a gap against a benchmark as a signal, work out how many replies would have to change to close it. If the answer is two, there is no signal.
Treat open rate as directional at best. Open tracking depends on a loaded image, and mail privacy features load those images automatically, so an open-rate figure is a mixture of people and proxies. The open-rate tables below are useful for relative comparison between segments and close to worthless as an absolute measurement.
Compare like segments. The single largest driver of the spread in these tables is company size and decision-maker seniority, not campaign quality. An owner-operated micro business and a 200-person company with a procurement process respond differently to identical copy, so a blended benchmark hides the thing you actually want to know.
Everything below is organised by segment for that reason. Read the row that matches your list rather than the headline range.
SMB Market Overview
Understanding the SMB landscape helps contextualize performance benchmarks.
SMB Segment Definitions
| Segment | Employee Count | Typical Characteristics |
|---|---|---|
| Micro business | 1-10 | Owner-operated, limited budget |
| Small business | 11-50 | Growing, some specialization |
| Medium business | 51-200 | Established processes, multiple departments |
SMB Email Engagement Characteristics
| Characteristic | SMB Pattern |
|---|---|
| Decision-maker accessibility | High |
| Inbox competition | Medium |
| Response speed | Fast |
| Evaluation process | Simple |
| Budget flexibility | Variable |
| Vendor tolerance | Medium-High |
SMB Open Rate Benchmarks
SMB targets typically show strong email engagement.
Open Rates by Company Size
| Company Size | Typical Open Rate | Notes |
|---|---|---|
| Micro (1-10) | 50% - 65% | Highest engagement |
| Small (11-50) | 45% - 58% | Strong engagement |
| Medium (51-200) | 40% - 52% | More inbox competition |
Open Rates by SMB Industry
| Industry | SMB Open Rate |
|---|---|
| Professional Services | 50% - 62% |
| Construction | 48% - 60% |
| Retail | 42% - 55% |
| Manufacturing | 45% - 57% |
| Healthcare Practices | 43% - 55% |
| Technology | 40% - 52% |
| Real Estate | 50% - 62% |
| Financial Services | 42% - 54% |
SMB Reply Rate Benchmarks
SMB campaigns typically generate higher reply rates than enterprise targeting.
Reply Rates by Company Size
| Company Size | Typical Reply Rate | Notes |
|---|---|---|
| Micro (1-10) | 8% - 15% | Highest responsiveness |
| Small (11-50) | 6% - 12% | Good engagement |
| Medium (51-200) | 4% - 9% | More competing priorities |
Reply Rates by Decision-Maker Type
| Decision-Maker | Reply Rate | Response Pattern |
|---|---|---|
| Owner/Founder | 10% - 18% | Quick, direct decisions |
| CEO | 8% - 14% | Strategic interest |
| VP/Director | 6% - 11% | Operational focus |
| Manager | 5% - 9% | Day-to-day priorities |
Reply Rates by Industry
| Industry | SMB Reply Rate |
|---|---|
| Professional Services | 8% - 14% |
| Construction | 7% - 12% |
| Marketing/Advertising | 6% - 11% |
| IT Services | 5% - 10% |
| Manufacturing | 5% - 9% |
| Healthcare | 4% - 9% |
| Financial Services | 4% - 8% |
| Retail | 5% - 10% |
SMB Conversion Benchmarks
SMB prospects convert differently than enterprise targets.
Bar widths are equal here because these stage values are not a single comparable measure.
Full Funnel Conversion (SMB)
| Stage | SMB Rate | vs. Enterprise |
|---|---|---|
| Email to open | 45% - 55% | +10-15% higher |
| Open to reply | 12% - 20% | +5-10% higher |
| Reply to meeting | 50% - 65% | Similar |
| Meeting to opportunity | 35% - 50% | +5-10% higher |
| Opportunity to close | 20% - 35% | +5-10% higher |
Meeting Conversion Benchmarks
| Metric | SMB Benchmark |
|---|---|
| Email to meeting | 1% - 3.5% |
| Replies to meeting | 45% - 60% |
| Meetings per 1000 emails | 10 - 35 |
Sales Cycle Length
| Company Size | Typical Cycle | Notes |
|---|---|---|
| Micro (1-10) | 7-21 days | Very fast |
| Small (11-50) | 14-45 days | Quick |
| Medium (51-200) | 30-90 days | Moderate |
SMB sales cycles are significantly shorter than enterprise, enabling faster ROI realization.
SMB Sequence Benchmarks
Optimal sequence structure differs for SMB targeting.
- Day 0Value proposition, direct
Email 1
- Day 2-3Social proof, case study
Email 2
- Day 5-6New angle or offer
Email 3
- Day 9-10Question-based
Email 4
- Day 14-15Breakup
Email 5
Sequence Length Performance
| Sequence Length | SMB Reply Rate | Recommendation |
|---|---|---|
| 3 emails | 8% - 12% | Minimum viable |
| 4 emails | 10% - 15% | Good balance |
| 5 emails | 11% - 17% | Optimal |
| 6+ emails | 12% - 18% | Diminishing returns |
SMB prospects respond faster, so shorter sequences often capture most value.
Optimal SMB Sequence Structure
| Timing | Approach | |
|---|---|---|
| Email 1 | Day 0 | Value proposition, direct |
| Email 2 | Day 2-3 | Social proof, case study |
| Email 3 | Day 5-6 | New angle or offer |
| Email 4 | Day 9-10 | Question-based |
| Email 5 | Day 14-15 | Breakup |
Tighter spacing works better for SMB due to faster decision cycles.
Reply Distribution
| Email Position | Share of SMB Replies |
|---|---|
| Email 1 | 35% - 45% |
| Email 2 | 22% - 30% |
| Email 3 | 12% - 18% |
| Email 4 | 8% - 12% |
| Email 5 | 5% - 10% |
SMB reply distribution is more front-loaded than enterprise.
SMB Timing Benchmarks

Optimal timing differs for SMB audiences.
Best Days for SMB Outreach
| Day | SMB Performance | Notes |
|---|---|---|
| Monday | Medium | Start of week, busy |
| Tuesday | Highest | Best day |
| Wednesday | High | Strong performance |
| Thursday | High | Good engagement |
| Friday | Medium | Winding down |
Best Times for SMB
| Time Window | SMB Performance | Notes |
|---|---|---|
| 7-9 AM | High | Before meetings |
| 9-11 AM | Highest | Peak engagement |
| 11 AM-1 PM | Medium | Lunch variability |
| 1-3 PM | Medium | Afternoon work |
| 3-5 PM | Medium-Low | Day winding down |
| After 5 PM | Higher than enterprise | Owners work late |
SMB owners and decision-makers often check email outside traditional business hours.
SMB Messaging Benchmarks
Messaging approaches that resonate with SMB prospects.
Effective SMB Value Propositions
| Value Prop Type | Reply Rate Impact |
|---|---|
| Time savings | +25% - 40% |
| Cost reduction | +20% - 35% |
| Revenue increase | +30% - 45% |
| Simplification | +20% - 35% |
| Competitive advantage | +15% - 30% |
SMB Pain Point Resonance
| Pain Point | Resonance Level |
|---|---|
| Limited time/resources | Very High |
| Cash flow management | High |
| Growth challenges | High |
| Competition pressure | Medium-High |
| Technology complexity | Medium |
| Hiring/retention | Medium-High |
Subject Line Performance (SMB)
| Subject Line Type | SMB Open Rate |
|---|---|
| Direct question | 52% - 65% |
| Company name included | 50% - 62% |
| Time/money savings | 48% - 60% |
| Peer reference | 55% - 68% |
| Generic sales pitch | 30% - 42% |
SMB Personalization Benchmarks
Personalization impact on SMB campaigns.
Personalization Level Impact
| Level | SMB Reply Rate | Effort |
|---|---|---|
| None | 3% - 5% | Low |
| Basic (name, company) | 5% - 8% | Low |
| Moderate (industry, size) | 7% - 11% | Medium |
| High (business research) | 10% - 16% | High |
Effective SMB Personalization Elements
| Element | Reply Rate Lift |
|---|---|
| Specific business observation | +40% - 60% |
| Local reference (city, region) | +20% - 35% |
| Industry-specific pain point | +30% - 50% |
| Recent business news | +35% - 55% |
| Mutual connection | +50% - 80% |
SMB Deliverability Considerations

SMB email infrastructure creates unique deliverability factors.
SMB Email Provider Distribution
| Provider Type | Approximate Share |
|---|---|
| Google Workspace | 40% - 50% |
| Microsoft 365 | 25% - 35% |
| GoDaddy/Hosting | 10% - 15% |
| Other | 10% - 20% |
SMB-Specific Deliverability Factors
| Factor | SMB Impact |
|---|---|
| Less sophisticated spam filtering | Higher inbox rates |
| Smaller inboxes | Less competition |
| Less email security training | Fewer spam reports |
| Catch-all domains more common | Higher bounce risk |
Bounce Rate Benchmarks (SMB)
| Company Size | Typical Bounce Rate |
|---|---|
| Micro (1-10) | 4% - 8% |
| Small (11-50) | 3% - 6% |
| Medium (51-200) | 2% - 4% |
SMB lists often have higher bounce rates due to business turnover and less stable email infrastructure.
SMB ROI Benchmarks
Understanding SMB-specific ROI characteristics.
Cost Metrics
| Metric | SMB Benchmark |
|---|---|
| Cost per meeting | $50 - $200 |
| Cost per opportunity | $150 - $500 |
| Customer acquisition cost | $300 - $1500 |
Deal Size Considerations
| Deal Size | Close Rate | Typical Timeline |
|---|---|---|
| Under $1K | 30% - 45% | 7-14 days |
| $1K - $5K | 25% - 40% | 14-30 days |
| $5K - $15K | 20% - 35% | 30-60 days |
| Over $15K | 15% - 30% | 45-90 days |
SMB ROI Calculation
| Metric | Example Value |
|---|---|
| Emails sent | 5,000 |
| Cost per email | $0.10 |
| Total cost | $500 |
| Meetings booked | 50 (1%) |
| Deals closed | 12 (24%) |
| Average deal | $3,000 |
| Revenue | $36,000 |
| ROI | 71x |
SMB campaigns can generate exceptional ROI due to higher conversion rates and lower costs.
SMB Challenges and Considerations
Common SMB Challenges
| Challenge | Mitigation Strategy |
|---|---|
| Higher churn rate | Focus on LTV, not just acquisition |
| Smaller deal sizes | Volume approach, efficiency focus |
| Less formal processes | Adapt messaging, be direct |
| Budget constraints | Emphasize ROI, flexible pricing |
| Time-poor decision makers | Keep messaging concise |
SMB Qualification Factors
| Factor | Why It Matters |
|---|---|
| Business age | Stability indicator |
| Growth signals | Budget availability |
| Technology adoption | Buying readiness |
| Team size trends | Investment capacity |
| Industry health | Market conditions |
Best Practices for SMB Cold Email
SMB-Specific Strategies
| Strategy | Implementation |
|---|---|
| Be direct | Skip lengthy intros |
| Focus on outcomes | Concrete results |
| Use peer examples | Similar size companies |
| Offer quick wins | Fast implementation |
| Price appropriately | SMB budget sensitivity |
Avoiding SMB Pitfalls
| Pitfall | Prevention |
|---|---|
| Enterprise-style messaging | Adapt tone and length |
| Complex value propositions | Simplify benefits |
| Long sales processes | Streamline qualification |
| Overcomplicating | Keep it simple |
| Ignoring budget signals | Qualify early |
Setting SMB Campaign Goals

Based on industry benchmarks, here are realistic SMB targets:
| Metric | Conservative | Ambitious |
|---|---|---|
| Open rate | 45% | 55%+ |
| Reply rate | 6% | 12%+ |
| Meeting rate | 1% | 2.5%+ |
| Close rate | 20% | 35%+ |
| ROI | 30x | 60x+ |
Where These Benchmarks and Our Own Practice Diverge
The sequence tables above describe what the industry does, which is a multi-step cadence ending in a breakup email. They are reported here because they are the published pattern, and it is worth being explicit that RevenueFlow does not run it.
RevenueFlow sends one message per campaign, with no bump sequences and no thread replies, on the view that a second message landing underneath the one somebody ignored reads as a bump whatever the campaign structure calls it. Re-contacting a non-replier happens later as a fresh single-message campaign rather than as step two of a cadence.
That changes how to read the reply-distribution table. For a one-message programme, the share attributed to Email 1 is the whole result, and the remaining share is what a multi-step programme buys by messaging people who already chose not to answer. Whether that trade is worth making is a judgement about brand and inbox reputation rather than a number in a benchmark table, and RevenueFlow has settled it in one direction.
It also changes what a low reply rate means. In a one-message programme there is no later email to rescue a weak first one, which puts more weight on the offer and the list and less on sequence design. That is the same conclusion the volume tables point at from the other direction.
- The first-email share of replies is the whole result
- No second message lands under an ignored one
- Weight falls on the list and the offer
- Re-contact is a fresh campaign, not step two
- Five emails between Day 0 and Day 14-15
- Later emails add replies from people who did not answer
- Reply share is front-loaded but spread across steps
- Brand and reputation cost is not in the benchmark
- Company size drives more spread than copy does
- Owner and founder titles reply at the top of the range
- Open rate is a mixture of people and privacy proxies
- Bounce risk rises with SMB list turnover
What to Measure Instead of Reply Rate
Every table in this report is an input metric, and input metrics are worth tracking and worth being suspicious of.
The number that pays is held meetings with people who fit criteria agreed in writing before launch. RevenueFlow's standard covers audience fit, whether the participant has real responsibility for the relevant area, agreement to a genuine business conversation, attendance, and the account not having been excluded up front. Budget, timing and decision authority are deliberately not qualification conditions, because a prospect without budget this quarter is a real conversation rather than a failed one.
That matters for SMB specifically. The tables above show SMB reply rates running higher than enterprise, and a higher reply rate with the same meeting count is not an improvement. Watch the reply-to-meeting conversion in the funnel section rather than the reply rate on its own, because that is where a list of curious non-buyers shows up.
The same applies to the ROI table below, which is a worked illustration rather than a measured outcome. Substitute your own average deal size and close rate before believing any multiple it produces.
Optimizing SMB Cold Email Performance
SMB markets offer exceptional cold email opportunity due to accessible decision-makers, shorter sales cycles, and higher engagement rates. The key is adapting your approach to SMB-specific dynamics while maintaining the fundamentals of good cold email practice.
If you want to improve your SMB cold email performance or need help building campaigns for small business markets, our team specializes in creating effective outreach programs for B2B companies.
Get a free campaign audit and see how your current SMB performance compares to industry benchmarks. We will identify specific opportunities to improve your targeting, messaging, and conversion rates.
Related Reading
Frequently asked questions.
Frequently asked questions- What reply rate should I expect from SMB cold email?
- It depends mostly on company size. The ranges here put micro businesses of 1 to 10 employees at the top and 51 to 200 employee companies at the bottom, with decision-maker seniority moving it further. These are industry estimates rather than measured standards, so establish your own baseline as soon as you have enough sends to compute one.
- Why are SMB bounce rates higher than enterprise?
- Small companies turn over staff and email infrastructure faster, and catch-all domains are more common, so a list decays more quickly between sourcing and sending. That makes verification a deliverability control rather than a nicety, since bounces damage sender reputation across every campaign sharing that infrastructure.
- Can I trust the open-rate benchmarks?
- Only as a relative comparison between segments. Open tracking relies on a loaded image, and mail privacy features load those images automatically, so any open-rate figure is a mixture of people and proxies. Use reply rate and meeting rate as the real signals, and treat open rate as a rough directional read.
- Do these sequence benchmarks match how RevenueFlow sends?
- No, and that is stated deliberately. The sequence tables describe the published industry pattern of a multi-step cadence ending in a breakup email. RevenueFlow sends one message per campaign with no bumps or thread replies, so the first-email share of replies is the whole result rather than the start of one.
About the author.

Hosun Chung is COO at RevenueFlow, which builds and operates outbound revenue engines for B2B companies. Previously at Gleacher Shacklock LLP. Studied at London School of Economics.
Hosun Chung · COO
Connect on LinkedIn →Explore more.
Ready to scale your outreach?
We build GTM engines that book real meetings. See the receipts.
Related articles.
Cold Email Spam Rate Benchmarks: 2026 Performance Data
Industry standards require keeping spam complaint rates below 0.1% to maintain sender reputation. Learn the benchmarks and strategies to protect your cold email deliverability.
Cold Email Follow-Up Benchmarks: 2026 Performance Data
The follow-up benchmarks kept intact and read against their own definitions, plus why RevenueFlow sends one message per campaign instead.
Cold Email Bounce Rate Benchmarks: 2026 Performance Data
A 3.04% platform bounce rate held 1.27% true hard bounces, 2.38% with blocks included, and 12.6% delay notices. What low bounce email data is made of.
Cold Email Subject Line Benchmarks: 2026 Performance Data
Industry data reveals that subject lines determine 35-50% of open rate variation. Discover the benchmarks for length, personalization, and format that drive the highest engagement.
Cold Email Personalization Benchmarks: 2026 Performance Data
LeadMagic, Cognism, Explorium and others sell funding and competitor signals. What published data ties to higher reply rates, and how to turn a signal into a line.
Cold Email Sequence Benchmarks: 2026 Performance Data
Every industry sequence figure, kept intact and read honestly: the opening message produces 30-40% of replies, and here is what the rest of them cost.