Time Decay Attribution: Setting the Half-Life
Time decay weights recent touches more heavily, and the half-life that controls how fast credit fades decides more than the choice of model does.
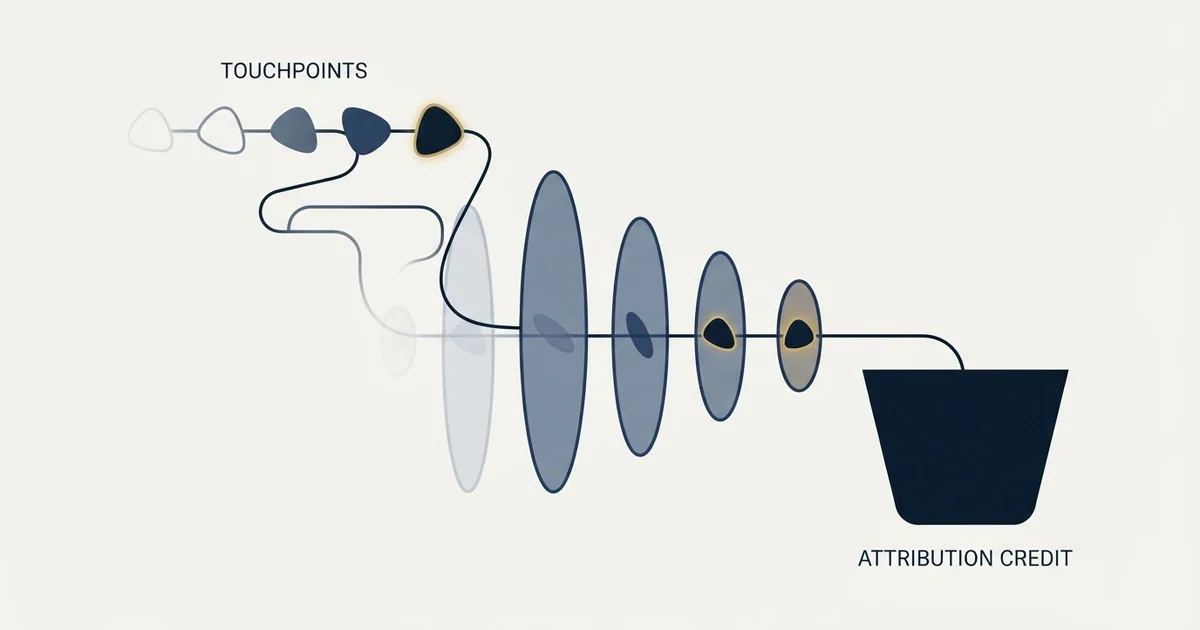
Time decay attribution weights each touchpoint by how recently it happened, with the fall-off set by a half-life. Linear is the same rule with the decay switched off, giving every touch equal credit. On a ninety-day B2B cycle a seven-day half-life effectively deletes early touches, so set it against your own median cycle length.
Key takeaways
- The half-life is the interval over which a touch loses half its weight, and it is the setting that decides what a time decay model reports.
- Linear attribution is the flat case of the same rule, weighting every touch identically regardless of order or timing.
- A custom model needs enough closed deals per segment to justify its weights and a named owner for the definition, or it is arithmetic rather than measurement.
- Google's help pages state that linear, time decay, first click and position-based models were removed from its own products in November 2023.
Reviewed and updated October 1, 2026
Two attribution rules sit at opposite ends of one spectrum, and almost every argument about which to use is really an argument about a single number nobody writes down. Linear attribution splits credit evenly across every touch in a journey. Time decay splits it unevenly, giving more to the touches nearer the conversion. The distance between them is a decay rate, and on a long B2B sales cycle the default value of that rate does more damage than the choice of model does.
The rule, and the number underneath it
Time decay assigns weight to each touchpoint according to how recently it happened. A touch on the day of the conversion carries the most weight, a touch a month earlier carries less, and the fall-off is exponential rather than linear.
The shape of the fall-off is set by a half-life: the interval over which a touch loses half its weight. A seven-day half-life means a touch fourteen days before the conversion counts a quarter as much as one on the day itself, and a touch twenty-one days before counts an eighth as much.
Linear is the flat case of the same idea. Set the fall-off to nothing and every touch carries identical weight, which is what linear attribution does: four touches, twenty-five percent each, regardless of order or timing.
- Every touch weighted identically
- Order and timing discarded
- Simple to explain to a board
- Assumes contribution is uniform, which it rarely is
- Recent touches weighted more
- Order and timing preserved
- Half-life is a real setting with a real default
- Systematically undercredits demand creation
- Any rule you can specify and defend
- Needs enough journeys to justify the weights
- Needs somebody to own the definition
- Usually starts as one of the two on the left
Why the half-life is the whole decision
The commonly cited default for a time decay half-life is seven days, inherited from web analytics tools built for ecommerce, where a purchase journey often runs from first ad to checkout inside a fortnight. On that shape, a seven-day half-life is a reasonable description of how influence fades.
Now hold the setting still and change the business. A B2B deal with a ninety-day cycle has touches spread across three months. Under a seven-day half-life, a touch ninety days out carries roughly one eight-thousandth of the weight of a touch on the closing day. That is not a de-emphasis of early demand creation. It is a deletion of it, expressed as a decimal small enough that nobody notices it in the report.
The arithmetic below is illustrative and the numbers are invented to show the shape of the curve rather than to describe any real programme.
The reference weight
One half-life back
Five half-lives back
Roughly a ninety day cycle
So the useful move is not to reject time decay. It is to set the half-life against the actual length of your cycle. A programme whose median time from first touch to close is ninety days needs a half-life measured in weeks rather than days, and a team that has never looked at its own median has no basis for any setting at all.
That number is available and cheap to get. It is the same measurement that defines a sales cycle, and most CRMs will produce it from the deals already closed.
Where linear is the better answer
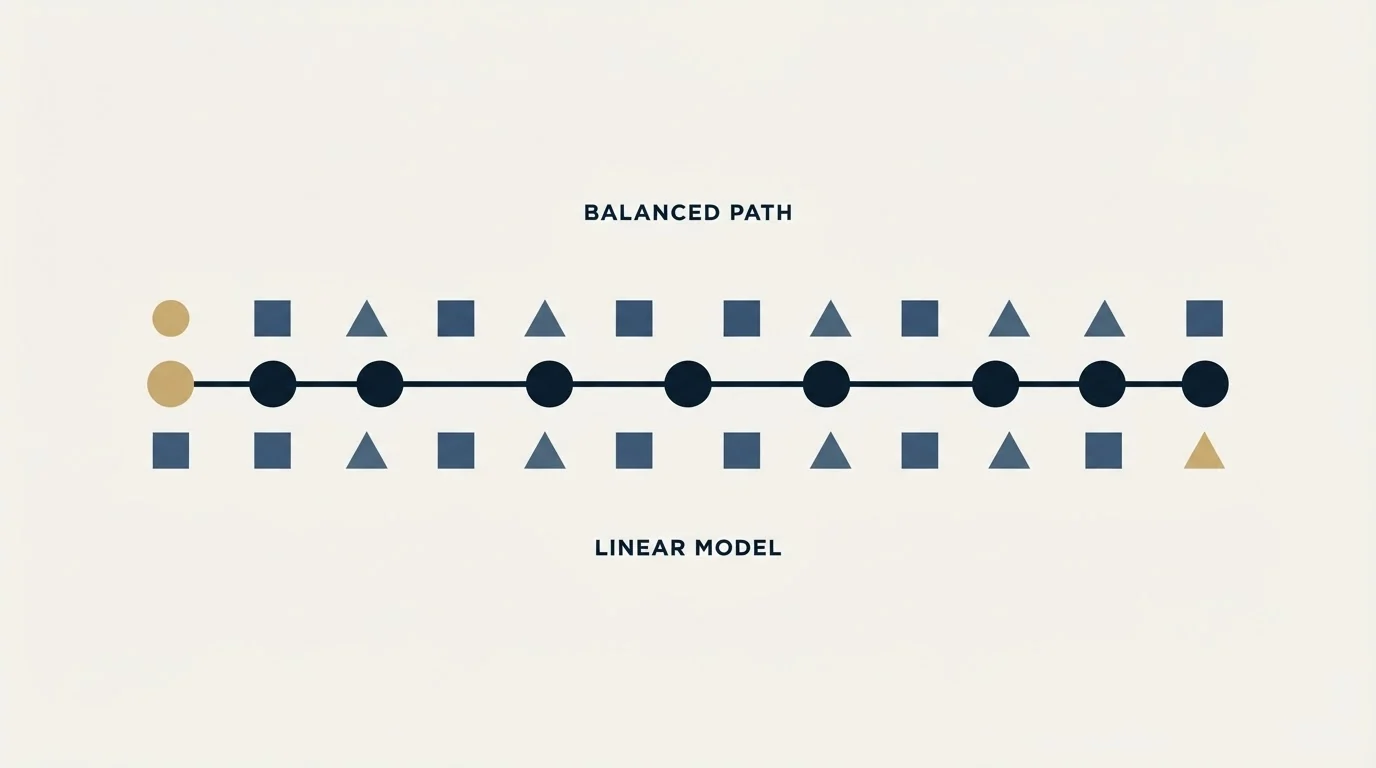
Linear attribution gets dismissed as naive, usually by vendors selling something more sophisticated. It has two genuine advantages that survive the criticism.
It cannot be gamed by timing. Every weighted model creates an incentive to insert a touch at the moment the weights are highest, which for time decay means a low-effort touch immediately before an expected close. Linear is indifferent to when a touch happens, so there is no position to engineer.
And it is auditable by anybody. A marketing lead can check a linear calculation by hand on one deal. Nobody checks an exponential decay by hand, which means nobody checks it, which means an error in the implementation can survive a very long time.
The cost is real too: linear asserts that a webinar attended in March contributed exactly as much as the call that closed the deal in June, and that assertion is usually false. The honest framing is that linear trades accuracy for auditability, and on a small dataset that trade is often correct, because the accuracy was never available in the first place.
Custom models, and the threshold below which they are theatre
A custom attribution model is any rule you set yourself: your own weights, your own milestone definitions, sometimes different rules for different segments. The platforms support it. Several attribution and analytics products expose a place to define one, and the B2B attribution tools are built around the idea.
The argument for it is genuine. Enterprise deals and self-serve deals have different journey lengths, so a single weighting is wrong for at least one of them, and a custom model can carry both.
The argument against it is the one the vendor pages tend to bury: a custom model is a hypothesis about influence, and a hypothesis needs enough observations to be worth testing. A team with two hundred closed deals splitting them across three segments and eight channels is estimating dozens of weights from a few dozen data points each. The output will be stable to two decimal places and mean nothing.
Three conditions are worth insisting on before building one.
Enough journeys per segment to see a pattern. If a segment has fewer closed deals than it has channels, it does not get its own model.
A named owner for the definition. A weighting scheme with no owner drifts, because every quarter somebody proposes a small change and nobody is accountable for what the series then means. The same failure destroys pipeline reporting when nobody owns the stage definitions.
A stated reason for every weight. A weight that exists because it made a channel look better is not a model, and this is the failure mode custom attribution is most prone to, because it is the only model where the person choosing the weights also owns the result.
What this looks like on an outbound programme specifically
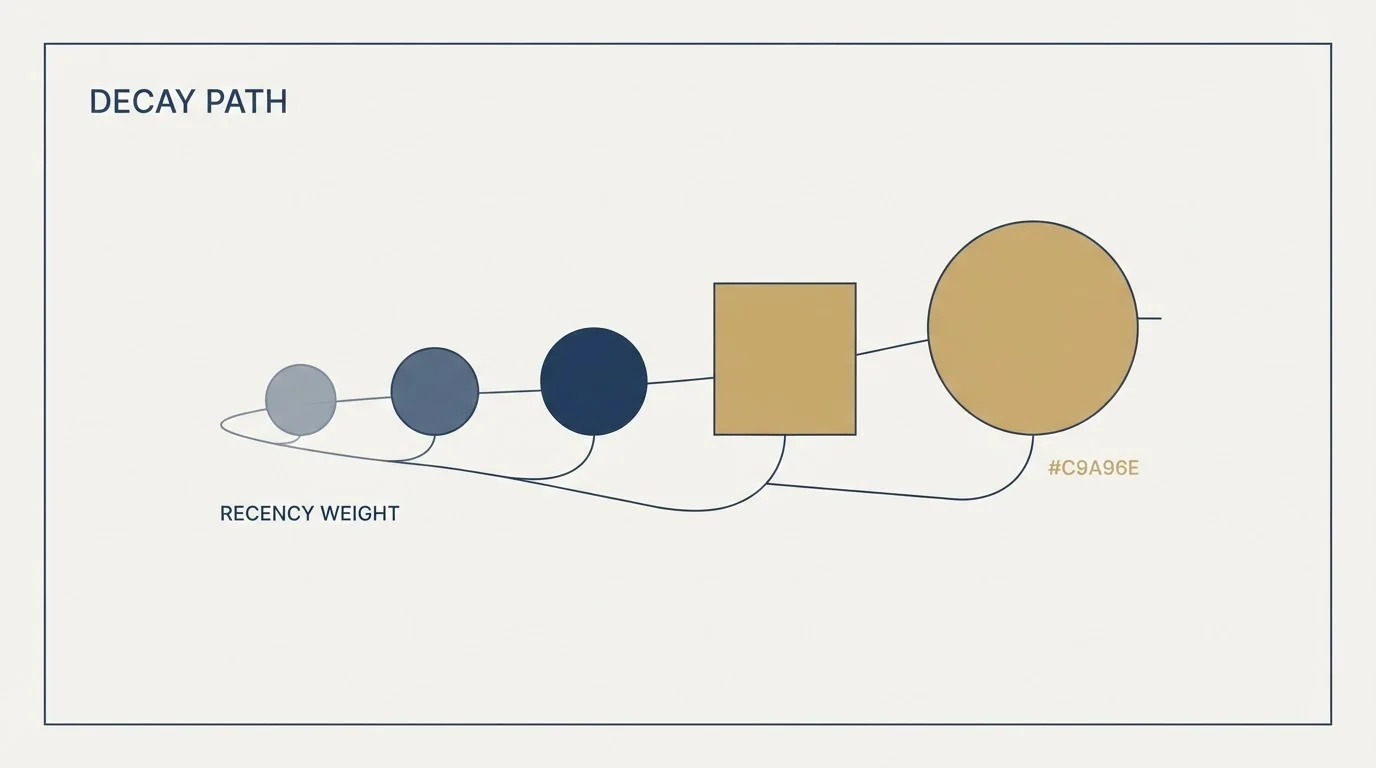
Outbound sits awkwardly in every weighted model, for a structural reason. The touch that produces a reply is a single message, so an outbound programme generates few touchpoints and generates them late. Under time decay it looks excellent. Under linear it looks worse than it is, because a channel with one touch per journey is compared against channels with six.
The correction is not a different weighting. It is to record the work that precedes the touch as something other than a touch: which list a contact came from, which segment, which offer. Those attributes are set upstream, during the enrichment waterfall that resolves an address in the first place. They are attributes of the contact rather than events in a journey, and no attribution model reads them, which is why a programme that grades its channels by attribution alone keeps concluding that the list is free.
House practice here is deliberately narrow. Campaigns carry one message rather than a sequence, so there is no cadence of touches to weight in the first place. That makes the attribution question simpler and the list quality question the one that actually decides the result.
- Step 1Measure your median cycle length
From first recorded touch to closed won, on deals you have already closed
- Step 2Count touches per journey
A motion with one touch per deal cannot be weighted meaningfully against one with ten
- Step 3Set the half-life against the cycle, not the default
Weeks for a quarter-long cycle, days only for a genuinely short one
- Step 4Choose linear if you cannot defend a decay rate
An auditable approximation beats an unauditable one nobody checks
- Step 5Revisit only when the cycle length moves
Changing weights for any other reason breaks the comparison with last quarter
The platform reality worth checking first
Before designing any of this, confirm the model exists where you plan to use it. Google's Analytics help page states that "the first click, linear, time decay, and position-based attribution models are no longer available as of November 2023", and the Google Ads help page says the same models are "no longer supported by Google", with affected conversion actions having "been upgraded to use data-driven attribution".
That deprecation covers Google's own products only. Time decay, linear and custom weighting are all still configurable in the B2B attribution and CRM-based tools, which is where a company measuring pipeline rather than transactions is usually working. But a plan written from a third-party article describing how to switch Google Analytics to time decay will not survive contact with the product, and a surprising number of those articles are still ranking.
The short version

Time decay weights recent touches more heavily, with the rate of fall-off set by a half-life, and linear is the same rule with the decay switched off. The half-life default of seven days comes from short ecommerce journeys and effectively erases early touches on a ninety-day B2B cycle, so set it against your own median cycle length or accept that the model is deleting the top of your funnel. Custom models are worth building only where each segment has enough closed deals to justify its own weights and somebody owns the definition. Inside Google's products these rule-based models were removed in November 2023, so check the platform before designing around them.
For a view of what an outbound programme would produce before any of this needs deciding, see what a campaign would look like for your market. If the question is which single touch gets the credit today, that is last-touch attribution, and it has its own failure mode.
Google attribution model behaviour verified against Google's own Analytics and Google Ads help pages, fetched mid-2026. The weighting arithmetic in this article is illustrative and invented. Verify current platform behaviour before relying on it.
Sources: Google Analytics: About attribution and attribution modeling, Google Ads: About attribution models
Frequently asked questions.
Frequently asked questions- How does time decay attribution calculate credit?
- Each touchpoint is weighted by how long before the conversion it happened, with weight falling exponentially as the touch recedes. The rate of fall is set by a half-life: the interval over which a touch loses half its weight. A touch two half-lives back carries a quarter of the weight of one on the conversion day.
- What half-life should a B2B company use?
- Set it against your own median time from first touch to closed won rather than accepting a default. Short defaults come from ecommerce journeys that run in days. On a ninety-day sales cycle, a seven-day half-life leaves an early touch carrying a weight so small it is effectively deleted, which removes demand creation from the report entirely.
- Is linear attribution better than time decay?
- Linear is more auditable and cannot be gamed by timing, because it is indifferent to when a touch happened. Time decay is usually a better description of influence but relies on a decay rate somebody has to defend. On small datasets the accuracy time decay offers was never available, so linear is often the honest choice.
- When is a custom attribution model worth building?
- When each segment you want to model separately has more closed deals than it has channels, when one person owns the weight definitions, and when every weight has a stated reason. Without those three, a custom model produces a stable-looking number from too few observations, and the person choosing the weights usually owns the result they produce.
About the author.

Ben Carden is CRO at RevenueFlow, which builds and operates outbound revenue engines for B2B companies. Previously at Gartner Enterprise. Studied at London School of Economics.
Ben Carden · CRO
Connect on LinkedIn →Explore more.
Ready to scale your outreach?
We build GTM engines that book real meetings. See the receipts.
Related articles.
Last-Touch Attribution: What It Credits, and What It Deletes
Last-touch gives every point of credit to the final interaction, which in outbound is the email that got the reply rather than the work that earned it.
Position-Based Attribution: The U, the W and the Timestamp
U-shaped and W-shaped attribution are one model with a switch, and the switch is whether your CRM can be trusted to stamp lead creation.
Cross-Sell vs Upsell: Different Trigger, Different Owner
An upsell has a trigger that arrives on its own. A cross-sell has none and needs a diagnosis somebody funds. That is the difference that decides the work.
Sales Call Planning: The Plan a Booked Call Needs
A call cannot produce a commitment nobody named in advance. The four fields a call plan carries, and why the ask has to be decided before the meeting opens.
Lifecycle Stage, Lead Status, Deal Stage: Three Fields
Lifecycle stage records position, lead status records activity, and deal stage lives on the deal. Merging them breaks funnel reporting in ways nobody notices for a year.
The JOLT Effect: Selling to a Buyer Who Cannot Decide
The loss that shows no competitor and no rejection. What the JOLT research names, why the standard urgency playbook makes it worse, and the four moves that answer it.