CRM Analytics: The Layer Above the Reports
CRM analytics is the derived layer over the records in a CRM. A report returns one set of records against one filter; analytics compares sets against each other, across time and against an outcome. It sorts into descriptive, diagnostic, predictive and prescriptive work, and each rung demands more of the records than the one above it.
Key takeaways
- A report answers the question it was defined for; an analysis claims a relationship between two queries, and it fails when the populations do not correspond.
- The four kinds of analytical question ask progressively more of the records, and most teams describe a prescriptive want while owning descriptive data.
- Diagnostic work is impossible unless the segment and the premise were stamped on the record at the time of the approach.
- Analytics over an outbound programme reads an empty channel as a channel that produced nothing when the sending platform never wrote outcomes back.
CRM analytics is the derived layer that reads the records in a CRM to answer questions no single saved report can answer: which segments convert, where deals stall, and what the open pipeline implies about the period ahead. A report returns one set of records against one filter; analytics compares sets, across time, against each other and against an outcome.
Holding that distinction is the whole value of the term, because the two layers are sold as one product and they fail for different reasons. A report is wrong when its filter is wrong, which is visible to anyone who opens the definition. An analysis is wrong when the underlying records were never capable of supporting the comparison, and nothing in the interface says so.
Where the line between a report and an analysis sits
A CRM report is a saved query: a filter deciding which records count, a set of fields, a grouping and a time window. Ask it a question it was defined to answer and it answers correctly. Ask it anything else and you get a different report.
Analytics is what happens when two or more of those queries are put next to each other and a claim is made about the relationship. Conversion between stages is a ratio of two counts. Time in stage is a distribution rather than a number. Segment performance is a set of ratios compared against each other. A forecast is a projection built from records whose fields were entered by the people the records describe.
That is why analytical work carries a class of error reporting does not. Two counts can each be correct and their ratio still meaningless, because they were taken over populations that do not correspond. A win rate computed over deals created in a period, divided by deals closed in the same period, mixes two cohorts and produces a number that moves when nothing changed except the pace of creation.
- A filter, fields, a grouping and a time window
- Answers the question it was defined to ask
- Wrong when the filter is wrong, and the filter is readable
- Two reports sharing a name over different filters disagree correctly
- Fixed by editing a definition
- Ratios, distributions, trends, cohorts and projections
- Answers a question no single query was defined for
- Wrong when the two populations do not correspond
- A correct numerator over the wrong denominator looks entirely normal
- Fixed upstream, at capture, or not at all
The practical consequence is that adding an analytics module to a CRM whose records are thin produces confident charts rather than better decisions. The module is doing exactly what it says. It is the correspondence between the records and the question that was never established.
The four questions, in the order they get harder
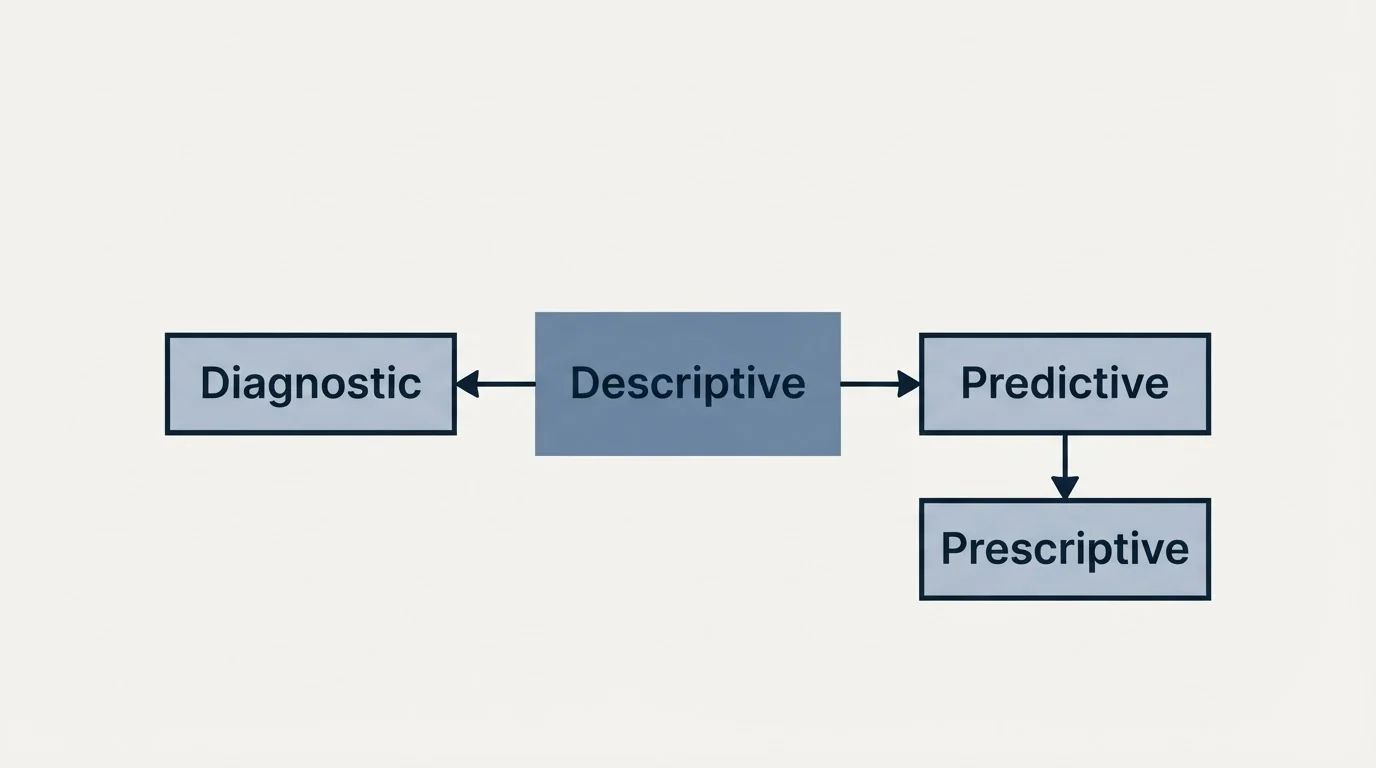
Vendor material sorts CRM analytics into four kinds, and the sort is useful because each kind demands something more of the data than the one before it.
Descriptive analytics says what happened. Deals created, meetings held, revenue closed, all grouped by something. This is the layer nearest to plain reporting, and the one an ordinary implementation already has. It requires only that the records exist.
Diagnostic analytics says why it happened. It compares a segment that worked against one that did not, or a period against the period before it, and looks for the difference. It requires that the records carry the attribute you want to compare on, which is the first place an implementation tends to stop, because nobody stamped the segment or the premise onto the record at the time.
Predictive analytics says what is likely to happen next. Stage-weighted forecasting is the ordinary version; a fitted model over historical deal attributes is the ambitious one. It requires a history long enough and stable enough that the past resembles the future, which a company that changed its market or its motion last year does not have.
Prescriptive analytics says what to do about it. In practice this is a recommendation surfaced in the interface, such as a next best action or a deal at risk. It requires everything the previous three require plus a stated action set, and it is the layer where a wrong answer costs the most because it is acted on rather than read.
- Step 1Descriptive
What happened. Needs the records to exist and be grouped by something.
- Step 2Diagnostic
Why it happened. Needs the comparison attribute stamped on the record at the time.
- Step 3Predictive
What happens next. Needs a history stable enough that the past resembles the period ahead.
- Step 4Prescriptive
What to do. Needs all three plus a written action set somebody will follow.
A team shopping for CRM analytics almost always describes a prescriptive want and owns descriptive data. Naming which of the four rungs is actually in reach is the cheapest hour in the whole project.
What the analytical layer assumes about the records
Three preconditions decide whether any of this returns something worth reading, and none of them is a feature you can buy.
The attribute has to be on the record at the time. Diagnostic work compares cohorts, and a cohort exists only if something on the record identifies it. If the campaign, the segment and the premise a contact was approached on are not written to the record when the approach happens, no later analysis can recover them. The comparison is not hard, it is impossible, and the interface will still draw a chart of something else.
The fields have to mean one thing. A field arriving in six spellings from three sources produces a grouping with six buckets where there is one real category. That is a data hygiene problem at the field level rather than a CRM-wide cleanup, and the fields worth fixing are the small set that a segment query actually filters on.
The outcomes have to arrive. Analytics over an outbound programme is analytics over sends, replies, bounces, opt-outs and meetings, and those events happen in a sending platform. If they never reach the CRM against the right record, the analysis reads an empty channel as a channel that produced nothing. Nothing in the dashboard announces the absence. The write-back path that decides this is set out in CRM setup for an outbound team, and the engineering constraints on it are in CRM integration.
The order matters. Enrichment and reporting features are usually bought first because they demo well. The precondition list runs the other way: capture, then field discipline, then the comparison.
What an outbound team actually reads
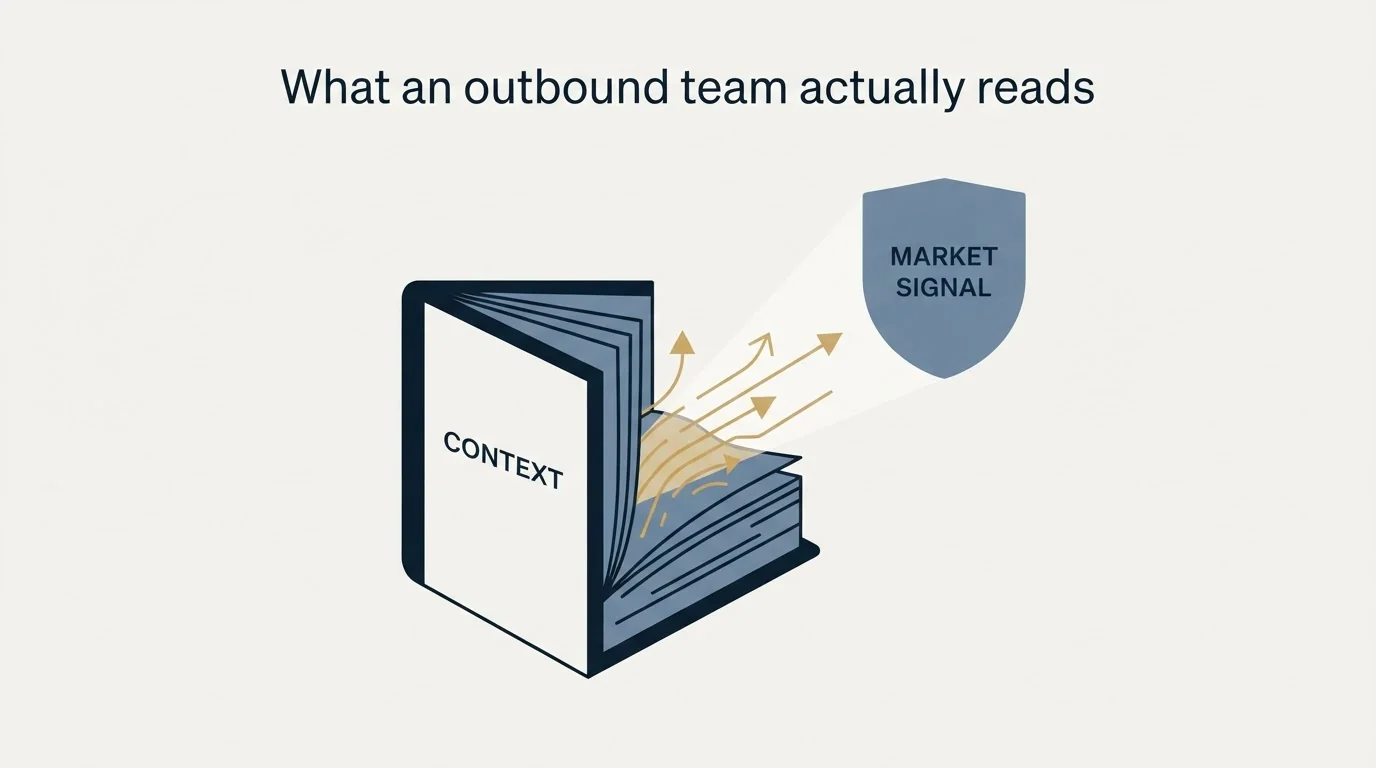
Most published CRM analytics material is written for an account team managing existing customers. For a team running cold outreach the useful questions are narrower and there are four of them.
Which segment answers. Reply and meeting rate grouped by the firmographic slice the list was built on. This is the number that decides what the next campaign targets, and it exists only if the slice is stamped on the record. The attribute classes it can be cut by are covered in firmographic data.
Which premise answers. The same outcome grouped by the reason the message gave for writing. Segment and premise are two separate cuts and they are routinely collapsed into one, which is how a team concludes that a market is dead when one premise was weak.
Where the conversation stops. A distribution of how far replies travel before they end, read against your own converted history rather than in absolute days. What a record has to contain for this to be computable at all is in sales activity tracking.
What the open pipeline is claiming. Every open deal carries a value, a close date and a stage that somebody typed. Predictive work over those fields is prediction over claims, which is the caveat in sales forecast and the reason pipeline management in a CRM treats stage exit criteria as the real instrument.
Two of those four are cuts nobody sells as an analytics feature, because they depend on data an outbound programme has to write itself. That is the honest version of the CRM analytics promise for this reader: the capability is ordinary, and the constraint is what got captured.
Where the definition oversells
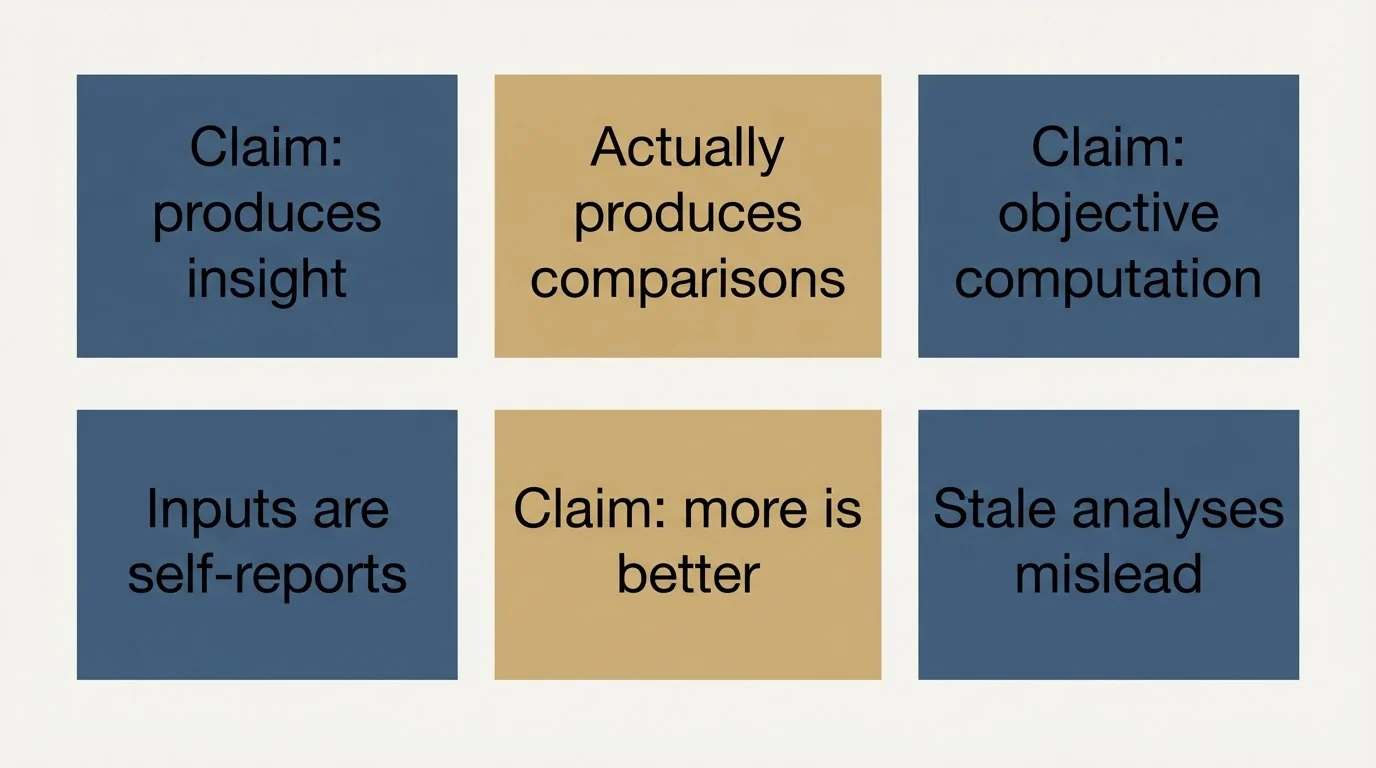
Three claims travel with the term and each needs a qualifier.
That it produces insight. It produces comparisons. Whether a comparison is an insight depends on whether anybody had a decision waiting for it. A dashboard assembled without a decision in mind is a dashboard that gets opened for a fortnight.
That it is objective because it is computed. The inputs to a pipeline analysis are claims made by people who are measured on them. Computation does not launder that. It is why the discipline that makes the numbers honest sits at the stage-transition rule and at data entry rather than in the analytics layer.
That more of it is better. Every saved analysis is a definition somebody may quote in a meeting a year from now, and an old one over a population nobody remembers is worse than none. Prune analyses on the same schedule as fields.
The useful test before building anything is to write down the decision the output will change and who makes it. An analysis that cannot name that pair is a chart.
And when the comparisons are clean and the answer is that there is not enough at the top of the funnel to compare, the constraint is supply rather than analysis. No model produces accounts.
Related terms and guides
CRM reporting is the query layer underneath this one and the four saved queries worth building first. CRM basics is the object model every one of those queries runs over. Data hygiene covers the field-level maintenance the comparisons depend on, CRM enrichment covers filling the attributes a segment cut needs, and sales forecast covers what the predictive family is actually estimating. Lead scoring is the most common prescriptive output, and what a single number destroys on the way is worth reading before one is built.
On the build side, CRM setup for an outbound team covers the objects, the required fields and the write-back loop that decides which comparisons are possible, CRM integration covers the sync layer that carries the outcomes back, sales activity tracking covers what a logged activity has to contain, pipeline management in a CRM covers making the pipeline fields worth analysing, and SDR metrics covers which of the resulting numbers a rep can actually be held to.
If the analysis is clean and the answer is an empty top of funnel, see what a first campaign produces against your market.
Frequently asked questions.
Frequently asked questions- What is CRM analytics?
- The derived layer that reads the records in a CRM and makes a claim about the relationship between two or more queries: a conversion ratio, a distribution of time in stage, a cohort comparison, or a projection of the open pipeline. A saved report answers one defined question. Analytics answers questions no single report was built for, which is where its extra failure class comes from.
- What is the difference between CRM analytics and CRM reporting?
- Reporting is the query layer: a filter, a set of fields, a grouping and a time window. Analytics is the comparison layer built on top of several such queries. The difference matters because they break differently. A report breaks at its own definition, which is readable. An analysis breaks when the numerator and denominator were taken over populations that do not correspond, and nothing in the chart shows it.
- What are the four types of CRM analytics?
- Descriptive says what happened and needs only that the records exist. Diagnostic says why and needs the comparison attribute stamped on the record at the time. Predictive says what happens next and needs a history stable enough that the past resembles the period ahead. Prescriptive recommends an action and needs all three plus an action set somebody will actually follow.
- Why does CRM analytics fail for outbound teams?
- Usually because the events it would analyse never arrive. Sends, replies, bounces, opt-outs and meetings happen in a sending platform, and if they are not written back against the right record the analysis reads the channel as having produced nothing. The second common cause is that the segment and premise were never written to the record, so no cohort comparison can be recovered afterwards.