Firmographic Data: The Company Attributes Your Targeting Actually Uses
Firmographic data is the set of attributes that describe a company and not a person: industry, headcount, revenue, location, ownership, age and legal form. It is what B2B targeting filters are built from. It says which companies are eligible, not which are ready to buy, and its accuracy depends on how each field was collected.
Key takeaways
- Firmographic data describes the company, not the person, through attributes such as industry, headcount, revenue, location, ownership structure and company age.
- Every field arrives self-reported, filed or inferred, and the route decides how much weight it can carry, with private-company revenue usually modelled from headcount.
- A firmographic filter is a boundary and not a measurement: it excludes clear misfits well and is unreliable near the edges of a band.
- Firmographics answer fit and say nothing about timing, so a second layer such as hiring or technology signals decides who is worth writing to this month.
Firmographic data is the set of descriptive attributes that belong to a company rather than to a person: industry, headcount, revenue, location, ownership structure, company age and legal entity type. It is the organisational analogue of demographics, and it is what almost every business-to-business targeting filter is built out of. When a target audience is described as "software companies, fifty to two hundred employees, United States", all three conditions in that description are firmographic attributes.
The word exists because the unit of purchase in business selling is an organisation, and the person you write to is only the organisation's representative in the conversation. Before there was a term for the account layer, audiences were described by the individual alone, and "VPs of Sales" is a description that spans a fifteen-person startup and a listed manufacturer with four thousand staff. Naming the company attributes separately forced two questions apart that had been answered as one: which companies could plausibly buy this, and which person inside them should hear about it.
Firmographic attributes are one class inside the wider category of sales data, which also covers technology and intent signals bought from a provider and the outcome records only your own campaigns produce.
What is firmographic data?
Firmographic data is information that describes a company instead of a person: its industry, headcount, revenue, location, ownership, age and legal form. B2B teams use it to decide which companies are eligible for a campaign before choosing who inside them to contact. It is bought from data providers or pulled from public registers, and its accuracy depends on how each attribute was collected.
| Attribute | How it usually arrives | What to watch |
|---|---|---|
| Industry | A statutory code, a vendor's classifier label, or a self-picked category | Three systems populated at different moments. A judgement call encoded as a field |
| Headcount | A band, often self-selected | The band can be accurate and still hide whether the company is growing or shrinking |
| Revenue | For private companies, usually modelled from headcount and industry | Filtering on revenue and headcount can filter on the same number twice |
| Location | Registered or self-reported address | Usually near-complete, so it is rarely the weak field |
| Ownership, age, legal form | Filings and registers, where they are open | Fill rate thins out fast, and unevenly, for small private companies |
Where each attribute comes from, and how much to trust it
This is why buyers with unusual businesses ask to be sized on revenue or operations metrics rather than headcount, and the request is better founded than it sounds. Where the revenue figure attached to a private company is itself modelled from headcount and industry, swapping one filter for the other changes the label and not the underlying estimate, so the substitution worth making is to an operational condition the company demonstrates rather than to a second derived number.
Every firmographic field arrives by one of three routes, and the route determines how much weight the field can carry.
Self-reported
Profile fields the company filled in
Size bands, industry picklists, self-written descriptions, chosen by whoever set the profile up, often years ago. Nobody updates a size band after redundancies.
cheap, wide, low precision
Filed or registered
Statutory and regulatory records
Incorporation records, filings, licence registers. Structured, dated and traceable to a document. Coverage collapses outside open registries, and private companies file far less.
authoritative where it exists
Inferred
Derived from a website or a signal
Industry from site copy, size from staff pages, revenue from models nobody publishes an error rate for. A rerun can silently change a value you already filtered on.
fills gaps with estimates
Headcount is worth separating out, because it is the attribute most filters lean on and the one that behaves worst. It is usually stored as a band rather than a number, the band is often self-selected, and the underlying reality moves faster than any refresh schedule. A company that has grown from forty to ninety staff and a company that has shrunk from two hundred to ninety can both sit in the same fifty-to-two-hundred bucket while representing opposite situations. The band is accurate and tells you almost nothing about which of the two you are writing to.
Revenue is worse again for private companies, because in most cases it is modelled rather than reported. A revenue figure attached to a private company in a data product is frequently an estimate derived from headcount and industry, which means filtering on both revenue and headcount can be filtering on the same underlying number twice.
Industry codes, and why two systems never agree

Industry is the attribute that feels most objective and is least so. There are standardised code systems: NAICS is the North American standard, and it is reviewed and revised every five years, in years ending in 2 and 7, through the federal Economic Classification Policy Committee (Census Bureau NAICS implementation timeline). SIC codes are the older lineage still embedded in a great deal of business data. On top of both sit the proprietary industry taxonomies that data vendors and professional networks use, which are not derived from either standard and do not map cleanly onto them.
The practical result is that the same company can carry a statutory code assigned at incorporation and never revisited, a vendor industry label produced by a classifier, and a self-selected profile category picked from a dropdown by a marketing hire. A company that started as an agency and now sells software will often still be registered as an agency. Nothing is wrong in any of the three systems; they were populated at different moments, by different parties, for different purposes.
So an industry label is a judgement call encoded as a field. It looks like a fact because it renders as a short string in a column, and it is treated as one because filters are built from equality tests. It is closer to an opinion with a timestamp.
How a filter set becomes a target list
Clients frequently ask to target only specific company size bands, which is straightforward to apply and worth pressure-testing first, because employee count is a reported attribute whose reliability varies by source rather than a measured one.
This is also the mechanism behind a request to filter for specific buyer characteristics and weed everybody else out. Each named characteristic becomes one provider field with that provider definition attached, so a tightly specified cohort can still return the wrong companies, and reading the rows at the boundary is what surfaces it before the send rather than a fortnight later.
The step most often skipped is the last one. Filters are evaluated by their output size, which is the one property that reveals nothing about whether they selected the right companies. Reading fifty rows at the edge of a size band, or fifty rows from an industry label you are unsure about, surfaces taxonomy problems in minutes that would otherwise surface as a flat reply rate a fortnight later.
How firmographic quality is measured

Two numbers describe the state of a firmographic set, and most teams track neither.
The first is fill rate, which is the share of rows in which a given attribute is populated at all. Fill rate is attribute-specific and varies enormously across a single pull: location and industry are usually near-complete, while ownership structure, founding year and revenue thin out fast, and they thin out unevenly, because the companies missing a revenue estimate are disproportionately the small and privately held ones. A segment defined partly on revenue therefore quietly excludes the population whose revenue is hardest to model, which is a selection effect nobody chose.
The second is agreement rate, which is the share of companies where two independent sources give you the same answer. This one is worth measuring once, on a sample, before a large build. Take a couple of hundred companies you already know, pull the same attribute from two providers, and count how often they match. Use whatever bands your own filters use, and count a match as landing in the same band rather than as exact equality. The number you get is a property of your market and your providers, so borrowing anyone else's figure is pointless, but having your own changes how you write filters: a low agreement rate on headcount is an argument for a wider band and a narrower reliance on it.
Which vendors to pull from is a separate question, and our comparison of firmographic data providers reads six of them from their own pages.
Both numbers should be recomputed when you change provider, change segment, or return to a pool that has been sitting unused. Attribute quality is not uniform across a data product; it is a function of which companies you asked about.
Where the textbook definition breaks
The tidy definition says firmographics describe a company. That is exactly what they do, and it is also the problem.
Firmographics describe what a company is. Outbound usually needs to know what a company is doing. Fit and timing are different questions, and only one of them is answered here. Every company in a well-built firmographic segment could plausibly buy the product, and on any given week almost none of them are in a position to act. This is why a firmographic-only list can look perfectly on-target in review and perform like a phone book in the field: the selection criteria contain no information about whether anything has changed at the company recently. The attributes that carry timing live elsewhere, in a job posting, a funding event, a leadership change or a visible technology switch, and a segment built without any of them is a segment built on a permanent condition.
The same company returns different values from different providers. Pull one mid-sized company from three data sources and you can reasonably expect three headcounts and two or three industry labels. None of the providers is lying. They sampled different evidence at different times through different classifiers. What this means for a filter is uncomfortable but simple: a condition of "five hundred to one thousand employees" is a filter on one vendor's estimate of headcount, not on headcount. Move the same audience definition to another provider and the resulting company set will overlap substantially and not completely, and the non-overlap is not an error anybody can fix.
The honest way to hold this is to treat a firmographic filter as a boundary rather than a measurement. It is good at excluding companies that are clearly outside the range, and unreliable at fine distinctions near the edges of a band. Designing a segment that depends on the difference between four hundred and eight hundred staff is designing a segment on top of a rounding error.
What to do with it
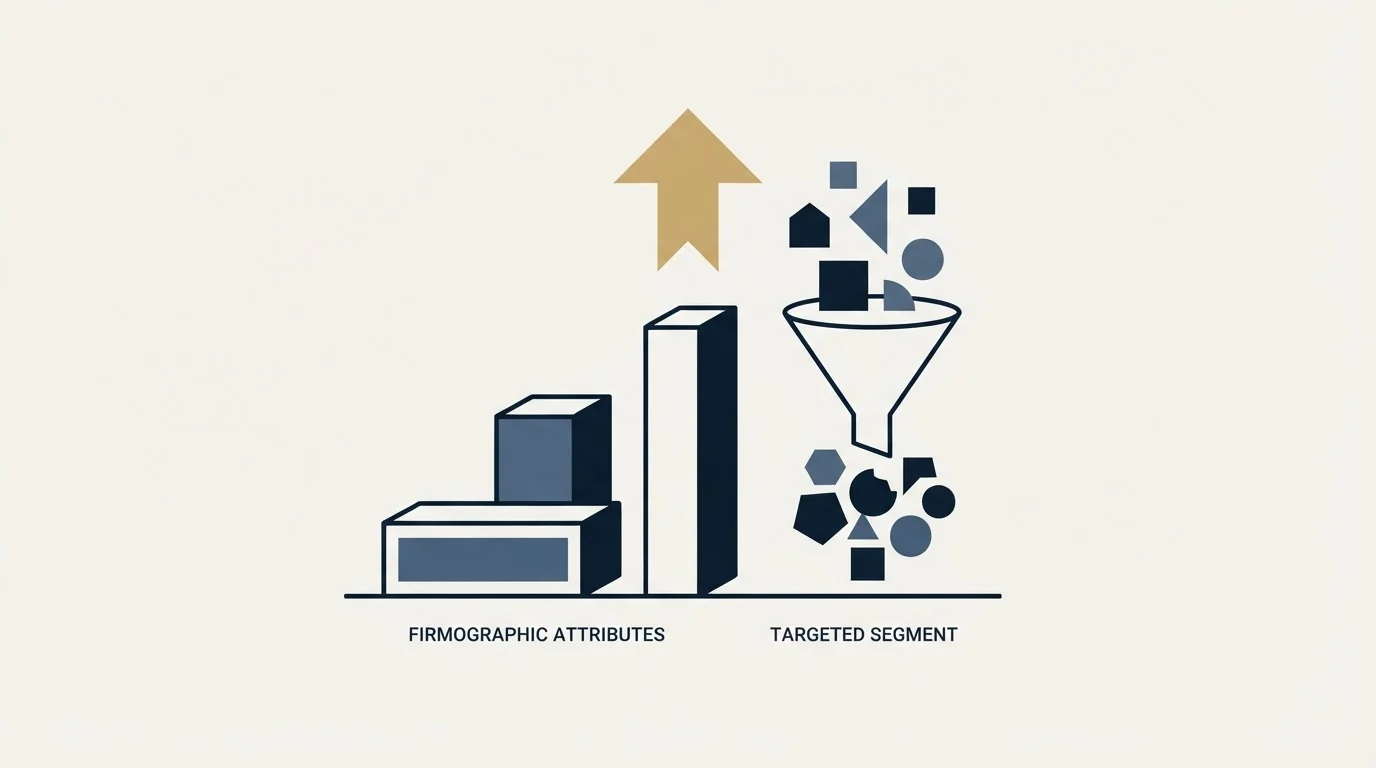
Use firmographics to draw the outer boundary of who is eligible, then use something else to decide who is worth writing to this month. That second layer is what separates a target list from a market map, and the attributes that supply it are covered in the neighbouring entries: technographic data holds the stack attributes, and hiring signals hold the timing attributes.
Write the definition of each firmographic condition down before building anything, including which provider's version of the field you mean and what you will do when two sources disagree. Then check the boundary rows by hand. Two afternoons spent reading edge cases in a segment saves the far more expensive discovery that an entire industry label meant something different from what you assumed.
Finally, keep the segment narrow enough that a single message can be true for every company inside it. If the segment spans companies whose situations differ enough that the message has to hedge, the segment is doing the job of two segments and should be split into two campaigns with their own premises.
Related terms and guides
Firmographic conditions are the raw material of an ideal customer profile, which is the document where those conditions get written down and agreed rather than improvised per campaign. The distinction between a filter and a signal, which is the heart of the timing problem above, is worked through in B2B prospecting.
A firmographic profile is that same assembly read at the level of one company, and it is the phrase buyers reach for when they mean the attribute set attached to a single account rather than to a segment.
On the data side, the reason a single provider rarely produces a complete company record is covered in waterfall enrichment, and the comparison of the providers themselves is in data enrichment tools for B2B SaaS. For what a badly drawn firmographic boundary does to the economics of a programme, see cost per lead in B2B. For a worked example of the account layer being drawn properly in a market where the standard industry tag is close to useless, see healthcare lead generation.
If you would rather see a segment built and tested against your own market than argue about size bands in a spreadsheet, see what a first campaign looks like.
Frequently asked questions.
Frequently asked questions- What is firmographic data?
- Firmographic data is the set of descriptive attributes that belong to a company and not to a person: industry, headcount, revenue, location, ownership structure, company age and legal entity type. It is the organisational analogue of demographics, and almost every business-to-business targeting filter is built out of it.
- What are examples of firmographic data?
- An audience described as software companies with fifty to two hundred employees in the United States uses three firmographic attributes: industry, headcount and location. Others are annual revenue, ownership structure such as independent or group-owned, founding year and legal entity type. Technology stack and hiring activity are separate classes, technographic data and hiring signals.
- How accurate is firmographic data?
- It depends on how each field was collected. Self-reported profile fields are cheap and imprecise, filed records are authoritative where open registries exist, and inferred values are estimates. Headcount is usually a band, and private-company revenue is usually modelled. Measure fill rate and the agreement rate between two providers on a sample you already know.
- What is the difference between firmographic and technographic data?
- Firmographic data describes what a company is: its industry, size, location and structure. Technographic data describes what it runs, meaning the software and systems in its stack. Firmographics draw the outer boundary of who is eligible, and technographic and hiring signals help decide who is worth contacting this month.