CRM Reports: The Four a Sales Team Reads
A CRM report is a saved query over the records in a CRM, defined by four choices: a filter, the fields shown, a grouping and a time window. CRM reporting is the practice of turning those queries into decisions. The reports are only as accurate as the fields, which people typed in about their own work.
Key takeaways
- A CRM report is a saved query defined by a filter, a set of fields, a grouping and a time window, and changing any one of them changes the answer under the same title.
- Mainstream CRMs offer four report families, activity, record, pipeline and forecast, and vendors differ mainly in which families sit behind which plan.
- Four reports answer most for an outbound team: deals with no next step, time in stage against your own history, outcomes by segment and premise, and completeness on targeting fields.
- A CRM report reads claims rather than observations, sees only what was written back, and can show two users different totals because of permission scoping.
A CRM report is a saved query over the records in a CRM, rendered as a table or a chart: a filter that decides which records count, a set of fields to show, a grouping and a time window. CRM reporting is the practice of turning those saved queries into a view somebody makes a decision on, which is a different and harder thing than producing them.
The distinction matters because the two halves fail separately. A report can be built correctly and read the wrong records, or it can read exactly the right records and still be wrong, because the fields it reads were typed in by people describing their own work.
What is a CRM report?
A CRM report is a saved question asked of the records in a CRM. It names which records count, which fields to show, how to group them and over what period, and it returns a table or a chart that updates as the records change. CRM reporting is the wider practice: choosing which of those saved questions a team reads, how often, and what decision each one feeds.
What a report is made of
Four choices define any CRM report, and each is a place where the answer changes before anybody looks at the chart.
The filter decides which records are counted at all. Open opportunities only, or open plus recently closed. This quarter's created date, or this quarter's close date, which are different sets. A filter is a saved definition, and two reports carrying the same name over different filters is the most common reason two people quote different numbers from the same system.
The fields decide what is shown, and they carry the accuracy problem described further down. A field that is optional at data entry produces a report with a silent gap where the blanks were.
The grouping decides the question. The same opportunity records grouped by stage answer where is the pipeline, grouped by owner answer whose pipeline is it, and grouped by source answer which motion produced it. None of those is more correct than the others; they are three questions.
The time window decides against what. Snapshot reports say what is true now. Trend reports say what changed, and they require the system to have retained history, which is a configuration question rather than a reporting one. A CRM that does not store stage-change history cannot report on how long deals sit in a stage, however many charts it offers.
The report families
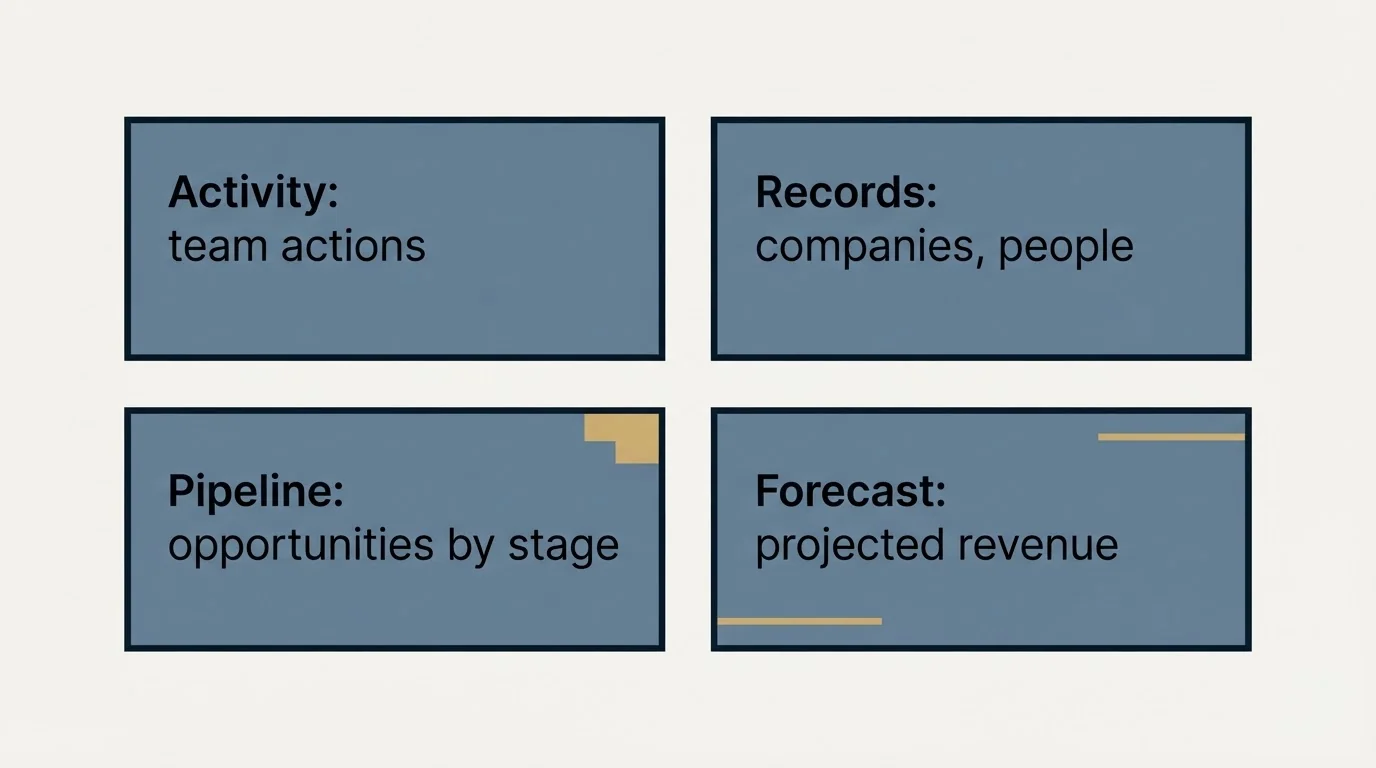
Mainstream CRMs group their reports into roughly the same families, whatever the product calls them, and knowing the families is more useful than knowing one vendor's menu.
Activity reports count what the team did: messages sent, calls placed, meetings held, tasks completed or overdue. These are the easiest to produce and the easiest to misuse, because activity is always available whether or not anybody is buying.
Record reports run over companies and people rather than deals: ownership, field completeness, segment counts. This is the family that answers whether the data is good enough to build a campaign from, and it is the family nobody looks at until a campaign fails.
Pipeline and deal reports run over opportunities: value and count by stage, conversion between stages, time in stage, movement over a period. This is the family every dashboard defaults to.
Forecast reports project future revenue from the pipeline records, usually weighting by stage or by a rep's own commit. What they are actually estimating, and the three numbers they get confused with, is covered in sales forecast.
| Family and what it runs over | Answers | Read alone, it |
|---|---|---|
| Activity Messages, calls, meetings, tasks | What did the team do? | Rises whether or not anybody is buying |
| Record Companies and people | Is the data good enough to build a campaign from? | Goes unread until a campaign fails |
| Pipeline and deal Opportunities | Value by stage, conversion, time in stage | Summarises what sellers typed about their own deals |
| Forecast The pipeline records, weighted | What revenue is projected? | Inherits every optimistic stage and close date |
Vendor products differ mainly in which families are gated behind which plan, and the gates are worth checking before a reporting practice is designed around a report you do not have. Pipedrive's Insights report catalogue is a worked example of one vendor's version, including which report types sit behind which tier.
The four an outbound team actually reads
Dashboards fill up with variations of the same deal-volume chart. Four reports answer more, and all four are buildable in any mainstream CRM.
Open opportunities with no next step, or a next step in the past. A deal without a dated next step is stalled by definition, whatever stage it sits in. This is a saved view rather than a chart and it takes minutes to build.
Time in stage against your own converted history. Age is only meaningful compared to how long deals that eventually closed spent in the same stage. Absolute age tells you a deal is old; relative age tells you it is unusual.
Reply and meeting outcomes grouped by segment and by premise. This is the report that decides what the next campaign looks like, and it is the one most CRMs cannot produce, because the sending platform never wrote replies back. Fixing that is a write-back problem rather than a reporting one, and it is the last section of CRM setup for an outbound team.
Field completeness on the fields a segment query filters on. Not overall completeness, which is unbounded and demoralising, but the four or five fields your targeting actually uses. This report sizes the enrichment job honestly and usually shrinks it.
Saved view
No next step
Open opportunities with no next step, or one dated in the past. Stalled by definition, whatever the stage says.
Comparison
Time in stage
Age set against how long your own closed deals spent in the same stage. Relative age, not absolute.
Needs write-back
Outcomes by segment and premise
Replies and meetings grouped by who was targeted and why. It decides what the next campaign looks like.
Record report
Completeness on targeting fields
Only the four or five fields a segment query filters on. It sizes the enrichment job honestly.
A field-by-field layout for building four such reports, with the filter, grouping and formulas written out, is the CRM report template.
What a rep can be held to, as distinct from what a report can show, is a separate question worked through in SDR metrics.
A dashboard is a container rather than a report. Every complaint about a dashboard being useless is really a complaint about which reports were dropped onto it, and arranging four variations of one chart more neatly does not make the board answer a question it was never given.
The layer above these saved queries, where two of them are compared and a claim is made about the relationship, is CRM analytics.
Why a CRM report is wrong
Three failure classes account for most of the disagreements a reporting practice produces, and none of them is a bug in the report.
The fields are claims, not observations. A deal's value, its close date and its stage were entered by the person whose performance the deal describes. The report reads them faithfully. A pipeline report is therefore a summary of what a team believes and hopes, and making those numbers closer to facts happens at the stage-transition rule rather than in the reporting layer. The mechanisms that do it are in pipeline management in a CRM, and the stage design underneath them is in pipeline stages that earn their place.
The report can only read what was written back. Outbound activity that lives in a sending platform and never reaches the CRM is invisible to every report in it, and nothing in the report announces the absence. A team looking at a CRM with no outbound activity in it concludes that outbound produced nothing, when the correct conclusion is that the sync was never built. The engineering side is in CRM integration.
Two people can read different numbers off the same report, both correctly. Record visibility and permission settings scope what each user sees, so a manager and a rep opening the same dashboard can see different totals. That is a feature working as designed, and it is worth checking whose account produced a figure before anybody escalates a discrepancy.
What the report establishes
- How many records match a definition
- How they are distributed across a grouping
- What changed between two points, if history is retained
- Which records violate a rule you wrote
- Who owns what, which is the field most reliably correct
What it cannot establish
- Whether a stage was genuinely reached
- Whether a close date reflects anything the buyer said
- Whether a value is a real configuration or a list price
- Anything that happened in a system that never wrote back
- Whether a blank field means no or means nobody asked
What to do with it
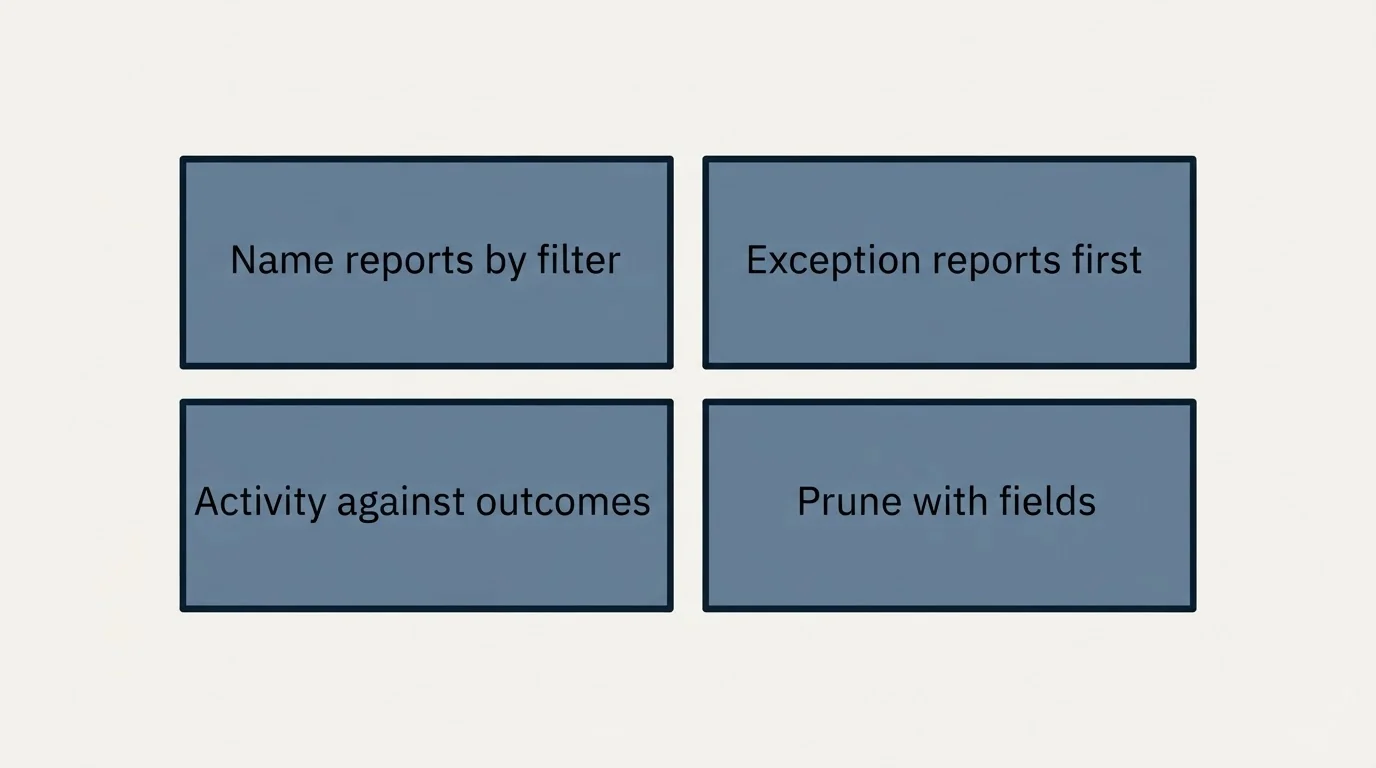
Name every report for its filter rather than for its subject. A report called Pipeline is unfalsifiable; a report called Open opportunities by stage, created this quarter can be checked and argued with.
Build the exception reports before the summary ones. A chart of pipeline by stage prompts a discussion. A list of eleven deals with no next step prompts eleven decisions, and it is the same data.
Read activity reports only against outcome reports. Activity is always achievable and rises whenever it is measured, so an activity number on its own moves without telling you anything. Quota attainment and win rate are the outcome-side pair, and sales velocity is the composite that changes when either moves.
Prune reports on the same schedule as fields. Every saved report is a definition somebody may quote in a meeting a year from now, and an old report over a filter nobody remembers is worse than no report. The habit behind that is data hygiene, applied to the reporting layer rather than to the records.
And when the reports are honest and the pipeline is simply too small, the constraint is supply rather than reporting. No dashboard produces accounts.
Related terms and guides
Sales forecast covers what the forecast family is estimating, pipeline coverage the ratio it is usually read against, and win rate, quota attainment and sales velocity the outcome measures the activity families should be read beside. Data hygiene covers the maintenance that keeps the underlying fields worth querying, and lead routing the ownership rules that make the owner field mean something.
On the build side, CRM setup for an outbound team covers the objects, the required field set and the write-back loop that decides which reports are possible at all. Pipeline management in a CRM covers making the records honest enough to report on, pipeline stages that earn their place covers the stage definitions underneath, and Pipedrive's Insights reports is a worked vendor catalogue with its plan gates.
If the reports are clean and the top of the pipeline is empty, see what a first campaign produces against your market.
Frequently asked questions.
Frequently asked questions- What is a CRM report?
- A CRM report is a saved query over the records in a CRM, shown as a table or a chart. Four choices define it: a filter that decides which records count, the fields to show, a grouping that decides which question is being asked, and a time window. It updates as the underlying records change.
- What is CRM reporting?
- CRM reporting is the practice of turning saved CRM queries into views somebody makes a decision on. It covers which reports a team reads, how they are named, how often they are reviewed and what each one feeds. It is harder than producing the reports, because the fields underneath were typed in by people describing their own work.
- What types of CRM reports are there?
- Four families appear in most mainstream CRMs. Activity reports count what the team did. Record reports run over companies and people and show ownership and field completeness. Pipeline and deal reports show value by stage, conversion and time in stage. Forecast reports project revenue from the pipeline records, usually weighted by stage or commit.
- Why do two CRM reports show different numbers?
- Usually because they run over different filters under the same name, for example created date this quarter against close date this quarter, which select different deals. Record visibility and permission settings also scope what each user sees, so a manager and a rep can open the same dashboard and read different totals, both correctly.