CRM Report Template: Four Reports, Field by Field
A CRM report template is four saved queries: pipeline by stage, activity by owner, conversion by source and stale deals, each with its filter, fields and formulas.
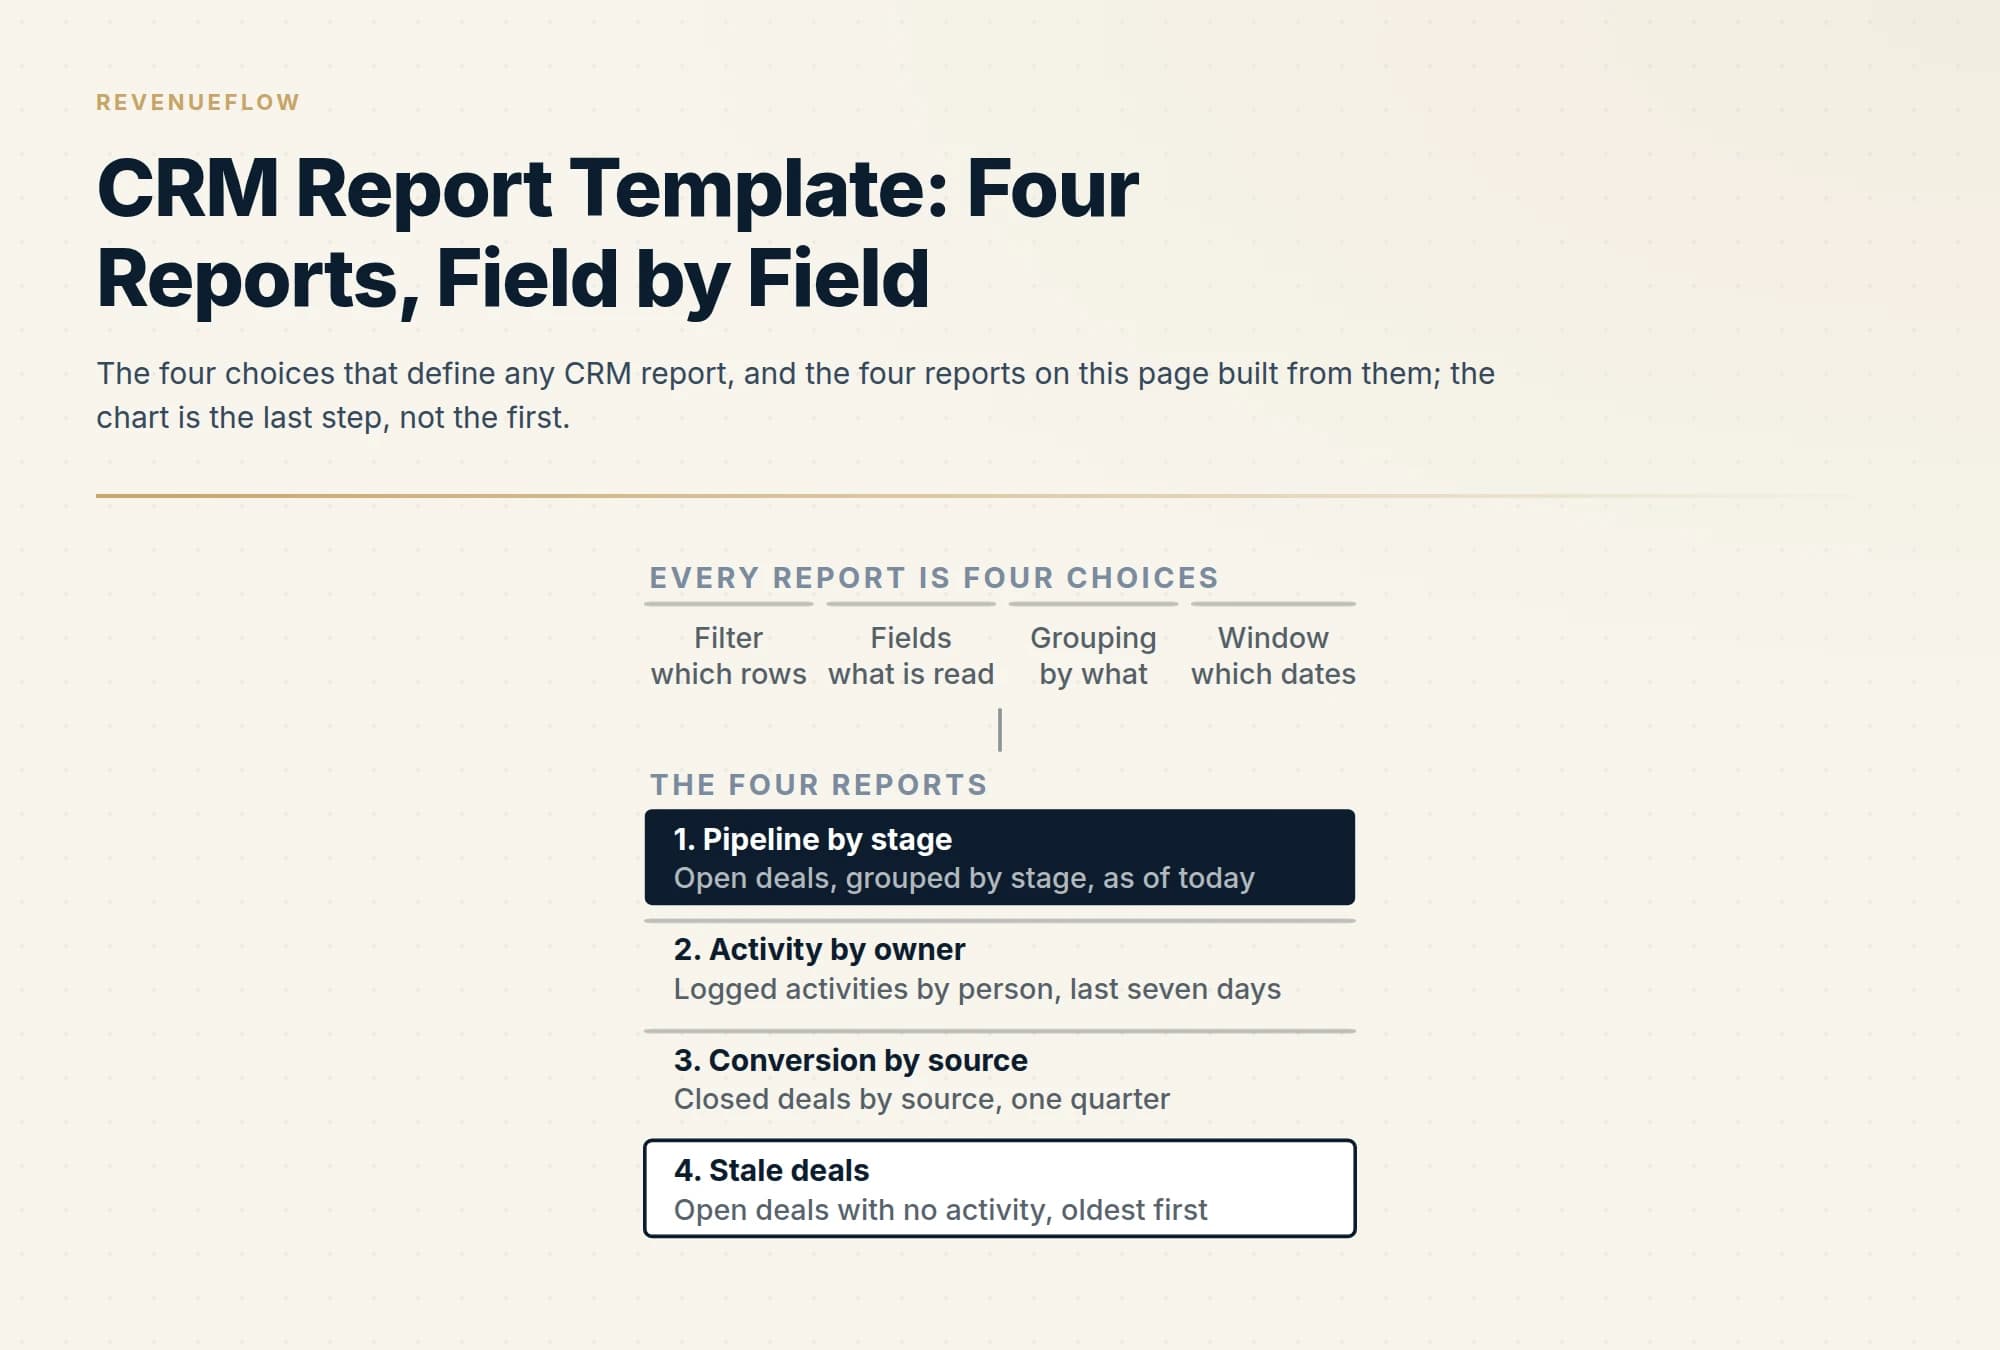
A CRM report template is four saved queries, each defined by a filter, a field list, a grouping and a window, and named for its filter: pipeline by stage as an as-of snapshot, activity by owner as a seven-day flow, conversion by source as a closed-quarter flow, and stale deals past a per-stage threshold.
Key takeaways
- Make four fields mandatory on every open deal before building any report: stage from a fixed list, amount, expected close date, and next action with a date; a report that reads a blank field describes the people who bothered.
- Name every report for its filter, because open deals created this quarter and open deals closing this quarter are different sets and a team that calls both Pipeline argues every Monday.
- Show a count beside every rate and a median beside every mean: a win rate on four deals is not a win rate on forty, and one deal stuck for a year drags a mean days-in-stage.
- Read the stale deals report against a rule agreed in advance, such as three weeks on the list moves a deal to lost with a reason, or the pipeline fills with deals nobody will close or kill.
Reviewed and updated September 17, 2026
A CRM report template is four saved queries, and most of the templates offered for download are four charts with the queries left out. The chart is the easy part. The filter that decides which records count, the fields that are read, the grouping and the time window are the template, and when two people quote different numbers from the same CRM it is almost always because one of those four choices differs between two reports with the same name. The CRM reports glossary entry sets out that anatomy; this page is the template itself.
Nothing here is downloadable, on purpose. What follows is the layout of four reports, field by field, with the filter, the grouping and the formula written out so that a team can build each one in ten minutes in whichever CRM or spreadsheet it already has open. Every number in the example rows is invented for illustration and says so. If the CRM is a spreadsheet, the tabs these reports read from are the ones laid out in the Excel CRM template.
The rule that makes any of this work
A report can only read what was written, and a field that is optional at entry produces a report about the people who bothered. So the template starts with four fields that are mandatory on every open deal before any report is built: the stage, from a fixed list; the amount; the expected close date; and the next action with a date. A report that reads a field which is blank on a third of rows is a report about two thirds of the pipeline, and it should say so in its title.
The second rule is that every report carries its filter in its name. Open deals, created this quarter is a different set from open deals, closing this quarter, and a team that names them both Pipeline will argue about the number every Monday.
Report one: pipeline by stage
This is the report the word pipeline usually means, and it is an as-of report: a snapshot of open deals at the moment it is run, not a flow over a period.
Filter: deal status is open. Nothing closed, won or lost, and nothing marked on hold unless the team has decided on hold is open. Fields: deal name, account, owner, stage, amount, expected close date, days in current stage. Grouping: by stage, in the order stages occur, never alphabetically. Window: none, it is as of now, and the run date belongs in the title.
Two formulas turn the grouped rows into the numbers people ask for. Count per stage is the number of rows in each group. Amount per stage is the sum of the amount field in each group, and it should be shown beside the count rather than instead of it, because one large deal in a late stage makes a thin pipeline look full. A third, weighted amount, multiplies each deal's amount by a fixed probability per stage. It is worth having only if the probabilities were set once from past closed deals and are not edited by the people whose forecast they produce.
| Stage, in order | Deals | Amount, example | Median days in stage, example |
|---|---|---|---|
| Meeting booked | 14 | 168,000 | 6 |
| Meeting held | 9 | 117,000 | 11 |
| Proposal sent | 6 | 96,000 | 19 |
| Verbal yes | 2 | 41,000 | 8 |
| Contract out | 1 | 24,000 | 4 |
The median days in stage column is the one that earns its place. A mean is pulled by the single deal that has sat in proposal for a year; the median tells you what a typical deal at that stage looks like, and a stage whose median climbs quarter on quarter is a stage where something changed.
Report two: activity by owner
This report answers whether the work is happening, and it is a flow report over a short window.
Filter: activities of the types the team has agreed to log, with the type list fixed, for example calls made, emails sent by hand, meetings held. Automated sends from a sequencing tool are excluded, because counting them rewards volume nobody chose; where the sequencer sits relative to the record is set out in the sales tech stack guide. Fields: activity type, owner, date, the deal or account it was logged against. Grouping: by owner, then by type. Window: the last seven days, or the last full week, and the report should say which.
The formula is a count per owner per type, shown as a small grid rather than a total, because a total hides the person who made 40 calls and held no meetings. One derived number is worth adding: activities logged against no deal or account, per owner. A high count there means work is being recorded where no report can find it later.
The trap in this report is that it measures logging, not work, and a team that is judged on it will log more. Its honest use is as a check on the other three reports: if pipeline by stage shows a stage stalling and activity by owner shows nothing logged against those deals, the stall is explained.
Report three: conversion by source
This is the report that decides where the next list comes from, and it is the one most templates get wrong by mixing an as-of pipeline with a closed-period flow.
Filter: deals closed in the window, won and lost both, because a source with a high win rate on three deals and a source with a lower win rate on thirty are not comparable without the denominator. Fields: source, outcome, amount, created date, closed date. Grouping: by source, with the source list fixed at entry, for example outbound email, LinkedIn, referral, inbound, event. Window: a full quarter by closed date, and a second version by created date if the cycle is long enough that the two differ.
The source list itself follows the channel mix in outbound lead generation for B2B SaaS. Three formulas. Win rate per source is won divided by won plus lost, with the count shown beside it so that a rate on four deals is not read as a rate on forty. Median cycle per source is the median of closed date minus created date among won deals. And revenue per source is the sum of won amounts.
| Row | Pipeline by stage | Activity by owner | Conversion by source | Stale deals |
|---|---|---|---|---|
| Stage, from a fixed list | Yes | No | No | Yes |
| Amount | Yes | No | Yes | Partial |
| Expected close date | Yes | No | No | Yes |
| Next action with a date | No | Partial | No | Yes |
| Source, from a fixed list | Partial | No | Yes | No |
| Owner | Yes | Yes | Partial | Yes |
| Logged activity date | Partial | Yes | No | Yes |
The partials are deliberate. Pipeline by stage can be grouped by source as a second cut, activity by owner can read the next action to see what was planned against what was logged, and stale deals reads amount only to sort which stale deal to chase first.
Report four: stale deals
This is the report that gets read on Monday morning, and it is the simplest to build and the hardest to keep honest, because it names people.
Filter: deal status is open, and the last logged activity date is older than a threshold the team sets per stage, for example 14 days in the early stages and 7 in the late ones. Fields: deal name, account, owner, stage, amount, last activity date, next action, next action date. Grouping: none, or by owner if the list is long. Sort: oldest last activity first. Window: as of now.
The formula is a single derived column, days since last activity, which is today minus the last activity date. A second derived column, next action overdue, is true when the next action date is in the past. A deal that is both stale and overdue is either dead or being worked off the record, and both are worth a question.
What keeps this report honest is that it is read against a rule agreed in advance: a deal that appears here three weeks running is moved to lost, with the reason recorded. Without that rule the pipeline report fills with deals nobody will close and nobody will kill.
Building the four in a spreadsheet
If the CRM is a sheet, each report is a filtered, grouped view of the deals and activities tabs. Report one is a pivot of the deals tab on stage with count and sum of amount, and a median of a days-in-stage helper column. Report two is a pivot of the activities tab on owner and type over a date filter. Report three is a pivot of closed deals on source and outcome, with win rate as a formula beside it. Report four is the deals tab filtered on status and a days-since-activity helper column, sorted descending. The helper columns are the template; the pivots are furniture.
In a CRM product the same four exist as saved reports, and the discipline is to build them once, name them with their filter, and stop anyone from editing the saved filter without renaming the report.
What the four are for in an outbound motion
We run outbound on Email Bison and in-house tooling for email and HeyReach for LinkedIn, one message per campaign, and the record we report from is the qualified meeting, against criteria agreed in writing. That makes report three the one we read most: which list, which premise and which channel each held meeting and each closed deal came from, with the count beside every rate. Report four is the suppression check in another form, because a stale open deal is a company that must not be contacted again by a colleague on a new campaign until someone decides what it is, and a record that has been doubled by a sync, the failure the Apollo and HubSpot deduplication guide works through, makes that check miss.
If the reports are clean and the top of them is empty, that is a supply problem rather than a reporting one. RevenueFlow books qualified meetings on a pay-per-meeting basis, against criteria agreed in writing before launch.
The short version
A CRM report template is four saved queries, each with a filter, a field list, a grouping and a window, and each named for its filter. Pipeline by stage is an as-of snapshot of open deals with count, amount and median days per stage. Activity by owner is a seven-day flow of logged activity by person and type. Conversion by source is a closed-quarter flow with win rate, median cycle and revenue per source, counts shown beside every rate. Stale deals is an as-of list of open deals past a per-stage threshold, read against a rule for killing them. Make four fields mandatory at entry and the four reports build themselves.
The layouts, formulas and thresholds on this page are a template, not a vendor's feature; every example value is invented for illustration. Build the reports in whichever CRM or spreadsheet the team already uses.
Frequently asked questions.
Frequently asked questions- What reports should a CRM have?
- Four, for a sales team: pipeline by stage, an as-of snapshot of open deals grouped by stage in order with count, amount and median days in stage; activity by owner, logged activities by person and type over the last seven days; conversion by source, closed deals in a quarter grouped by source with win rate, median cycle and revenue; and stale deals, open deals whose last activity is older than a per-stage threshold. Each is a saved query.
- How do you build a sales pipeline report?
- Filter to open deals only, read deal name, owner, stage, amount, expected close date and days in current stage, group by stage in the order stages occur, and run it as of now with the run date in the title. Count the rows and sum the amount per stage, shown side by side so one large late-stage deal does not make a thin pipeline look full, and add the median days in stage.
- Can I build a CRM report template in Excel or Google Sheets?
- Yes, if the tabs carry the four mandatory fields. Pipeline by stage is a pivot of the deals tab on stage with a count, a sum of amount and a median of a days-in-stage column. Conversion by source is a pivot of closed deals on source and outcome with win rate beside it. Stale deals is the deals tab filtered on status, sorted by days since activity. The helper columns are the template.
- Why do two people get different numbers from the same CRM report?
- Because one of four choices differs between two reports with the same name: the filter, which decides which records count; the fields, which may be blank on some rows; the grouping; or the time window, where created date and close date select different sets. The fix is to name each saved report for its filter and to stop anyone editing a saved filter without renaming the report.
About the author.

B2B cold email experts helping companies generate qualified leads through done-for-you outreach campaigns.
RevenueFlow Team
Explore more.
Ready to scale your outreach?
We build GTM engines that book real meetings. See the receipts.
Related articles.
Which CRMs and Tools the Outbound Stack Connects To: Integration Data From 342 Sales Tools
HubSpot is named as an integration by 52.3% of 342 verified sales tools, Zapier by 50.3% and Salesforce by 43.3%. Here is the full map by category.
CRM for Medical Sales: Three Products, One Phrase
Medical sales CRM covers three different products: a compliance platform, a field activity app and an ordinary commercial CRM. Which one a device team needs.
Sales Data: The Classes, and Which Ones You Can Buy
Sales data covers two collections with almost nothing in common: the account attributes a provider sells you, and the outcomes only your own sending produces.
HubSpot Alternatives for Small Business: Where Free Stops
HubSpot publishes its free CRM as free for up to two users. Four alternatives whose own pricing pages could be read, and where each one puts its gate.
Best Outlook CRM: What the Add-In Actually Does
An Outlook CRM is a Microsoft platform object under Microsoft's rules. What five vendors publish about install route, mailbox eligibility and silent logging gaps.
Excel CRM Template, and the Google Sheets Version
Four tabs, two controlled vocabularies and three rules. The spreadsheet CRM template that survives contact with a real pipeline, in Excel and Google Sheets.