Cold Email Automation Benchmarks: 2026 Performance Data
Industry data shows automated cold email campaigns achieve 80-90% of manual campaign performance while scaling to 10-50x volume. Discover the benchmarks for effective automation.
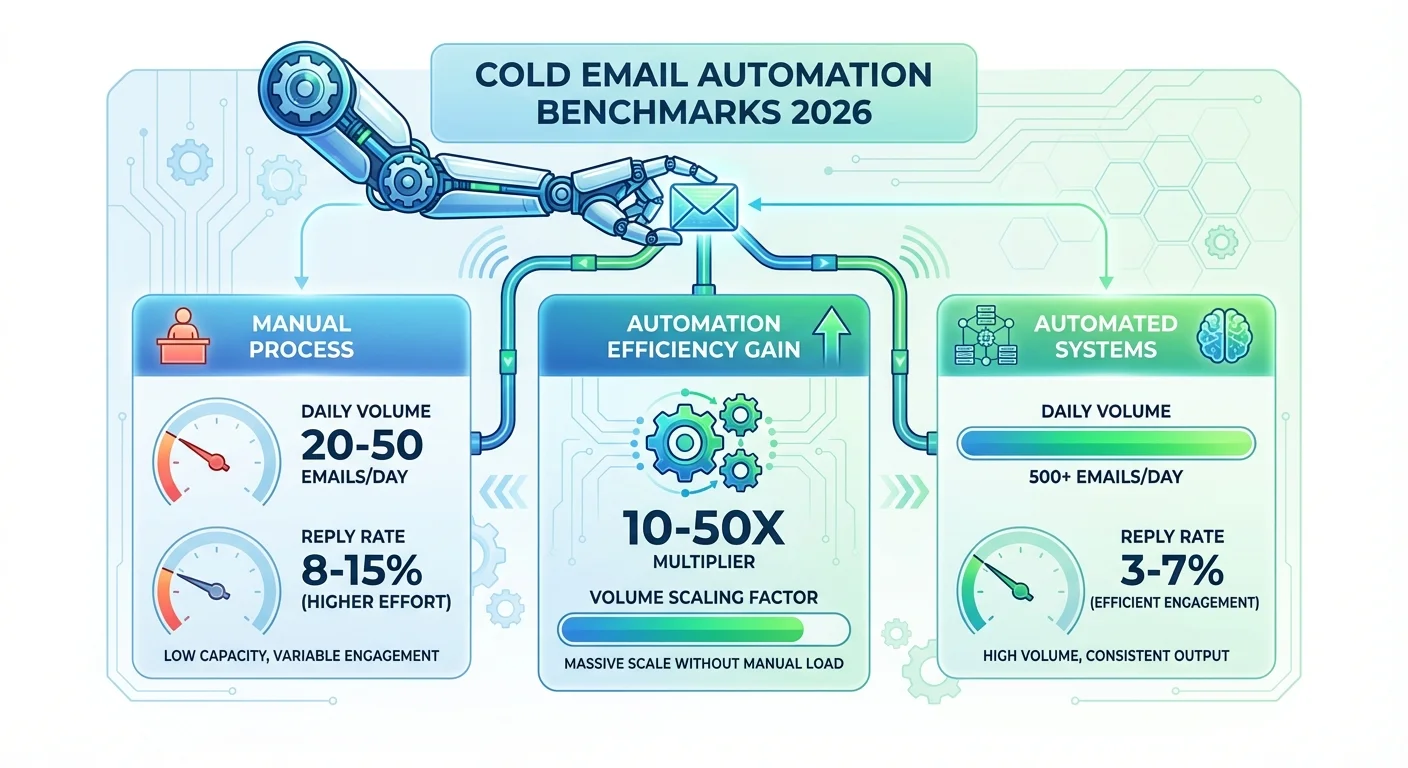
Automated cold email campaigns achieve 80-90% of manual campaign performance while enabling 10-50x higher volume. Semi-automated approaches yield 5-10% reply rates at 50-150 emails per day, while highly automated campaigns achieve 3-7% reply rates at 150-500 emails per day. The optimal automation level balances reply rate against volume capacity: Level 1 sequencing-only automation delivers 6-10% reply rates, while Level 5 fully automated systems produce 2-4% reply rates but process over 500 prospects daily.
Key takeaways
- Semi-automated campaigns generate 3-6 replies per hour compared to 1-2 replies per hour for fully manual campaigns, despite lower per-email reply rates.
- New email domains should limit daily sending to 20-50 emails, while mature domains over six months old can safely send 200-500 emails per day.
- Website visit triggers increase reply rates by 20-35% compared to standard time-based follow-ups in automated sequences.
- Level 1 automation using manual research with automated follow-ups achieves 6-10% reply rates, while Level 5 fully automated systems produce 2-4% reply rates.
- Automated campaigns should increase daily volume by no more than 30-50 emails per day after week four to protect sender reputation.
Reviewed and updated September 15, 2026
Cold Email Automation Benchmarks: 2026 Performance Data
Email automation enables cold outreach at scale, but the performance trade-offs require careful consideration. Industry data shows that well-implemented automation achieves 80-90% of manual campaign performance while enabling 10-50x higher volume. Understanding automation benchmarks helps you balance efficiency with effectiveness.
This benchmark report covers the performance metrics for automated cold email campaigns, including platform capabilities, personalization trade-offs, and optimization strategies.
About This Data
The benchmarks presented in this report are compiled from publicly available industry research, aggregated data from sales engagement platforms, and typical ranges observed across B2B cold email campaigns. These figures represent industry estimates and general ranges rather than definitive standards. Your actual results will vary based on your specific tools, implementation quality, and target audience.
We recommend using these benchmarks as directional guidance while establishing your own automation baselines.
Automation vs. Manual Performance
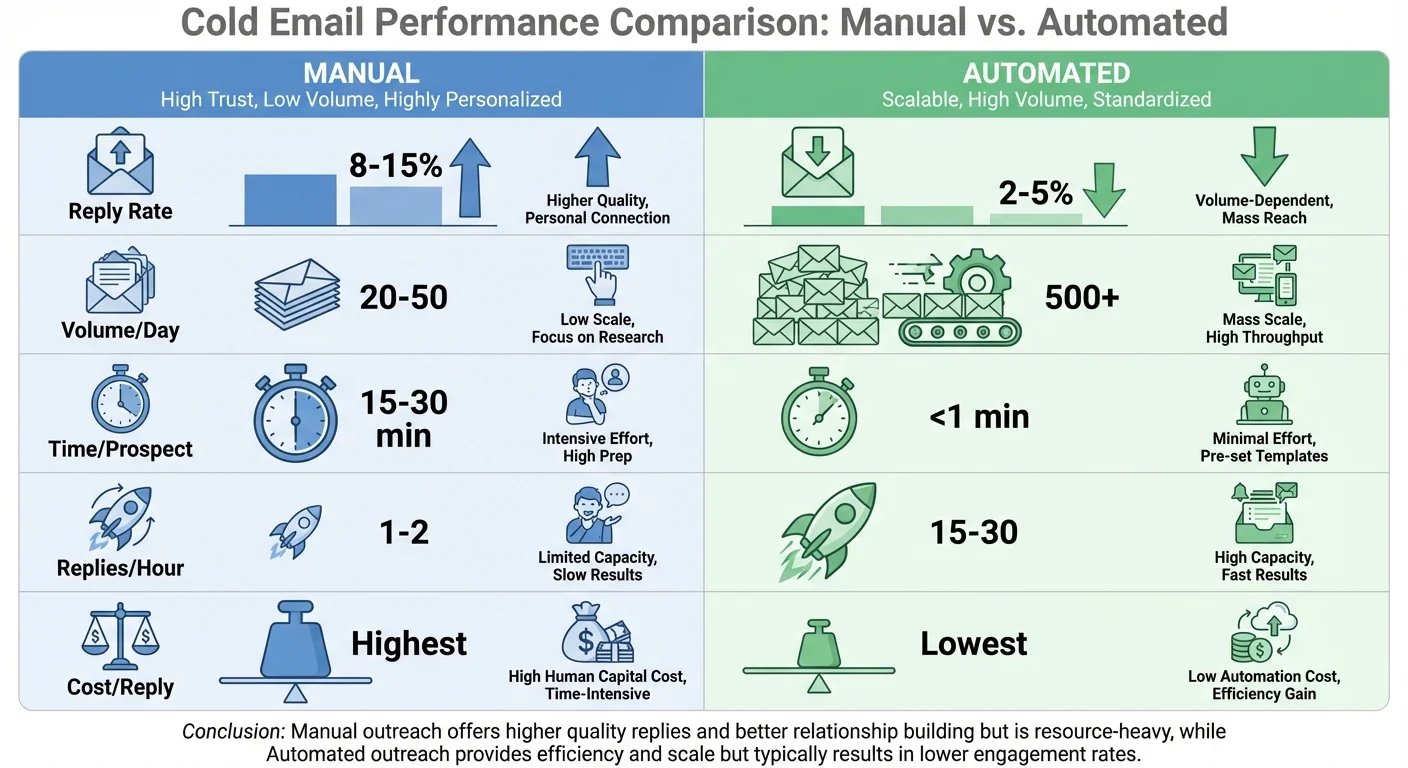
Understanding the trade-offs between automated and manual approaches.
Performance Comparison
| Approach | Reply Rate | Volume Capacity | Time per Prospect |
|---|---|---|---|
| Fully manual | 8% - 15% | 20-50/day | 15-30 minutes |
| Semi-automated | 5% - 10% | 50-150/day | 3-10 minutes |
| Highly automated | 3% - 7% | 150-500/day | 1-3 minutes |
| Fully automated | 2% - 5% | 500+/day | Under 1 minute |
Efficiency Trade-Off Analysis
| Approach | Replies per Hour | Cost per Reply |
|---|---|---|
| Fully manual | 1-2 | Highest |
| Semi-automated | 3-6 | Medium |
| Highly automated | 8-15 | Lower |
| Fully automated | 15-30 | Lowest |
While automated campaigns have lower per-email reply rates, the efficiency gains often produce more total replies per hour invested.
Automation Level Benchmarks
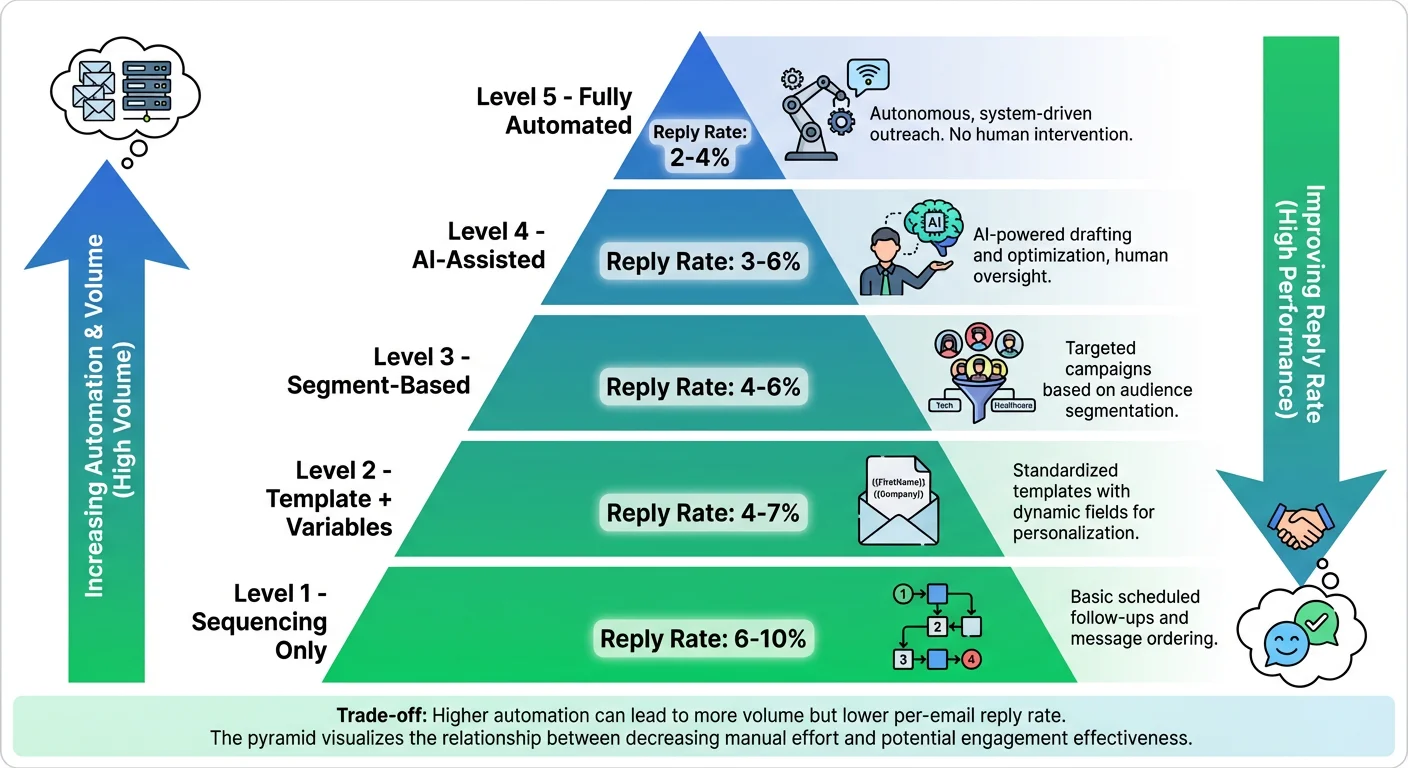
Different automation levels suit different situations.
Automation Level Definitions
| Level | Description | Typical Reply Rate |
|---|---|---|
| Level 1: Sequencing only | Manual research, automated follow-ups | 6% - 10% |
| Level 2: Template + variables | Standard templates with mail merge | 4% - 7% |
| Level 3: Segment-based | Different templates per segment | 4% - 6% |
| Level 4: AI-assisted | AI generates personalized elements | 3% - 6% |
| Level 5: Fully automated | Complete end-to-end automation | 2% - 4% |
Optimal Automation Level by Situation
| Situation | Recommended Level | Rationale |
|---|---|---|
| High-value enterprise | Level 1-2 | Personalization critical |
| Mid-market targeting | Level 2-3 | Balance needed |
| SMB volume prospecting | Level 3-4 | Efficiency priority |
| Initial market testing | Level 3-4 | Speed over optimization |
| Mature campaign scaling | Level 2-3 | Proven messaging + volume |
Sending Volume Benchmarks
Understanding optimal sending volumes for automated campaigns.
Daily Sending Limits
| Domain Age | Safe Daily Volume | Maximum Volume |
|---|---|---|
| New (under 30 days) | 20-50 | 75 |
| Young (1-3 months) | 50-100 | 150 |
| Established (3-6 months) | 100-200 | 300 |
| Mature (6+ months) | 200-500 | 500+ |
Exceeding safe volumes risks deliverability damage.
Volume Ramp-Up Schedule
| Week | Daily Volume | Weekly Increase |
|---|---|---|
| Week 1 | 10-20 | Starting point |
| Week 2 | 20-40 | +10-20/day |
| Week 3 | 40-70 | +20-30/day |
| Week 4 | 70-100 | +30/day |
| Week 5+ | 100-150 | +30-50/day max |
Gradual ramp-up protects sender reputation during automation scale-up.
Volume by Sending Infrastructure
| Infrastructure | Daily Capacity | Best For |
|---|---|---|
| Single domain/mailbox | 50-100 | Small campaigns |
| Multiple mailboxes (3-5) | 150-400 | Growing programs |
| Domain rotation (5-10) | 400-1000 | High-volume |
| Enterprise infrastructure | 1000+ | Large-scale operations |
Sequence Automation Benchmarks
Automated sequences form the backbone of cold email automation.
Automated Sequence Performance
| Sequence Element | Automation Impact on Performance |
|---|---|
| Follow-up timing | +0% (no degradation when automated) |
| Pause on reply | Essential (prevents embarrassing sends) |
| Pause on OOO | +5-10% reply quality |
| Activity triggers | +10-20% relevance |
Optimal Automated Sequence Structure
| Timing | Automation Notes | |
|---|---|---|
| Email 1 | Day 0 | Initial send, highest personalization |
| Email 2 | Day 3-4 | Auto follow-up, reference email 1 |
| Email 3 | Day 7-9 | New angle, auto-triggered |
| Email 4 | Day 14-16 | Value add, auto-triggered |
| Email 5 | Day 21-28 | Breakup, auto-triggered |
Automation Trigger Performance
| Trigger Type | Reply Rate Impact |
|---|---|
| Time-based (standard) | Baseline |
| Email open trigger | +5-15% |
| Link click trigger | +15-25% |
| Website visit trigger | +20-35% |
| No engagement pause | Prevents waste |
Personalization in Automated Campaigns
Balancing personalization with automation efficiency.
Personalization Level vs. Automation
| Personalization | Automation Compatible | Reply Rate |
|---|---|---|
| None (pure template) | Fully automated | 1% - 3% |
| Basic (name, company) | Fully automated | 2% - 4% |
| Moderate (industry, role) | Highly automated | 3% - 6% |
| Custom first line | Semi-automated | 5% - 9% |
| Full custom email | Manual | 8% - 15% |
Automated Personalization Techniques
| Technique | Performance Impact | Automation Level |
|---|---|---|
| Mail merge fields | +30-50% vs. none | Full automation |
| Industry templates | +20-40% vs. generic | High automation |
| Role-based messaging | +25-40% vs. generic | High automation |
| AI-generated snippets | +40-70% vs. basic | Medium automation |
| Company research snippets | +60-100% vs. basic | Semi-automation |
AI Personalization Benchmarks
AI-assisted personalization is rapidly evolving:
| AI Capability | Current Performance | Scalability |
|---|---|---|
| Subject line generation | 75-85% of human quality | High |
| First line generation | 65-80% of human quality | High |
| Full email generation | 55-70% of human quality | Medium |
| Company research summary | 70-85% of human quality | High |
Deliverability in Automated Systems
Automation creates unique deliverability challenges.
Deliverability Benchmarks by Automation Level
| Automation Level | Inbox Placement | Spam Rate |
|---|---|---|
| Manual | 90% - 95% | 0.02% - 0.05% |
| Semi-automated | 85% - 92% | 0.03% - 0.08% |
| Highly automated | 80% - 88% | 0.05% - 0.12% |
| Fully automated | 70% - 85% | 0.08% - 0.20% |
Higher automation typically correlates with lower deliverability without proper infrastructure.
Essential Deliverability Features
| Feature | Impact on Deliverability |
|---|---|
| Email authentication (SPF, DKIM, DMARC) | Essential |
| Sending throttling | High impact |
| Domain rotation | Medium-High impact |
| Warm-up protocols | Essential for new domains |
| Bounce handling | Essential |
| Complaint loop integration | High impact |
Domain Warming Automation
| Metric | Manual Warm-Up | Automated Warm-Up |
|---|---|---|
| Time to full volume | 6-8 weeks | 4-6 weeks |
| Consistency | Variable | Consistent |
| Risk of mistakes | Higher | Lower |
| Cost efficiency | Lower | Higher |
Automated warm-up tools can accelerate and standardize the process.
Response Handling Automation
Managing replies at scale requires automation support.
Response Classification Benchmarks
| Classification | AI Accuracy | Human Accuracy |
|---|---|---|
| Positive/interested | 85% - 92% | 95%+ |
| Negative/not interested | 90% - 95% | 98%+ |
| Out of office | 95%+ | 99%+ |
| Referral | 75% - 85% | 95%+ |
| Question/more info | 80% - 88% | 95%+ |
Response Handling Efficiency
| Approach | Time per Response | Accuracy |
|---|---|---|
| Fully manual | 2-5 minutes | Highest |
| AI-assisted triage | 30-60 seconds | High |
| Automated classification + manual action | 1-2 minutes | High |
| Fully automated | 10-30 seconds | Medium |
Most teams benefit from automated classification with human review for responses.
Platform Performance Benchmarks

Different automation platforms show varying performance characteristics.
Key Platform Capabilities
| Capability | Impact on Performance |
|---|---|
| Multi-channel sequences | +20-40% total reply rate |
| Built-in email verification | Reduced bounces |
| AI personalization | +30-60% relevance |
| Advanced analytics | Better optimization |
| CRM integration | Improved workflow |
| Deliverability monitoring | Protects reputation |
Platform Selection Criteria
| Factor | Importance |
|---|---|
| Deliverability features | Critical |
| Personalization options | High |
| Analytics depth | High |
| Integration ecosystem | Medium-High |
| Ease of use | Medium |
| Pricing model | Medium |
Automation ROI Benchmarks
Measuring the return on automation investment.
Time Savings Calculation
| Activity | Manual Time | Automated Time | Savings |
|---|---|---|---|
| Prospect research | 5-10 min/prospect | 1-2 min/prospect | 70-80% |
| Email composition | 5-15 min/email | 1-3 min/email | 75-85% |
| Follow-up tracking | 2-5 min/prospect | 0 min (automated) | 100% |
| Response routing | 2-3 min/response | 30 sec/response | 80-85% |
Cost-Per-Meeting Comparison
| Approach | Typical CPM | Notes |
|---|---|---|
| Manual outreach | $150 - $400 | Highest quality |
| Semi-automated | $75 - $200 | Good balance |
| Highly automated | $40 - $100 | Efficiency gains |
| Fully automated | $25 - $75 | Highest volume |
Lower cost-per-meeting comes with quality trade-offs that vary by use case.
Break-Even Analysis
| Monthly Volume | Automation Investment | Typical Payback |
|---|---|---|
| Under 500 emails | Basic tools | 1-2 months |
| 500-2000 emails | Mid-tier platform | 1-3 months |
| 2000-5000 emails | Advanced platform | 1-2 months |
| 5000+ emails | Enterprise solution | 2-4 months |
Automation typically pays for itself quickly at sufficient volume.
Best Practices for Automated Campaigns
Quality Control Measures
| Measure | Implementation |
|---|---|
| Sample review | Check 5-10% of automated sends |
| Reply rate monitoring | Alert on significant drops |
| Bounce rate alerts | Pause on threshold breach |
| Spam rate monitoring | Real-time tracking |
| Personalization QA | Verify merge fields work |
Common Automation Mistakes
| Mistake | Impact | Prevention |
|---|---|---|
| No pause on reply | Embarrassing follow-ups | Always configure |
| Over-reliance on templates | Low reply rates | Add personalization |
| Ignoring deliverability | Reputation damage | Monitor constantly |
| No testing | Missed optimization | Test continuously |
| Wrong merge fields | Broken personalization | QA before sending |
Automation Scaling Checklist
| Element | Requirement |
|---|---|
| Domain infrastructure | Multiple warmed domains |
| Email verification | Pre-send verification |
| Sequence logic | Reply detection, timing |
| Personalization | At minimum, basic merge |
| Monitoring | Deliverability dashboards |
| Response handling | Classification system |
Setting Automation Standards
Based on industry benchmarks, here are recommended automation standards:
| Standard | Guideline |
|---|---|
| Minimum personalization | Name + company + industry context |
| Maximum daily volume per domain | 150-200 |
| Sequence pause triggers | Reply, bounce, unsubscribe |
| Deliverability monitoring | Daily review |
| Quality sample rate | 5-10% of sends |
| Warm-up period | 4-6 weeks minimum |
Scaling with Automation
Automation enables cold email at scale while maintaining reasonable performance. The benchmarks show that well-implemented automation can achieve 80-90% of manual performance while handling 10-50x the volume. The key is balancing efficiency with quality.
If you want to scale your cold email efforts through automation or need help implementing efficient outreach systems, our team specializes in building high-performance automated campaigns for B2B companies.
Get a free campaign audit and see how your current automation compares to industry benchmarks. We will identify specific opportunities to improve your efficiency while maintaining quality.
Related Reading
Frequently asked questions.
Frequently asked questions- What reply rate should I expect from automated cold email campaigns?
- Reply rates vary by automation level. Semi-automated campaigns typically achieve 5-10% reply rates, highly automated campaigns get 3-7%, and fully automated systems produce 2-4% reply rates. While these are lower than fully manual campaigns at 8-15%, automated approaches generate more total replies per hour invested through significantly higher volume capacity.
- How many cold emails can I safely send per day with automation?
- Safe daily volumes depend on domain age. New domains under 30 days should send 20-50 emails daily, young domains at 1-3 months can send 50-100, established domains at 3-6 months can send 100-200, and mature domains over six months can safely send 200-500 emails per day. Exceeding these volumes risks deliverability damage.
- How should I ramp up automated email volume for a new campaign?
- Start with 10-20 emails daily in week one, then increase by 10-20 emails in week two, 20-30 emails in week three, and 30 emails in week four. After week five, increase by a maximum of 30-50 emails per day. This gradual ramp-up protects sender reputation during automation scale-up and prevents deliverability issues.
- Which automation level should I use for different target markets?
- High-value enterprise prospects require Level 1-2 automation with manual research and templated personalization. Mid-market targeting works best with Level 2-3 segment-based automation. SMB volume prospecting should use Level 3-4 AI-assisted automation where efficiency is prioritized. Initial market testing benefits from Level 3-4 for speed, while mature campaigns scale best with Level 2-3 automation.
- Do automated email triggers improve reply rates?
- Yes, automation triggers significantly improve reply rates over standard time-based follow-ups. Email open triggers increase reply rates by 5-15%, link click triggers boost rates by 15-25%, and website visit triggers improve rates by 20-35%. No engagement pause features prevent wasted sends without improving rates but protect campaign efficiency.
About the author.

Hosun Chung is COO at RevenueFlow, which builds and operates outbound revenue engines for B2B companies. Previously at Gleacher Shacklock LLP. Studied at London School of Economics.
Hosun Chung · COO
Connect on LinkedIn →Explore more.
Ready to scale your outreach?
We build GTM engines that book real meetings. See the receipts.
Related articles.
Cold Email Spam Rate Benchmarks: 2026 Performance Data
Industry standards require keeping spam complaint rates below 0.1% to maintain sender reputation. Learn the benchmarks and strategies to protect your cold email deliverability.
Cold Email Follow-Up Benchmarks: 2026 Performance Data
The follow-up benchmarks kept intact and read against their own definitions, plus why RevenueFlow sends one message per campaign instead.
Cold Email Bounce Rate Benchmarks: 2026 Performance Data
A 3.04% platform bounce rate held 1.27% true hard bounces, 2.38% with blocks included, and 12.6% delay notices. What low bounce email data is made of.
Cold Email Subject Line Benchmarks: 2026 Performance Data
Industry data reveals that subject lines determine 35-50% of open rate variation. Discover the benchmarks for length, personalization, and format that drive the highest engagement.
Cold Email Personalization Benchmarks: 2026 Performance Data
LeadMagic, Cognism, Explorium and others sell funding and competitor signals. What published data ties to higher reply rates, and how to turn a signal into a line.
Cold Email Sequence Benchmarks: 2026 Performance Data
Every industry sequence figure, kept intact and read honestly: the opening message produces 30-40% of replies, and here is what the rest of them cost.