Total Addressable Market: The Ceiling, and What It Cannot Be Used For
A target ceiling is the highest figure a target could ever reach, and in market sizing that ceiling is the total addressable market: the organisations with the problem multiplied by what one is worth a year, with nothing limiting reach. It decides whether a category is worth entering, never who to contact.
Key takeaways
- Total addressable market is a target ceiling: the count of organisations with the problem multiplied by the annual revenue one of them produces, with no constraint on reach assumed.
- Computed top down it inherits an industry figure's category boundary; computed bottom up it produces a checkable count and a list of company names.
- A very large addressable market says the category is worth entering and nothing about reach: four hundred million can be 800 companies or 80,000, which need different channels.
- TAM cannot size a territory, set a quota or support a growth projection, because it deliberately excludes every constraint that decides those.
Total addressable market is the whole revenue opportunity for a product, assuming every organisation with the problem it solves buys it and nothing constrains you from reaching them. By definition it is a target ceiling, the upper bound every realistic target sits beneath, rather than a plan, and the constraints it deliberately ignores are what separate it from the two smaller numbers that sit under it.
The abbreviation is TAM, and it is worth expanding because the three letters get applied to two different things: the unconstrained population defined here, and the much smaller list a team is actually working, which is a serviceable addressable market.
Target ceiling: the definition, and why TAM sits above every target
A target ceiling is the highest figure a target could ever reach, and in market sizing that ceiling is the total addressable market: every organisation with the problem, multiplied by what one of them is worth in a year, with nothing limiting your reach. Every realistic target sits beneath it, because the path from the ceiling to a share of it runs through every constraint the definition removed.
That is also why a ceiling is a poor thing to aim at directly. A sales target is set against what can be reached with the channels, the product and the team that exist now, which is the serviceable number, and the share of it that can be won in a stated period.
The arithmetic, and the two ways to reach it
The B2B form of the calculation is short. Count the organisations that have the problem, multiply by the revenue one of them would produce in a year, and the product is the total addressable market. In a subscription business the second term is the annual contract value a customer of that shape carries.
Everything interesting sits in how each term is arrived at, and there are two directions.
Top down starts from a published industry figure and narrows it with percentages. It is fast, and it inherits every assumption inside the industry figure, beginning with the definition of the category, which is nearly always broader than the one you actually serve.
Bottom up starts from a count of organisations matching criteria you wrote, and multiplies by a contract value you can evidence from your own closed deals. It is slower and considerably more useful, because both terms are things somebody can check.
Doing both is the point rather than a luxury. When the two disagree by an order of magnitude the disagreement is the finding, and it almost always means the top-down number is counting a category wider than yours.
Why it matters: it decides what the number is allowed to be used for
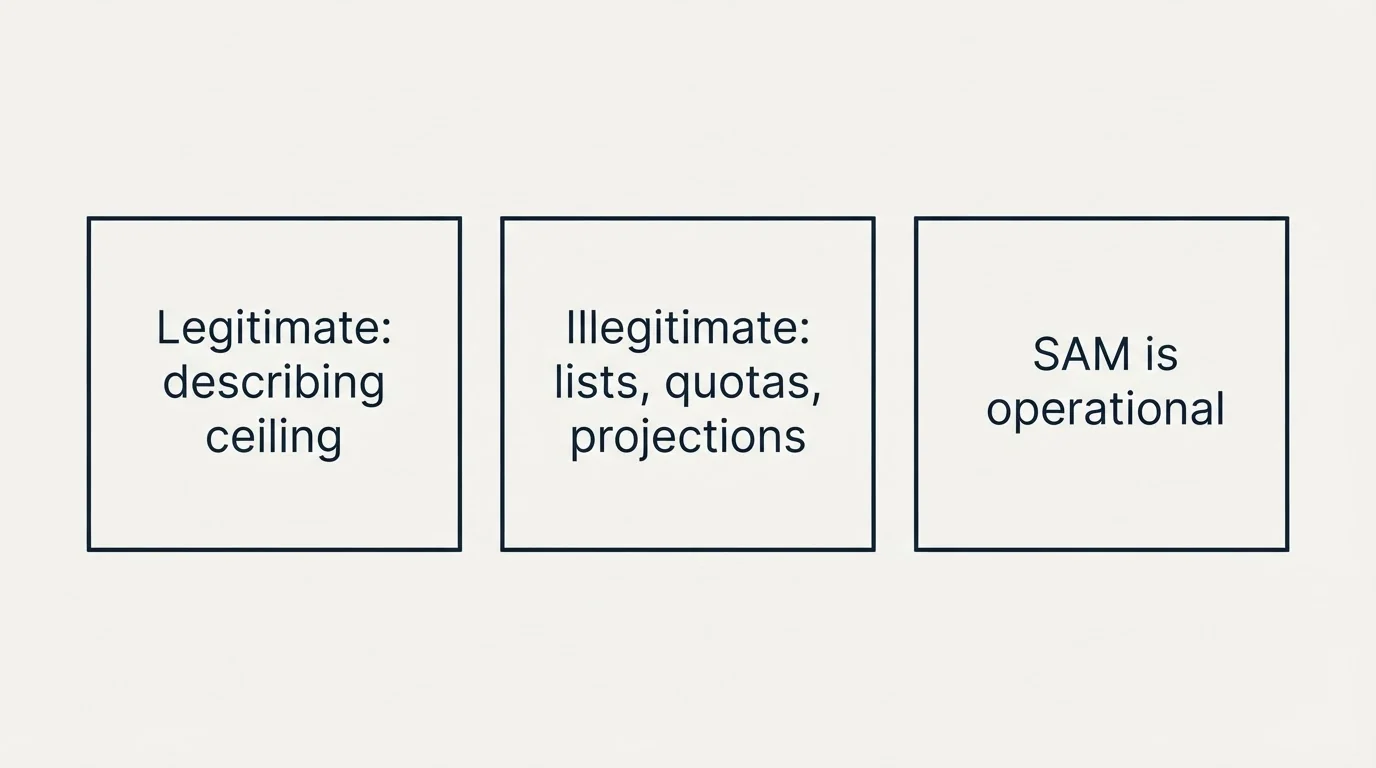
TAM has one legitimate job and several illegitimate ones, and the trouble starts when a figure produced for the first gets used for the others.
The legitimate job is describing a ceiling. An investor assessing whether a company could become large, or a leadership team deciding whether a category is worth entering at all, is asking a question about the ceiling, and a theoretical maximum is the right instrument for it. A category whose entire ceiling is smaller than your ambition is a strategic fact worth knowing before anything else is decided.
The illegitimate uses all involve treating the ceiling as a plan. A TAM does not tell a sales team who to contact, because it contains organisations you cannot sell to today. It does not size a territory or a quota, for the same reason. And it does not support a growth projection, because the path from a ceiling to a share of it runs through every constraint the definition removed.
That is why the middle number is the operational one. The serviceable addressable market is TAM narrowed by the things that are true about your business now, and it is the only one of the three whose construction forces you to name your own constraints. The full build, including the bottom-up method and the reason the intermediate output is worth more than the figure, is in the serviceable addressable market entry.
Describing a ceiling
- Deciding whether a category is worth entering at all
- An investor assessing whether a company could become large
- Learning early that a category's whole ceiling is smaller than your ambition
Treating the ceiling as a plan
- A target list: it contains organisations you cannot sell to today
- Sizing a territory or a quota
- A growth projection: the path to a share of it is undefined
- Comparing against another company's published figure, whose method you cannot see
What a very large addressable market does and does not tell you
A large addressable market is usually quoted in money, and money hides the reach question. Take two illustrative markets with the same ceiling of four hundred million. One is eight hundred companies at five hundred thousand each, a reachable population of eight hundred organisations and perhaps a few thousand relevant people, which one team can contact deliberately inside a year. The other is eighty thousand companies at five thousand each, which nobody researches one account at a time, so coverage becomes a volume question and the channels change with it.
So a very large addressable market answers the question it was built for, whether the category is worth entering, and says nothing about whether your channel can cover it. Before treating a big number as good news, divide it by the contract value you can evidence and look at the count that comes out. Report the count beside the money, always.
Where the textbook definition misleads
The constraints get relaxed quietly to make the number bigger. Every cut shrinks the total, so there is a standing incentive to define the market a little wider: a geography you do not support, a company size the product does not fit, an adjacent category you have never sold into. Each relaxation is individually arguable and the cumulative effect describes a business you do not run.
Averaging contract value across a wide range conceals two markets. A figure built on a blended average that is actually five thousand at one end and two hundred thousand at the other contains at least two markets with different buyers, different cycles and different channels. Size each separately, or the total describes neither.
Databases are estimates. Employee counts and revenue figures in commercial databases are frequently wrong for private companies, and wrong differently by country. Sample twenty rows by hand against public sources before trusting a count built on them, and treat the result as carrying a wide margin rather than as a fact.
A small market is not bad news. A market of a few hundred companies is unsuitable for broad advertising and extremely suitable for named-account outbound, because you can reach all of it deliberately over a year without exhausting it. The strategic consequences of that are worked through in cold calling with a small TAM.
There is a third thing the figure cannot do, and it is the one that produces arguments rather than bad plans. A TAM is a management number governed by no accounting standard, so two companies quoting one are frequently measuring different things: a different category boundary, a different treatment of adjacent products, a different assumption about whether existing customers of a competitor count. Comparing your figure against a published one from an investor deck or a market report therefore tells you very little, because you cannot see which choices were made on the other side. A change in your own figure between periods deserves the same suspicion: interrogate it as a possible definitional change before reading it as a commercial one, particularly after a pricing revision, a packaging change or the arrival of somebody new in a reporting role.
How it is used in outbound

For an outbound programme the useful output of a market-sizing exercise is not the figure. It is the company count and the list that produced it.
A bottom-up count is built by writing inclusion criteria as filters a stranger could check, running them against a source you can name, and keeping what comes back. The intermediate artifact of that process is a set of company names, which is directly usable as a target list. A market size computed top down produces a slide. The same hour spent bottom up produces the slide and the list, which is why the sizing exercise and building an ICP are better run as one piece of work than two.
A total addressable market calculation is the same bottom-up build used for a serviceable addressable market, stopped before the constraint step, and a total addressable market example is that build carried through with one set of figures.
The count also decides the shape of the motion, and it splits at a threshold most teams never compute. Below roughly a few thousand companies the entire market is addressable by name: you can research accounts individually, write to the people in them specifically, and cover the market in a planned cycle. Above that, coverage becomes a volume question and the channels change with it. Reaching an entire market rather than a sample of it is a cycle rather than a bigger single send, sized so that every segment is contacted before the first one is due again.
There is a constraint the count imposes that no amount of effort removes. A plan to double or triple contacted volume is bounded by how many companies match the criteria, not by how much work is applied to the ones that do. Where the market is genuinely small, the growth lever is the criteria or the offer rather than the sending capacity, and the arithmetic by deal size that decides which motions are affordable at all is in B2B SaaS lead generation.
| Check | Verdict |
|---|---|
| The company count is reported beside the revenue figure | Required |
| The count comes from a source you can name | Required |
| Contract value is segmented, not blended into one average | Required |
| Computed both top down and bottom up, with the gap explained | Required |
| Inclusion criteria are written as filters a stranger could check | Required |
| Used to size a territory or a quota | Never |
| Compared against another company's published figure | Never |
Related terms
Serviceable addressable market is the operational number, TAM narrowed by your own constraints, and the one a target list can be built from. Annual contract value is the multiplier in the arithmetic and the figure that decides which sales motions the market can afford. Market segmentation is how a market is split when it contains several. Territory planning is the allocation problem the serviceable number feeds, and firmographic data is the attribute set the inclusion criteria are usually written against.
The short version
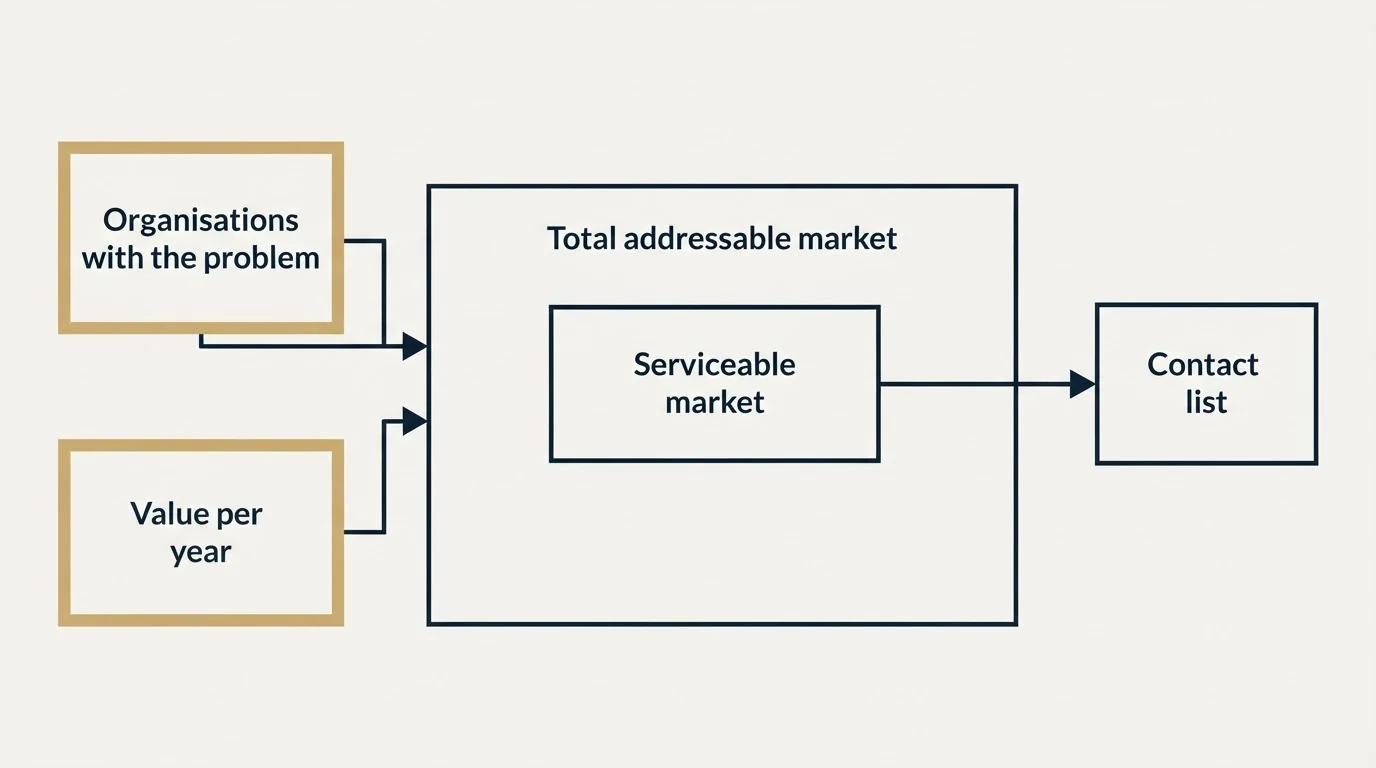
Total addressable market is the whole revenue opportunity assuming no constraints, computed as the count of organisations with the problem multiplied by what one of them is worth in a year. It is a ceiling, useful for deciding whether a category is worth entering and useless for deciding who to contact. Compute it both ways, report the company count beside the money, keep contract value segmented, and move to the serviceable number as soon as the question becomes operational, because that is the one whose construction names your constraints and whose by-product is a list.
RevenueFlow contacts the companies inside a serviceable market against criteria agreed in writing before launch. See what a first campaign produces.
Frequently asked questions.
Frequently asked questions- What does target ceiling mean?
- A target ceiling is the highest figure a target could ever reach. In market sizing that ceiling is the total addressable market: every organisation with the problem, multiplied by what one of them is worth in a year, with nothing limiting your reach. Realistic targets sit beneath it, set against the serviceable market and the share of it that can be won in a stated period.
- How do you calculate total addressable market?
- Count the organisations that have the problem your product solves, then multiply by the annual revenue one of them would produce, which in a subscription business is annual contract value. Do it top down from an industry figure and bottom up from a count you build yourself. Where the two disagree by an order of magnitude, the disagreement is the finding.
- Is a very large addressable market always good news?
- It is good news for one question, whether the category is worth entering. It says nothing about reach. The same four hundred million can be eight hundred companies at five hundred thousand each, which one team can cover by name in a year, or eighty thousand at five thousand each, which turns coverage into a volume question. Report the company count beside the money.
- What is the difference between TAM, SAM and SOM?
- TAM is everyone with the problem, with no constraints assumed. SAM narrows that by what is true about your business today: geography, company size, regulation, integrations, language and price. SOM is the share of SAM you could realistically win in a stated period against competition and capacity. Each cut downward is a constraint being named out loud.