Predictable Pipeline: Four Ratios and a Ceiling
Four multiplications decide what an outbound programme produces. How to read each one, work a meetings target backwards, and find the supply ceiling first.
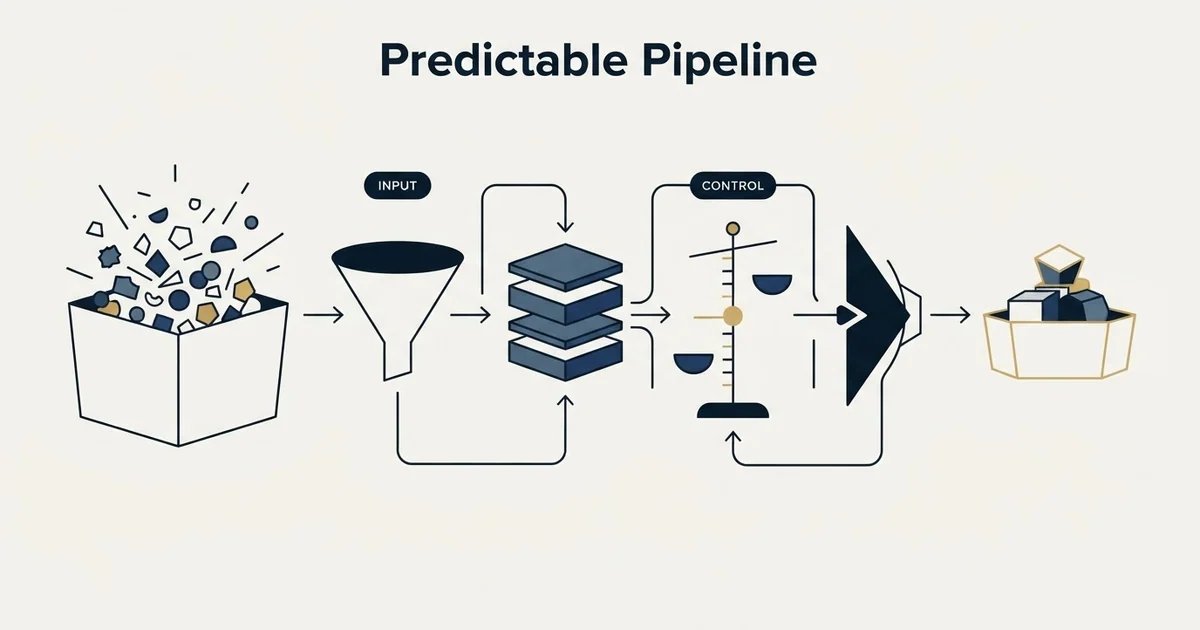
A predictable pipeline is one where next month's meetings can be stated in advance from named inputs: a counted population of companies and ratios that hold from month to month. Four multiplications decide a written outbound programme: deliverable rows out of sourced rows, replies out of delivered, positive share of replies, and meetings held out of positive replies.
Key takeaways
- A predictable pipeline gets its predictability from the inputs behind a forecast: a counted population, measured ratios and definitions that hold still.
- Each of the four ratios is a verdict on a different stage, so a missed month reads back to the one stage that moved.
- Working a meetings target backwards through the four ratios tests it against the number of companies the segment contains, on day one.
- A one message programme spends each prospect once per premise, so supply is bounded by the segment, never by sending capacity.
Reviewed and updated October 1, 2026
A founder signs off an outbound plan promising ten meetings a month. The plan contains a headcount, a sending volume, a copy calendar and a start date. It contains no statement of how many companies exist that the message is true of, and no ratio anywhere connecting the volume to the ten. Four months later the programme has produced six meetings in total, and the review is about effort.
A predictable pipeline gets its predictability from the inputs behind the forecast, never from the forecast. A pipeline number is predictable when you can name the population it was measured over, name the ratio that produced it, and expect both to hold next month. Where either is missing, what you have is a number with a good track record, which is a different and much shorter-lived thing.
What is a predictable pipeline?
A predictable pipeline is one where next month's meetings and opportunities can be stated in advance from inputs you control: a counted population of companies, a small set of conversion ratios measured on that population, and definitions that hold still. It is predictable because every reported number names what it was measured over, so a miss can be traced to the stage that moved.
The phrase gets used for two weaker things. One is a pipeline that has been steady for a few months, which is a track record with no explanation attached. The other is a forecast produced by a tool, which is a reading of the same unexplained number. Neither says what happens when the month comes in short, and that is the moment predictability gets tested. The plan in the opening paragraph failed that test on day one: it had a volume and a target and nothing joining them.
The four ratios that decide a written outbound programme
Everything a cold email programme produces passes through four multiplications, and every claim anyone makes about outbound, in either direction, is a claim about one of them. Getting them onto paper for your own market takes an afternoon and it settles arguments that otherwise run for quarters.
Deliverable rows out of sourced rows. How much of the list survives verification and reaches a real mailbox. This is a property of the list build and of the data behind it, and it is the only one of the four you can measure before spending anything on sending. It is also the one people assume rather than count.
Replies out of messages delivered. Whether the premise is true of the people who received it. A reply rate is a verdict on the segment definition far more often than it is a verdict on the writing, which is why a copy rewrite is the most common wrong response to a low one.
Positive share of replies. Of the people who answer, the share who want the conversation rather than declining it or forwarding it elsewhere. This is a verdict on the offer and on whether the segment can act. Out of office replies and auto responders are not replies at all, and counting them inflates the first ratio while quietly degrading this one.
Meetings held out of positive replies. Booked is not held. The gap belongs to response speed, to the booking mechanics and to no shows, and a programme reporting bookings while the calendar fills with absences has chosen the flattering number.
Multiply the four and you have meetings held per thousand rows sourced. That is the number a plan is actually built on, and almost no plan states it.
Reading a missed month back to the stage that moved
Here is what the four ratios buy when a month comes in short. The figures are invented to show the reading, and they reuse the worked example further down this page.
A programme has been holding ten meetings a month. Then a month produces six. With nothing written down, the review is about effort, as it was in the opening paragraph. With the four counts printed side by side, the review takes a minute.
| Stage | A normal month | The month that missed | The ratio |
|---|---|---|---|
| Rows sourced | 3,750 | 3,750 | the population |
| Delivered | 3,000 | 3,000 | Four in five, held |
| Replies | 60 | 60 | Two in a hundred, held |
| Positive replies | 15 | 15 | One in four, held |
| Meetings held | 10 | 6 | moved Two in three fell to two in five |
Fifteen people wanted the conversation in both months. In the short month nine of them never reached a held meeting, so the thing to inspect is how fast positive replies were answered, how the booking worked and how many accepted invitations were no shows. A team without the table would most likely have rewritten the email, which was the one part performing exactly as before.
Working the target backwards, which is the version that stops bad plans
Forwards tells you what a list can produce. Backwards tells you whether the market contains enough companies to support the target at all, and backwards is the direction almost nobody runs.
Take the ten meetings a month. Divide by the held rate to get the positive replies you need. Divide by the positive share to get total replies. Divide by the reply rate to get delivered messages, and by the deliverable share to get rows sourced. Then compare that number against the count of companies your segment definition actually contains.
Worked with invented figures, purely to show the shape: at a held rate of two in three, ten meetings need fifteen positive replies. At a positive share of one reply in four, that needs sixty replies. At a reply rate of two in a hundred, that needs three thousand delivered messages. At a deliverable share of four in five, that needs three thousand seven hundred and fifty sourced rows, every month. None of those four figures is a benchmark and none is measured; substitute your own and the structure holds.
Now put that beside the segment. If the written definition of who you sell to contains four thousand companies in total, the invented plan above consumes 94% of the market in the first month and leaves two hundred and fifty rows for the second. That is not a copy problem, a tooling problem or a discipline problem. It is an arithmetic result available on day one, and it is the single most useful thing the exercise produces.
The outbound sales playbook covers how the segment gets defined tightly enough to be counted in the first place, and the property that matters here is exhaustibility: a segment you cannot enumerate is a filter wearing a segment's clothes, and a plan built on one cannot be checked against anything.
The ceiling a one-message programme runs into

Every outbound programme has a supply ceiling. A programme that sends one message per prospect has a stricter one, and being explicit about it is what keeps the arithmetic honest.
House doctrine here is one message per campaign, with no bumps and no thread replies. That constraint has a direct consequence for predictability: each prospect is spent once per premise, so the programme cannot buy more attempts from the same people.
Read one way that sounds like a limitation. Read the other way it is what makes the arithmetic readable at all. In a programme that sends five touches to each prospect, the reply rate reported is a rate across an unknown number of exposures, the denominator moves every week, and nobody can say afterwards which message produced which answer. One message per prospect means one clean attribution per contact and one stable denominator, which is the condition under which a ratio can be compared to itself next month.
The practical planning rule that falls out of it: capacity is the smaller of what your sending infrastructure can carry and what your segment can supply, and for a well defined segment the segment is usually the binding constraint. Adding mailboxes against an exhausted list buys nothing.
Multi-touch cadence
Repeated contact with non-responders
- The denominator moves with every added touch
- A reply is attributed to a step inside a sequence
- Later touches reach only people who already declined
- Supply feels larger because the same names are reused
- Reputation cost accrues across the sending domain, outside the report
One message per campaign
What we run
- One exposure per prospect per premise, so the denominator is the list
- One clean attribution per contact
- Supply is visibly bounded by the size of the segment
- The cost sits in reach, and it is stated where the other is hidden
What turns a ratio into a forecast rather than a coincidence
A ratio measured once is a description of one campaign. Four things have to be true before it predicts anything.
The denominator is named and stable. A reply rate quoted without saying whether the base is rows sourced, messages delivered or inboxes reached can differ by a factor of two between two people using the same word. Print the input count beside the accepted count beside the outcome count, in the report format itself, and treat any rate whose denominator is unnamed as unevaluated rather than as a pass.
The sample is large enough to be read. Two positive replies out of eighty is not a two and a half percent rate, it is two events. Segment level ratios need enough volume behind them that one extra reply does not move the number materially, and below that threshold the honest report says how many events it saw rather than converting them into a percentage.
The cohort is dated. Meetings held this month were produced by contacts created in an earlier month. Dividing this month's meetings by this month's sends compares two different populations and produces a figure that means nothing. The fix is a field on the record carrying the month the contact entered the programme, and it is covered in more detail in pipeline lead generation, where the same arithmetic failure shows up between marketing and sales.
The definitions hold still inside a period. Tighten what counts as a positive reply and the positive share falls while nothing about the programme changed. Loosen it and the reverse. A dated definition with readable version history is what lets you tell a population change from a ruler change, which is the same discipline six pipeline metrics applies to the numbers further down the funnel.
The channel comparison worth making before any of this

The same four ratio structure exists on the phone, with different stages: reachable contacts, connect rate, conversation to meeting, and show rate. That version is worked through in cold calling as a lead source, and comparing the two on your own market is more useful than comparing either against a published benchmark.
The reason to run both calculations before committing is that they fail in different places. Written outbound is constrained by how many companies the premise is true of. Calling is constrained by dialing hours, which are a fixed quantity per person, and by how many of your records reach a human on a phone. A market too small for written outbound to reach a volume threshold is often exactly the market where calling wins, and the arithmetic says which situation you are in before a salary is committed to finding out.
Coverage ratios further down the funnel behave differently again, and a multiple quoted without the win rate underneath it carries almost no information, which is the argument in pipeline coverage.
What predictability cannot buy
Two things sit outside every version of this arithmetic, and a plan that pretends otherwise will miss for reasons the model cannot show.
Timing is the first. Fit is a decision you make and timing is a fact about the buyer's year. A segment can be perfectly chosen and the specific companies in it can all have signed with somebody else last quarter. Nothing in the ratios observes that, which is why a stable programme still has bad months and why judging a month in isolation produces the wrong decision roughly as often as the right one.
The second is that ratios describe a machine that is already working. Where the reply rate is near zero, dividing by it produces a number so large it stops being informative, and the useful response is to fix the premise rather than to plan against the ratio. Arithmetic tells you whether a working programme can hit a target. It does not tell you how to make a programme work.
The short version

Predictable pipeline means the inputs are named and the ratios hold, not that a forecasting tool agrees with the plan. Four multiplications decide a written outbound programme: deliverable rows out of sourced rows, replies out of delivered, positive share of replies, and meetings held out of positive replies. Each one is a verdict on a different stage, so reading a bad number back to the stage that produced it is where the diagnosis starts.
Run the target backwards through those four and compare the result against the count of companies your segment contains. Where the backwards arithmetic asks for more rows per month than the market holds, the target is unreachable at any level of skill and the honest options are to widen the segment, change the channel, or lower the number.
A one message programme spends each prospect once per premise, so supply is bounded by the segment rather than by sending capacity, and the compensation for that is a denominator that stays still long enough to be compared with itself. Name the denominator, date the cohort, report meetings held, and keep the qualification definition frozen inside the period.
If the constraint turns out to be that nobody has built the segment or measured the four ratios on it, see what a first campaign produces against your market.
The figures in the worked example are invented to show the structure of the calculation and are not benchmarks or measured results. Measure your own.
Frequently asked questions.
Frequently asked questions- What is a predictable pipeline?
- A predictable pipeline is one where the population behind every reported rate is named and the ratios that produce the number hold from one month to the next. A figure with a good track record and no stated denominator does not qualify, because nothing about it says whether next month will resemble the last. Predictability sits in the inputs, and no reporting tool adds it.
- How do you build a predictable pipeline?
- Count the companies your segment definition contains. Measure four ratios on your own market: deliverable rows out of sourced rows, replies out of delivered, the positive share of replies, and meetings held out of positive replies. Work the target backwards through them, compare the rows needed against the segment, date every cohort, and freeze the qualification definition inside each period.
- How many leads do I need for ten meetings a month?
- Nobody can answer that without four numbers from your own market: the share of sourced rows that survive verification, the reply rate, the positive share of replies, and the share of positive replies that become meetings held. Divide the target backwards through those four and you have the required sourced rows. Published benchmarks will not substitute for measuring your own.
- Why does the segment size decide the ceiling?
- Because a written outbound programme sends to a finite list of companies the message is true of, and one message per prospect means each of them is spent once per premise. Where the backwards arithmetic asks for more rows a month than the segment contains, no amount of sending capacity closes the gap. The honest responses are a wider segment or a lower target.
About the author.

B2B cold email experts helping companies generate qualified leads through done-for-you outreach campaigns.
RevenueFlow Team
Explore more.
Ready to scale your outreach?
We build GTM engines that book real meetings. See the receipts.
Related articles.
Sales Cycle Length Benchmarks: What Each Figure Counts
The published B2B sales cycle benchmarks, sorted by what each page says it counted. The same number means two different things in two of them.
Win Rate Benchmarks: Which Figures State a Population
A catalogue of the published average sales win rates, sorted by whether the page names the population behind its own number. Most do not.
SDR Outsourcing for Business Brokers: The Fee Timing
Whether a success-fee brokerage should rent sales development at all: the fee timing, the texts that limit what an outside person may say about value, and who signs.
SDR Outsourcing for Logistics Companies: The Brokerage Line
What an outside sales development team may do in a freight company's name, the calling and email rules it inherits, and which arrangement survives a bid-shaped market.
Appointment Setting for Business Brokers: The Seller Meeting
What a bought meeting with a business owner has to be for a brokerage: the three-part qualification, the confidentiality rules, the licence line and the owner's reasons.
Sales Enablement Charters: What the Published Ones Ask For
Six publishers set out what a sales enablement charter should contain. Five describe a document nobody can check, and one writes a definition with inspection in it.