Leaky Sales Funnel: Find the Seam Before You Widen the Top
A leak is a stage-to-stage rate that fell, not the fact that most companies never buy. The five seams a B2B funnel loses at, and what causes each one.

A leaky sales funnel is one where a specific stage-to-stage conversion rate has fallen against your own history. Five seams carry almost all of it: delivery and premise, response speed, written acceptance criteria, the first conversation, and the paperwork route. Name the seam and its evidence before adding volume, because volume multiplies every rate below it.
Key takeaways
- A leaky sales funnel has one located fault: a stage-to-stage rate that fell over a stated population. Most contacted companies never buying is how every funnel behaves.
- Write each seam as a count out of a count for two periods, and the one that fell shows itself while the others read as held.
- The first seam fails for three causes in a fixed order: delivery, then list, then premise. Rewriting copy first fixes none of them.
- Widening the top multiplies every rate below it including the broken one, so the number can recover while the seam stays broken and the cost rises.
Reviewed and updated October 1, 2026
A revenue leader opens the quarter with a diagnosis already made. The funnel is leaking, so the team needs more at the top of it. Two months and a larger list later the closed number has not moved, the cost per meeting has gone up, and the leak everyone agreed on has never been located.
A leaky sales funnel is the diagnosis in that story, and the word leaking is doing none of its work precisely. Losing people at every stage is what a funnel does. The useful question is narrower: which single stage transition is losing more than it used to, or more than a comparable motion does, and what specifically is causing that transition to fail. Until a seam is named, widening the top is the only available action, and it is the most expensive one on the list.
What is a leaky sales funnel, and what is not one?
A leaky sales funnel is one where a specific stage-to-stage conversion rate has fallen, against your own history or against a rate the plan assumed, so fewer of the people who enter that stage come out of it than used to. A leaky funnel is a located fault. The fact that most contacted companies never buy is how every funnel behaves, and no repair applies to it.
That distinction matters because it decides what the number is measured over. A rate needs a population underneath it, and the population is the thing that gets quietly changed while the rate is being discussed. Reporting one top-to-bottom figure guarantees you cannot see a seam, because five multiplied rates produce one number that moves for five different reasons. The difference between counting people and counting deals is where the confusion starts, and holding the two apart is a precondition for reading either.
Three things get called leaks and are not.
Disqualification is an output, not a loss. A conversation that ends because the company does not fit returned time to the team. Counting it as leakage rewards keeping bad deals alive.
A stage that never had a mechanism cannot leak. Where a stage exists because a diagram wanted a fourth box, people sit in it and eventually leave, and no fix applies because nothing was ever supposed to move them.
A definition change is not a performance change. Tightening what counts as qualified shrinks the qualified count immediately. That looks identical to a leak on a chart, and it is the opposite of one.
Find the seam before you widen the top

The instinct to add volume survives because it is the one lever anybody can pull without agreement from another function. It is also the lever with the worst arithmetic, because volume multiplies through every rate below it, including the broken one.
Take the chain in order and the reason becomes visible. Suppose, purely as an invented illustration that describes no real campaign, a motion contacts 2,000 companies a month, 40 reply, 24 hold a meeting, 12 are accepted as opportunities and 3 close. Doubling the contacted number to 4,000 produces 6 closes and doubles the cost of everything upstream. Lifting the reply-to-meeting rate from 24 in 40 to 32 in 40 produces 4 closes and costs one process change. Every figure in that paragraph is invented for the illustration.
The shape that survives the invented numbers: the rates nearest the top move the most volume, and the rates nearest the bottom move the least, so a leak high in the funnel is worth more attention than a leak low in it even when the low one looks worse as a percentage.
Locating the seam: a worked example with invented numbers
Carry the same invented motion forward a quarter. Closed deals have fallen from 3 a month to 2, and the meeting is asking for a bigger list. Before anybody agrees, write each seam as a count out of a count, for both periods.
| Seam | A month last quarter | A month this quarter | Reading |
|---|---|---|---|
| Contacted to replied | 40 of 2,000 | 40 of 2,000 | Held |
| Replied to meeting held | 24 of 40 | 16 of 40 | fell |
| Meeting held to accepted | 12 of 24 | 8 of 16 | Held, one in two |
| Accepted to closed won | 3 of 12 | 2 of 8 | Held, one in four |
One seam fell: 24 replies in 40 used to reach a held meeting and now 16 do. Everything below it is performing as before on a smaller intake, which is the whole reason the closed number dropped. The causes at that seam are response speed and booking friction, so the first thing to pull is how long replies waited for a human.
Now price the alternative. Holding the broken rate, a list of 3,000 produces 60 replies, 24 meetings, 12 accepted and 3 closed. The number recovers, the cost of everything upstream rises by half, and the seam is still broken underneath it. Every figure in this example is invented.
The five seams, and what actually causes each
Every stage boundary is a handoff, either between two functions or between your side and the buyer's. Each fails for a small number of reasons, and the reasons are distinguishable if you look at the right evidence.
Contacted to replied
This seam fails for three causes that produce an identical symptom, which is why it is the one most often misdiagnosed as a copy problem.
The message did not arrive. Deliverability faults show up as a low reply rate and nothing else, and rewriting the copy fixes none of it. Check placement and address verification before you touch a word of the message.
The list was wrong. A good message to a company that does not have the problem performs like a bad message. This is the most common cause and the least popular finding, because it implicates work done weeks earlier.
The premise was generic. A first message has to name something specific enough that the recipient recognises their own situation in it, and a merge field around a category sentence does not clear that bar.
The order to check them in is fixed: delivery, then list, then premise. Reversing it produces three rewrites of copy that was never the problem.
Replied to meeting held
Two causes, and both are operational rather than commercial.
Speed. A reply has a short window of relevance, and a queue nobody can see is where the window closes. If replies wait a day for someone to notice them, the seam is a routing problem and it is cheap to fix.
Friction in the booking. Every extra step between yes and a calendar entry loses some fraction of the people who said yes. Proposing two times beats sending a link that asks the buyer to do the work.
Meeting held to accepted
This seam is where the argument between the people who source meetings and the people who take them lives, and it almost never gets settled by discussing quality.
The cause is nearly always that acceptance criteria were not written down before anything launched, so the bar moves with whichever number is short that quarter. Both sides can then be honest and still disagree permanently. The four disagreements underneath that pattern, and the order to fix them in, are set out in GTM misalignment.
Our own commercial position is a version of this made contractual. Meetings are qualified against criteria agreed in writing before a campaign launches, and budget, timing and authority are deliberately outside the definition, because a real conversation with the right person should not become voidable afterwards on a fact that changes every quarter.
Accepted to proposal
The usual cause here is a first conversation that produced a pleasant exchange and no information. A meeting that ends with a promise to send something over has not produced a next step, and the deal is already stalled before anybody notices.
The fix is in the structure of the conversation rather than in the follow-through. Running a discovery call that disqualifies well covers the last five minutes specifically, because that is where the discipline collapses.
Proposal to closed
Two causes dominate, and they are frequently confused.
The commercial one is that the price is being argued against an unquantified problem. When the buyer never named a cost, your number is being compared to their general sense of what things ought to cost, and there is no argument you can win from there.
The administrative one is that nobody mapped the route between agreement and payment. Security review, procurement, legal and the signature chain each have an owner and a queue, and a deal held up by them is not lost. It slips, which is worse for planning, because it stays in the forecast and quietly moves the number.
The denominators that hide a seam
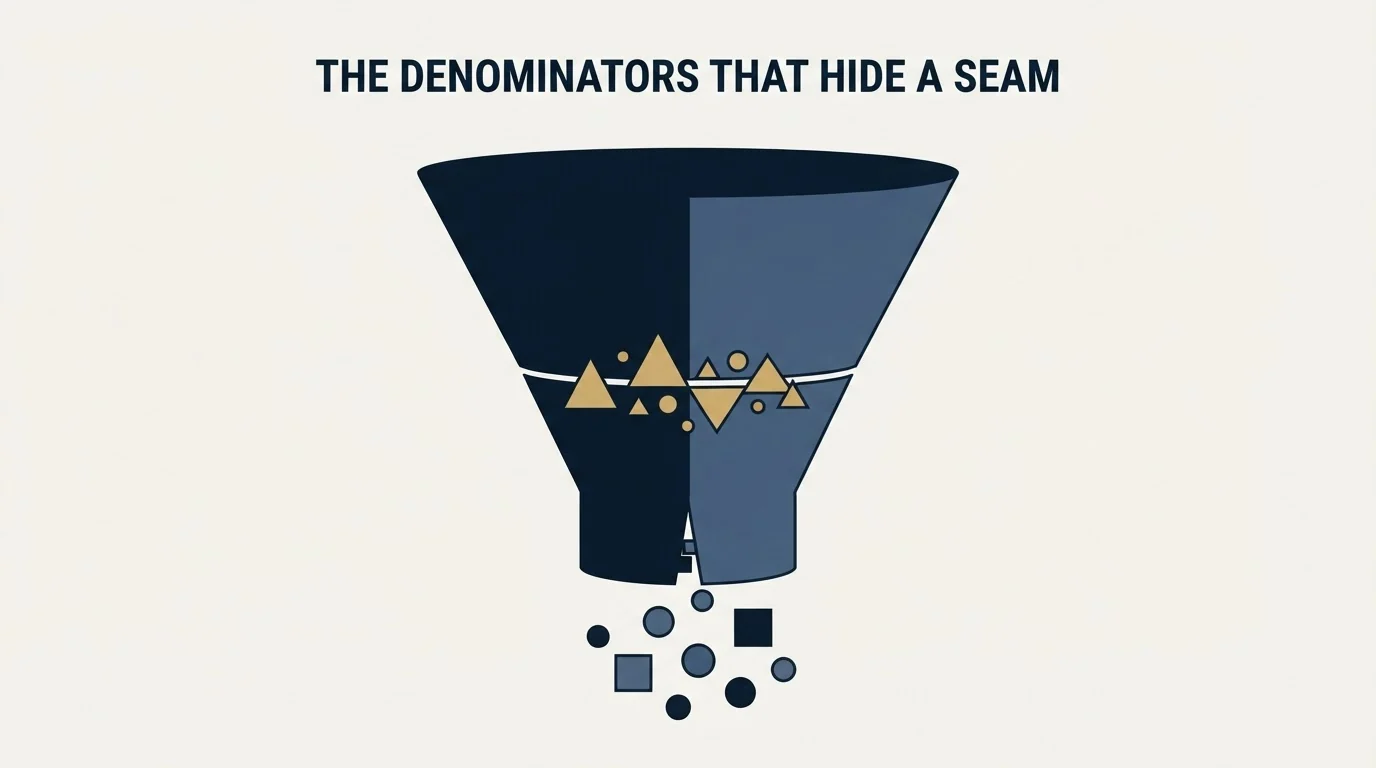
Two measurement habits make a deteriorating funnel look stable, and neither requires anybody to be dishonest.
Measuring the meeting rate against meetings booked rather than meetings held removes every no-show from the calculation. The number improves and describes less. Measuring the qualified rate against the deals that reached the previous stage, rather than against everyone contacted, does the same thing one rung up.
The correction is small and unpopular: write the denominator into the sheet beside every percentage, and count the people who left each stage rather than only the survivors. Knowing that four hundred entered a stage and eleven emerged is a more useful sentence than any conversion figure. The columns that make this recordable are in the sales funnel template.
The second habit is reading a snapshot. Deals close in the period they close, while the volume that produced them happened months earlier, so a single month read on its own attributes this month's wins to this month's activity. Read the same sheet across several periods with the top-of-funnel line included and the picture inverts often enough to be worth the effort.
Sample size is the constraint underneath both habits, and the four questions a sales analysis answers shows which record each one needs before a dashboard is built.
Widen the top
The available lever
- Multiplies every rate below it, including the broken one
- Cost rises immediately and in proportion
- Works when the seams are genuinely healthy
- Requires no diagnosis and produces none
- Hides the seam under a larger absolute number
Fix the seam
The cheaper lever
- Changes one rate and leaves the cost base alone
- Requires naming which transition fell and against what
- Usually implicates work another function owns
- Produces a finding that survives into the next quarter
- Compounds, because the rate applies to all future volume
Where a funnel cannot see the leak at all
A funnel describes the companies that entered it. It is structurally silent about the ones that never did, which means it cannot detect a segment you are not contacting, a competitor winning before you arrive, or a price that removes you from the shortlist before a conversation happens.
That blindness is the reason a funnel review should be paired with a look at coverage. A motion can hold every rate steady while contacting a shrinking share of the market it needs, and every chart will read as healthy. Where the business sells a monthly commitment, the same blindness is worse, because the funnel has to refill what churn removes before it grows anything, and that requirement never appears in a conversion rate.
One constraint we run shapes the top seam specifically. We send one message per campaign, with no bumps and no thread replies. That removes the cheapest available lift at the first seam, and it puts the weight on the list and the premise instead, which is where the diagnosis usually ends up pointing anyway.
The short version
A leak is a stage-to-stage rate that fell, measured against your own history, over a stated population. Anything else called a leak is either a definition change, a stage with no mechanism, or a disqualification doing its job.
Check the seams in order and use the evidence each one actually produces. Delivery before list before premise at the first seam. Response time and booking friction at the second. Written acceptance criteria at the third. The structure of the first conversation at the fourth. A quantified problem and a mapped paperwork route at the fifth.
Print the denominator beside every rate, count the people who left rather than the survivors, and read several periods rather than one. Then fix the seam nearest the top that is genuinely broken, because a rate high in the funnel carries more volume than any improvement below it.
If the honest finding is that the first seam is thin because there are not enough of the right companies being contacted at all, that is the half we run. See what one campaign against your own segment produces.
Frequently asked questions.
Frequently asked questions- What is a leaky sales funnel?
- A leaky sales funnel is one where a specific stage-to-stage conversion rate has fallen, against your own history or against a rate the plan assumed. Every funnel loses most of the people who enter it, so a low overall conversion rate proves nothing. The leak is the one transition that now lets through fewer people than it used to, over a population you can state.
- How do you fix a leaky funnel?
- Locate the seam first. Write every stage transition as a count out of a count for two periods and find the one that fell. Then check that seam's own causes: delivery, list and premise at the top, response speed and booking friction next, written acceptance criteria, the structure of the first conversation, and a quantified problem with a mapped paperwork route at the close.
- Why is a low reply rate not a copy problem?
- Three separate causes produce an identical symptom. The message may not have arrived, the list may be wrong, or the premise may be generic. Deliverability faults and bad targeting both show up as a low reply rate and neither is fixed by rewriting the message. Check placement and address verification first, then the segment, then the wording.
- Should I fix the seam nearest the top or the worst-looking one?
- Usually the one nearest the top that is genuinely broken. Rates compound, so an improvement high in the funnel carries through every stage beneath it, while an improvement at the bottom applies only to what survived everything above. A worse-looking percentage low in the funnel often moves fewer deals than a small gain at the first seam.
About the author.

B2B cold email experts helping companies generate qualified leads through done-for-you outreach campaigns.
RevenueFlow Team
Explore more.
Ready to scale your outreach?
We build GTM engines that book real meetings. See the receipts.
Related articles.
Sales Cycle Length Benchmarks: What Each Figure Counts
The published B2B sales cycle benchmarks, sorted by what each page says it counted. The same number means two different things in two of them.
Win Rate Benchmarks: Which Figures State a Population
A catalogue of the published average sales win rates, sorted by whether the page names the population behind its own number. Most do not.
Sales Enablement Charters: What the Published Ones Ask For
Six publishers set out what a sales enablement charter should contain. Five describe a document nobody can check, and one writes a definition with inspection in it.
Sales Kickoff Agendas: Five Published, Session by Session
Five publishers print a sales kickoff agenda. They agree on four blocks and disagree on session length, rehearsal and where the agenda comes from.
Sales Comp Plan Design: What the Publishers Prescribe
Four publishers set out how to design a sales compensation plan. Here are their procedures, their components, and which of their ratios carry a population.
Sales Prospecting for Utilities: Read the Filings First
Prospecting utilities from the proceedings that announce their spend: rate cases, resource plans and procurement decisions, who owns each, and the supplier gate.