Optimising a Sales Process: Measure First, Then Delete
The step that feels worst is rarely the one costing most. Three measurements that find the real bottleneck, four causes worth checking, and why deleting beats adding.
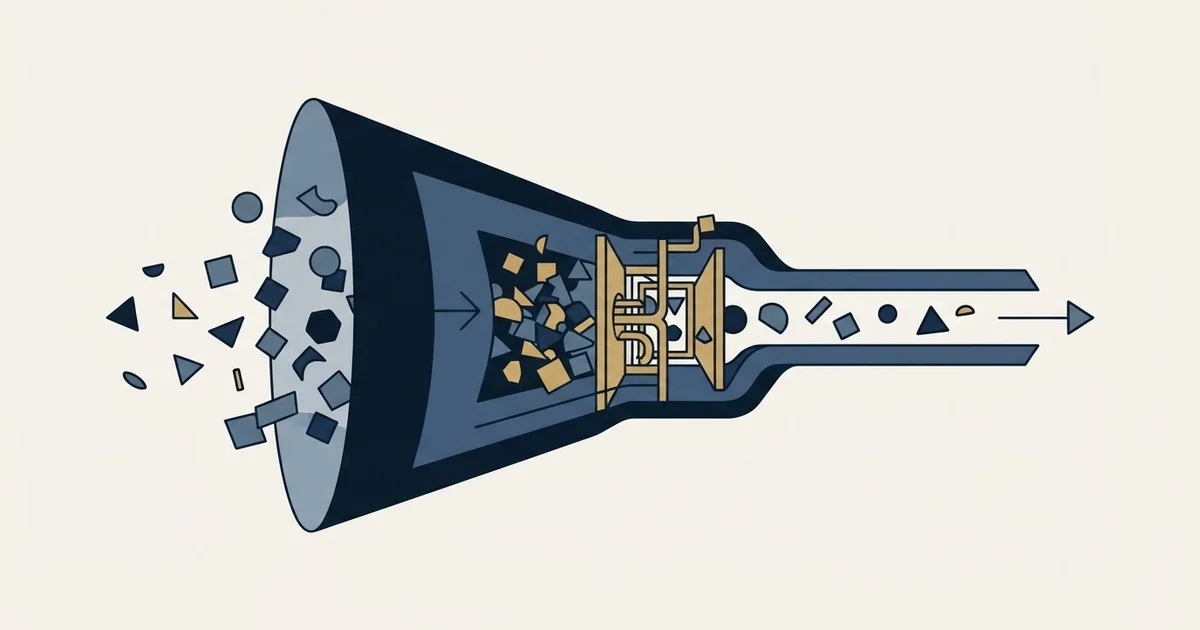
Optimising a sales process starts with three measurements: conversion between adjacent steps, time in step compared against time in step for deals that converted, and loss reason by step. Work the largest absolute loss, and check whether the step before the failure actually completed.
Key takeaways
- Late losses are usually early omissions, so a proposal-stage failure is more often a discovery problem than a pricing one.
- A step that has never rejected a deal in two quarters is not a filter, and deleting steps generally yields more than improving them.
- Change one thing per period at a period boundary, because four simultaneous changes produce a number that moved and no information about why.
- Neither low volume nor an absent forcing function responds to process work, and both are routinely misdiagnosed as bottlenecks.
Reviewed and updated August 28, 2026
A sales process gets optimised in one of two ways. Either somebody measures where deals stop and removes the cause, or somebody adds a step. The second is far more common, because adding a step is visible, cheap and feels like management, and because the cost of it does not arrive until the following quarter in the form of a cycle that has quietly grown by three weeks.
This page is about the first way. It assumes a process already exists and is written down, with steps phrased as things the buyer did rather than things the seller performed, because you cannot optimise a thing nobody can state the same way twice. Where the steps are really CRM stages, the stage design question has to be settled first.
Once the steps are written down consistently, what makes a process repeatable becomes the real test, judged by how quickly newly hired sellers ramp rather than by team averages.
The fastest way to improve your sales process is to measure where deals stop and remove the cause, which is what the rest of this page works through.
This is what a sales process audit should actually produce: a measured baseline per stage, a list of steps that have never rejected a deal, and a decision about which of them to delete.
Measure before touching anything
The instinct is to start with the step that feels worst. The step that feels worst is almost never the one costing the most, because feeling is generated by recency and by the deals people argue about, and neither correlates with volume.
Three measurements settle it, and all three come out of any CRM that has been in honest use for two quarters.
A separate but related limitation is that these measurements only mean something if the CRM records themselves are trustworthy, which is the concern addressed in making pipeline records reflect reality.
Conversion between adjacent steps. For each pair, the share of deals entering step N that reach step N plus one. This finds the leak.
Time in step. The median age of deals sitting in each step, and the median age of deals that eventually converted out of it. This finds the drag, and the two figures are different: a step where converted deals took nine days and current deals average forty is a step full of deals that are not going to convert.
Loss reason by step. Where deals die, paired with why. This is the one most teams cannot produce, because the reason field is free text, and free text cannot be counted.
Median 4 days in step
Median 11 days. Converted deals took 8
Median 19 days. Converted deals took 12
Median 26 days. The drag sits here
Median 21 days in contracting
In that invented example the largest single drop is at the first transition and the largest drag is at the fourth, and the two want completely different interventions. Teams that skip the measurement usually work on the one that generates the loudest meetings, which is the fourth, and leave the first alone because a low discovery-completion rate looks like normal attrition.
The four causes worth checking first
Almost every real bottleneck reduces to one of four things, and they are distinguishable by evidence rather than by argument.
The step before it was not really complete. This is the most common and the least diagnosed. A high loss rate at proposal is usually a discovery problem: nobody established what the problem costs, so the price has nothing to be measured against. Check it by reading the records of ten deals lost at the late step and looking for the evidence the earlier step was supposed to produce. If it is missing in eight of ten, the bottleneck is not where the deals died.
The entry criteria are too loose. If the first transition leaks badly, the population entering the process is wrong rather than the process. This shows up as a high volume of deals accepted and a low share reaching a second meeting, and the fix is upstream in who gets contacted and on what basis rather than in any step.
A required person is missing. Deals that stall at one step for multiples of their normal age frequently share a shape: the person who can act was never in the room. This is visible in the record if anybody wrote down who is involved, and invisible if they did not.
The step is waiting on us. Some drag is internal: a proposal that takes six days to produce, a security questionnaire nobody owns, a pricing approval that needs two signatures. This is the cheapest category to fix and the least glamorous, and it is worth checking first precisely because nobody looks there.
Removing steps is the highest-yield move

Optimisation is usually presented as improvement of each step. In practice the largest single gain in most B2B processes comes from deleting steps that produce no decision.
A step earns its place if the answer to it changes what happens next. A demo that always precedes a proposal, regardless of what the demo shows, is not a decision point; it is a ritual with a calendar invite attached. A second internal review that has never once reversed a recommendation is pure cycle time.
The test is mechanical. For each step, ask how many deals in the past two quarters exited it in the negative direction. If the answer is none, the step is not a filter, and it is either a value-delivery step that should be justified on that basis or an artefact that can be removed.
- Yes: Deals have exited it in the losing direction in the last two quarters
- Yes: Its completion depends on something the buyer did
- Yes: Somebody other than the deal owner could verify it from the record
- Yes: It has a typical duration drawn from your own closed deals
- No: It exists mainly to give a manager visibility
- No: Its output is a document nobody downstream reads
- Depends: It was added after one memorable lost deal
The last item deserves the maybe rather than the no. Processes accumulate scar tissue from individual disasters, and some of that scar tissue is load-bearing. The question is whether the failure it prevents has recurred often enough to be a pattern, and that is answerable from the loss-reason data if anyone has been collecting it.
Ordering changes so you can tell whether they worked
An optimisation programme that changes four things at once produces a number that moved and no information about why.
Change one thing per period, at a period boundary, and hold everything else. This is slower than the alternative and it is the only version that produces knowledge. Two exceptions are worth naming: internal-drag fixes that touch nobody's judgement can be batched safely, and a change to entry criteria has to be evaluated on deals that entered after it, which means the read is one full cycle away regardless of what else you do.
The measurement trap is the same one that catches every metrics programme. Tightening entry criteria raises win rate and lowers volume, so a dashboard showing both will look like a team that got better at closing and worse at generating demand, when the only thing that happened was an edit to a definition. Date every definition change and put it on the same chart as the metric it moved.
What optimisation cannot fix

Two constraints are routinely mistaken for process problems, and neither responds to process work.
The first is volume. A process that converts well and receives four opportunities a month has a supply problem, and every hour spent tuning the steps is an hour not spent on the constraint. The tell is that conversion rates are healthy at every transition and the absolute numbers are small.
The second is the market. Where a large share of losses are to no decision rather than to a competitor, the problem is usually that the buyer has no forcing function, which is a targeting and timing question rather than a step question. A process cannot manufacture urgency, and attempts to do so through added pressure show up as a worse close rate a quarter later.
Both of those point at the same place. What a stage-by-stage view can and cannot tell you covers the timing half, and where the constraint is genuinely supply, what a qualified meeting has to mean is the definition worth settling before buying any.
Where we differ from standard practice
Much of the advice in this area reflects how outbound is commonly run, and since this page sits on our site the divergence is worth stating.
A common optimisation recommendation for the top of the process is to increase the number of touches per prospect: more messages, spread over more weeks, landing in the same thread. We do not do that. We run one message per campaign, with no bumps and no thread replies, and where an audience does not respond we build a separate campaign with a genuinely different premise rather than a reminder. The reasoning is mechanical: a follow-up reaches the population that already saw the message and chose not to answer, which is the population most likely to complain, and the reputation cost lands on the sending domain across everything else running on it. our write-up on why we stopped using follow-ups sets out the whole trade. The cost we accept is fewer contacts per prospect, which moves the optimisation work into targeting and into the one message.
Meetings we are paid for are qualified against criteria agreed in writing before launch, which is the same instrument this page recommends applying to every step: a standard written before the result is known, so nobody is arguing about the ruler after reading the number. The full argument, including what it costs us, is in why we stopped using follow-ups.
The short version
Optimising a sales process starts with three measurements: conversion between adjacent steps, time in step against time in step for deals that converted, and loss reason by step. Work on the largest absolute loss rather than the loudest one, and check whether the step before the failure actually completed, because late losses are usually early omissions.
Delete before you add. A step that has never rejected a deal is not a filter. Change one thing per period at a period boundary, date every definition change on the chart it moves, and accept that neither volume constraints nor an absent forcing function will respond to process work at all.
Where the constraint turns out to be the supply of qualified conversations, that is the half we run: see what a first campaign produces.
Frequently asked questions.
Frequently asked questions- Where do I start when optimising a sales process?
- With measurement, not intuition. Pull conversion between each pair of adjacent steps, the median time deals spend in each step, and the median time for deals that eventually converted out of it. The gap between those last two figures is the clearest signal that a step is holding deals which will never progress.
- Why do late-stage losses usually point earlier?
- Because a step can be marked complete without producing the evidence it existed to produce. A price objection at proposal normally means the cost of the problem was never established during discovery. Read ten records of deals lost late and look for that missing evidence before changing anything at the step where they died.
- Should I add a step to catch a problem we hit?
- Only if the failure is a pattern rather than one memorable deal. Processes accumulate scar tissue from individual disasters, and each added step costs cycle time on every deal forever. Check the loss-reason distribution first; if the failure appears once, the honest fix is coaching rather than a permanent gate.
- How do I tell whether a change worked?
- Change one thing, at a period boundary, and hold everything else. Date the change on the same chart as the metric it moved, because tightening entry criteria raises win rate while lowering volume and a dashboard showing both looks like two unrelated trends. Entry-criteria changes cannot be read for a full cycle.
About the author.

Ben Carden is CRO at RevenueFlow, which builds and operates outbound revenue engines for B2B companies. Previously at Gartner Enterprise. Studied at London School of Economics.
Ben Carden · CRO
Connect on LinkedIn →Explore more.
Ready to scale your outreach?
We build GTM engines that book real meetings. See the receipts.
Related articles.
SFDC Sales Process: The Picklist Decides What a Stage Is
In Salesforce a sales process is a named subset of the Opportunity Stage picklist. What it enforces, what it silently leaves behind, and the order to build it in.
The Seven-Step Sales Process: What Each Step Assumes
Prospecting through follow-up, walked one box at a time. Each of the seven steps carries an assumption about the buyer, and most of them have quietly stopped holding.
The Five-Step Sales Process: What You Stop Checking
Cutting a process to five steps is a decision about which checks you drop. Which deals the short version fits, and the two loss patterns that say it does not.
Sales Process Mapping: Draw What Happens, Not What Should
Every company has two processes: the one people describe and the one the records show. Mapping is worth the days it takes when it captures the gap between them.
A Repeatable Sales Process: What Transfers
Repeatable means somebody else can run it and get a similar result. What a written process carries, what it quietly leaves behind, and how to measure it at ramp.
Drawing a Sales Process Flowchart That Contains the Exits
A whiteboard row of boxes draws the happy path, which is the part nobody needed help with. Four shapes, swimlanes, exit states, and what a diagram cannot show.