Sales Process Mapping: Draw What Happens, Not What Should
Every company has two processes: the one people describe and the one the records show. Mapping is worth the days it takes when it captures the gap between them.

Sales process mapping documents how deals actually move, derived from closed deal records rather than from what a team remembers being taught. The map earns its keep by exposing the gap between the remembered process and the recorded one, which is where the fixable problems are.
Key takeaways
- Every company already has two processes, the remembered one and the recorded one, and the difference between them is the finding the mapping exercise exists to produce.
- Build the current state from twenty wins and twenty losses with dated events, then interview about specific deals, because asking somebody to describe the process returns the trained answer.
- A usable map carries an entry criterion, an owner per box, every exit including disqualified and no decision, and a median duration taken from your own closed deals.
- Map the current state before designing the future state, and keep outbound as a separate map meeting the sales process at one labelled acceptance test.
Reviewed and updated August 28, 2026
The first version of a sales process map is almost always a description of how the company would like deals to go. Somebody gathers the team, the boxes go up in the order everyone remembers being taught, and the result is accurate about intentions and silent about what actually happens to the deals that do not behave. It gets signed off because nobody in the room disagrees with it, which is the problem rather than the evidence of success.
Sales process mapping is worth the days it takes when the map is built from records rather than from recollection, because the value of the exercise is the gap it exposes between the two. This page is about how to derive that map, where the evidence comes from, and which parts of it people consistently leave out.
Two maps exist before you start
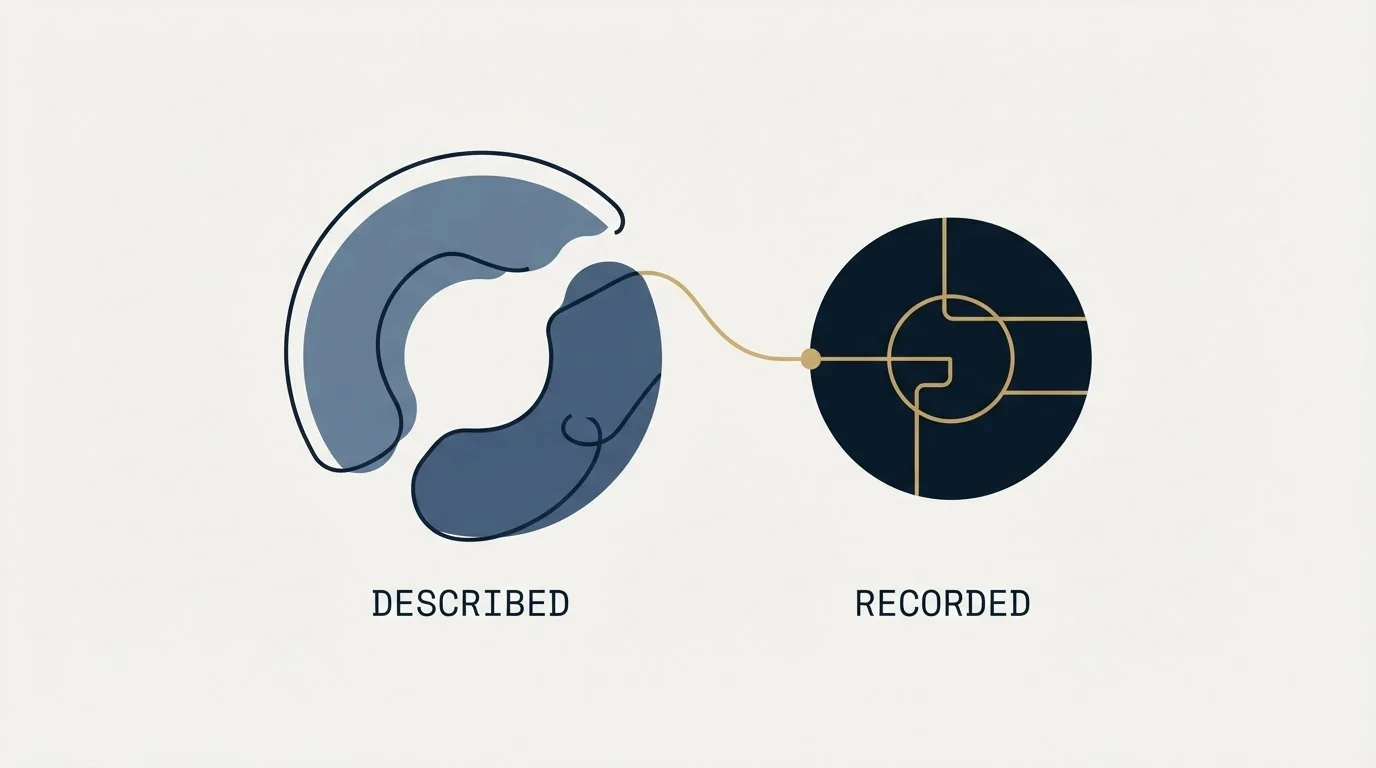
Every company already has two versions of its process. One lives in what people say when asked, and one lives in the records of what happened to the last hundred deals. They are never the same, and the difference is the finding.
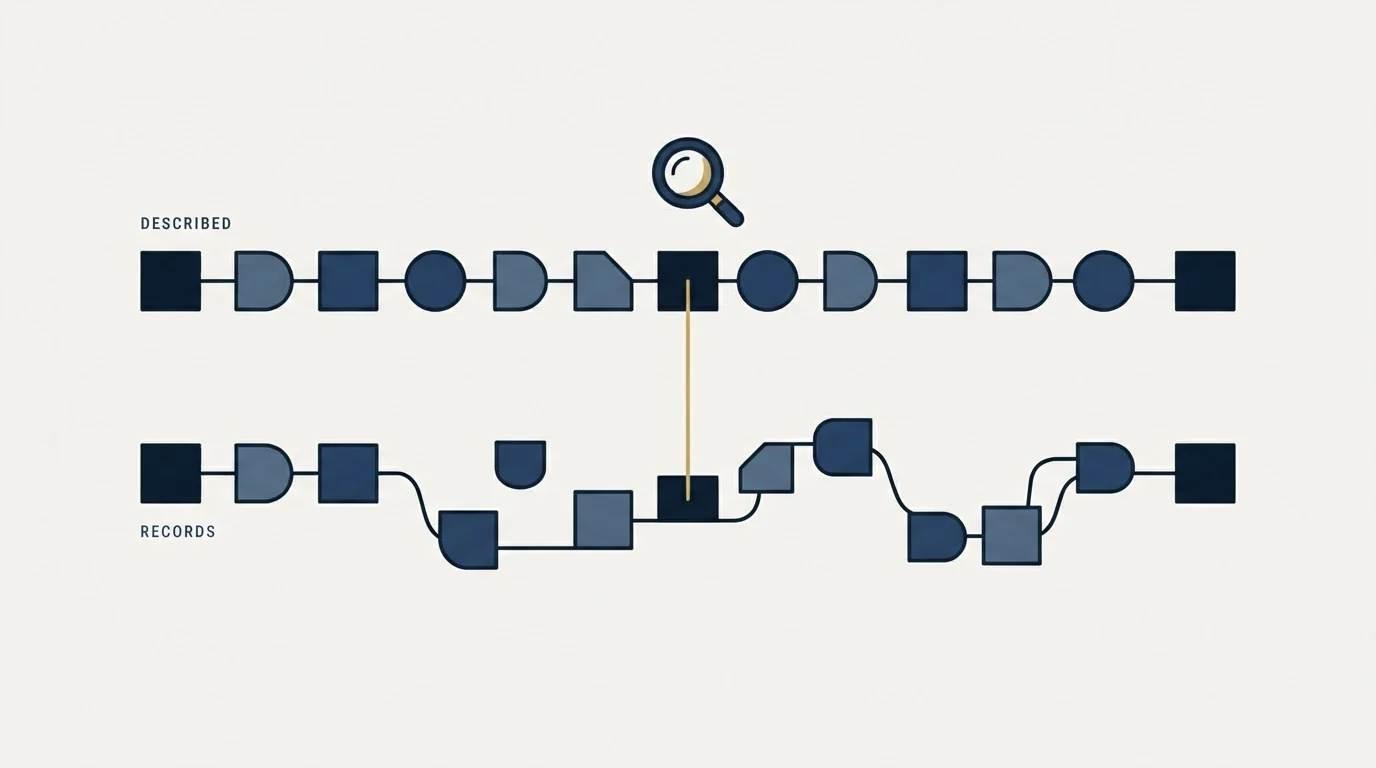
The remembered version is smooth, linear and ordered by how the work is taught. The recorded version has deals that skipped a step and closed anyway, deals that went backwards, deals that sat in one place for eleven weeks, and a set of exits nobody mentions because they are not interesting to talk about. A map that only captures the first version documents a preference. A map that captures both is a diagnosis.
The practical consequence is that the exercise starts in the CRM rather than in a workshop. Pull the last twenty closed-won deals and the last twenty closed-lost ones, and write down the observable events in order for each, taking the dates from the record rather than from anyone's memory of them. That is unglamorous and it is where every useful finding in this exercise comes from.
- Steps arrive in the order they are taught
- Every deal follows one path
- Exits are won and lost
- Durations are estimates offered in the room
- Handovers are assumed to work
- Nobody is contradicted
- Steps appear in the order they actually occurred
- Several paths are visible, including the ones that skip a box
- Exits include disqualified, stalled and no decision
- Durations are medians from your own closed deals
- Handovers show up as gaps between dated events
- The map disagrees with somebody in the first hour
What the map has to contain
A sales process map that stops at boxes and arrows is a picture. Four pieces of information turn it into something a team can operate from, and three of them are usually missing on the first pass.
An entry point with a criterion. Where the process starts is a decision rather than a fact, and it needs to be written down. In most companies the process begins when somebody accepts a meeting or an enquiry as real, against criteria that either exist in writing or do not exist at all. The boundary two teams negotiate covers what that acceptance is actually asserting, and MQL versus SQL covers the handover one rung earlier.
Teams that map entry criteria for a generic pipeline will find managed services qualification approach useful, since assessing the estate rather than the enthusiasm defines the real starting point for that particular sale.
An owner for every box. Not a role in the abstract, the person who performs the step. Ownership is what makes the arrows between boxes visible as handovers, and handovers are where context is lost by default rather than by accident.
What the receiving party needs at each handover. An arrow between two owners is a transfer, and it wants two things written beside it: what the person picking the deal up needs in order to start, and what happens when it is not there. A meeting passed on with a company name and a calendar invite forces the buyer to repeat a conversation they have already had, which spends the goodwill the first conversation produced.
Every exit, named. Won and lost always get drawn. Disqualified and no decision usually do not, and they are the two that carry the most information: disqualified says the targeting was wrong, no decision says the buyer had no forcing function. Merging them into lost destroys the only signal that separates a targeting problem from a selling one.
A typical duration on each box. Take the median from your own closed deals rather than an estimate from the room. A box with no expected duration cannot produce a stalled-deal signal, so stalls are noticed only when somebody happens to look.
The notation question, which shapes to use and how to lay the diagram out in lanes, is a separate and much smaller problem than deciding what goes in the boxes. Teams routinely spend the workshop on the drawing and leave with a tidy picture of the remembered version.
The exercise, in the order that works
- Step 1Derive the current state from records
Twenty closed-won and twenty closed-lost deals, with the observable events and their dates written out in order
- Step 2Interview for the parts records cannot show
Ask who was involved, what they were waiting for, and which steps they skipped. Ask about specific deals rather than about the process
- Step 3Draw the current state, including the ugly paths
Every path that appeared in the forty deals gets drawn, including the ones nobody wants to admit to
- Step 4Mark the deltas
Where the recorded version and the remembered version disagree, annotate the map rather than resolving the disagreement silently
- Step 5Only then design the future state
A second map, dated, with each change traceable to something the first map showed
The interview step is worth doing carefully, because the standard question produces the standard answer. Asking somebody to describe the sales process gets the version they were taught. Asking what happened on a specific named deal, in order, gets the version that occurred, and the difference between five of those accounts and the trained answer is usually the whole finding.
Current state before future state is the sequencing rule that saves the exercise. A team that maps the aspiration first has nothing to compare it against, and the map becomes a statement of intent that quietly replaces the description it was supposed to produce.
Where mapping projects go wrong
The map is drawn for a decision nobody has to make. Mapping is a means. If the exercise is not attached to a specific question, which step is losing deals, where the handover fails, what a new starter has to learn, it produces a diagram and no decision.
The exceptions are drawn as though they were rare. Every process has a main path and several exception paths, and teams routinely discover that the exception carries a third of the volume. Annotate the arrows with counts from the forty deals if you want the map to inform priorities rather than just describe options.
Outbound gets bolted onto the front. Prospecting has its own flow, its own states and its own exits, and its volumes are orders of magnitude larger than the sales process it feeds. Drawing contacted and replied as peers of proposal and contracting produces a map whose left end describes fifty thousand records and whose right end describes eleven. Keep them as two maps meeting at one labelled acceptance test. The outbound playbook covers what the left-hand map contains.
The finished map contradicts the CRM. When the two disagree, people follow the CRM and quote the map, which is worse than having no map. The stage design question is the reconciliation, and it has its own rules: a process step earns a stage only when the forecast should change as a result of it. Pipeline stages that earn their place is the instrument for that decision.
A separate limitation worth understanding is how Salesforce itself defines a process, covered in what the Salesforce stage picklist controls, which governs only which stage values are offered, not their meaning.
- Yes: Every box names an event a person outside the deal could verify
- Yes: The entry criterion is written down and dated
- Yes: Disqualified and no decision appear as named exits
- Yes: Each box carries a median duration from your own closed deals
- Yes: At least one path on the map is one nobody enjoyed admitting to
- No: Every step is one somebody described from memory
- No: The only exits are won and lost
Keeping the map worth the effort
A sales process map is a measuring instrument as well as a description, so changing it breaks comparability with the period before it. Change it at a period boundary, map old steps to new one way only so historical conversion stays reconstructible, and re-check open deals against the new definitions by hand. Expect the pipeline to shrink when you do, because the re-check is where deals that had quietly stopped qualifying get found.
Date the map and name its owner on the map itself. A reader who cannot tell whether they are looking at the current process or last year's will assume the second and stop consulting it, and an unconsulted map is indistinguishable from no map at all.
Where we differ from standard practice
Much of the advice on mapping the front of a process reflects how outbound is commonly run, and since this page sits on our site it is worth naming the difference.
The templates almost always draw the first section as a loop: contact, wait a few days, contact again, wait again, exit after several attempts. Our map of that section has one send per campaign, no bumps and no thread replies, and a non-responding audience becomes a separate campaign with a genuinely different premise rather than another pass through the same box. The reasoning is mechanical: a repeat message reaches the people who already saw the first one and chose not to answer, which is the population most likely to complain, and the reputation cost of that lands on the sending domain across everything else it sends. The cost we accept is fewer contacts per prospect. The full argument, including what it costs us, is in why we stopped using follow-ups.
The short version
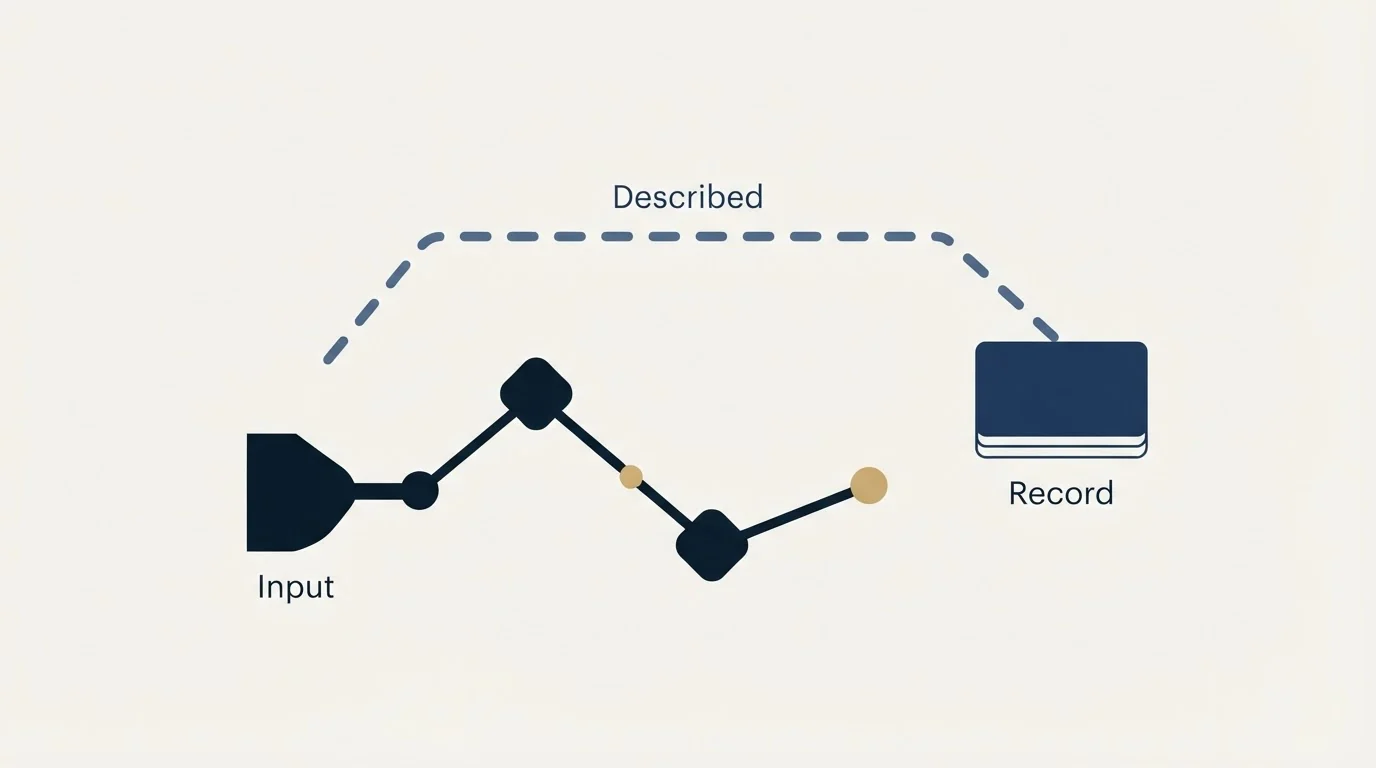
Sales process mapping is worth doing when the map is derived from closed deals rather than from what people remember being taught, because the gap between those two versions is the finding the exercise exists to produce.
Build the current state from twenty wins and twenty losses with dated events, interview about specific deals rather than about the process, draw every path including the ones nobody likes, and only then design the future state as a second dated map. Give each box an owner and a median duration, name every exit including disqualified and no decision, and write the entry criterion down.
A sales process map that agrees with everybody in the room on the first afternoon has almost certainly documented the aspiration. The one worth having disagrees with somebody by lunchtime.
If the map turns out to be sound and the left-hand end is empty, the constraint is the supply of conversations rather than the process: see what a first campaign produces.
Frequently asked questions.
Frequently asked questions- What is sales process mapping?
- It is the exercise of documenting how deals actually move from first contact to a closed outcome, including the paths that skip steps and the ways deals leave without buying. The output is a sales process map that names each step, who owns it, what completes it and roughly how long it takes.
- Where does the evidence for the map come from?
- From closed deals rather than from a workshop. Take the last twenty wins and twenty losses, list the observable events with the dates the records carry, and use interviews only for the parts the records cannot show, such as who was involved and what people were waiting for.
- How is a process map different from a pipeline?
- The map is the sequence of events, and the pipeline is where the record sits while those events happen. A process usually has more steps than the pipeline has stages, because several things occur inside one stage, and a step earns a stage only when the forecast should change as a result of it.
- How often should the map be redrawn?
- Rarely, and at a period boundary. The map is a measuring instrument as well as a description, so every change breaks comparability with the period before it. Map old steps to new one way only, re-check open deals by hand, and expect the pipeline to shrink when you do.
About the author.

Ben Carden is CRO at RevenueFlow, which builds and operates outbound revenue engines for B2B companies. Previously at Gartner Enterprise. Studied at London School of Economics.
Ben Carden · CRO
Connect on LinkedIn →Explore more.
Ready to scale your outreach?
We build GTM engines that book real meetings. See the receipts.
Related articles.
Drawing a Sales Process Flowchart That Contains the Exits
A whiteboard row of boxes draws the happy path, which is the part nobody needed help with. Four shapes, swimlanes, exit states, and what a diagram cannot show.
The Seven-Step Sales Process: What Each Step Assumes
Prospecting through follow-up, walked one box at a time. Each of the seven steps carries an assumption about the buyer, and most of them have quietly stopped holding.
SFDC Sales Process: The Picklist Decides What a Stage Is
In Salesforce a sales process is a named subset of the Opportunity Stage picklist. What it enforces, what it silently leaves behind, and the order to build it in.
Optimising a Sales Process: Measure First, Then Delete
The step that feels worst is rarely the one costing most. Three measurements that find the real bottleneck, four causes worth checking, and why deleting beats adding.
A Repeatable Sales Process: What Transfers
Repeatable means somebody else can run it and get a similar result. What a written process carries, what it quietly leaves behind, and how to measure it at ramp.
Sales Kickoff Meeting: The Decisions It Has to Leave With
A kickoff is the one moment a whole sales organisation can change at once. The four decisions it has to publish, and the week-six check that tests them.