A/B Testing a Landing Page When You Do Not Have the Traffic
Detecting a small improvement on a typical landing page takes tens of thousands of visitors. Most B2B pages get hundreds a month. Here is what to do instead.
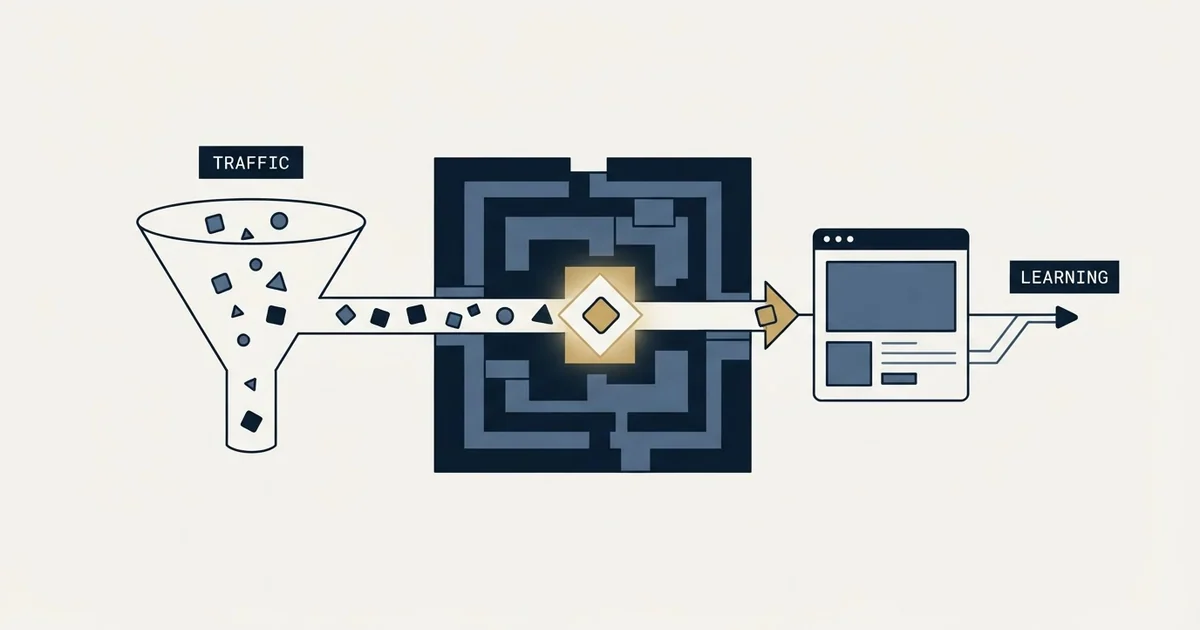
Landing page A/B testing needs more traffic than most B2B pages get. From a 6.6% baseline at 95% confidence and 80% power, detecting a 20% improvement takes about 12,100 visitors across both variants, and a doubling about 640. Below that volume, change the offer on judgment and judge it downstream.
Key takeaways
- Compute the sample before testing: from a 6.6% baseline, a 10% improvement needs about 46,500 visitors in total, a 20% one about 12,100 and a doubling about 640.
- A page receiving 200 visitors a month needs about five years to detect a 20% improvement, so an element-level test there will never conclude honestly.
- At low volume, test large offer changes, ship them to everyone, compare periods on counts with the source mix held steady, and judge on qualified conversations.
- If reaching the sample would take more than a year, the page is not the constraint: fix the traffic upstream, where campaign-level tests have the volume.
Reviewed and updated September 19, 2026
Landing page A/B testing splits a page's traffic between two versions and waits until enough visitors have converted to tell them apart. On a typical 6.6% baseline, detecting a 20% improvement takes about 12,100 visitors across both versions, which most B2B landing pages never receive. Below is the arithmetic, and the process that replaces testing when the traffic is not there.
A demand-gen team runs an A/B test on the landing page behind their outbound campaigns. Three weeks in, variant B has converted 8 of its 91 visitors against the control's 5 of 88, figures invented here to show the shape, the testing tool shows the bar filling up, and they ship B. The next quarter's numbers look exactly like the last one's. Nobody ever finds out why, because the test that produced the decision had ninety-one visitors in one arm and eighty-eight in the other, and a difference that size on a base that small is what random assignment does on its own.
Almost every guide to landing page A/B testing is written for a page that receives thousands of visitors a week. The advice in them is sound for that page. Applied to a B2B page fed by outbound, paid search on a niche term, or a modest content programme, it produces confident decisions from noise, and the confidence is the expensive part.
The first question is not which element to test. It is whether the page can be tested at all, and that question has an arithmetic answer available before any traffic is spent.
Landing Page A/B Testing: The Arithmetic That Decides It
Two numbers settle whether a test is possible: the conversion rate the page starts from, and how large a change would have to be before you would act on it.
Unbounce's own page on high-converting landing pages states that "the average conversion rate for a landing page is 6.6%" (unbounce.com, high-converting landing pages, fetched 29 August 2026). Cross-industry averages are a weak guide to any specific page, and this one is useful only as an order of magnitude to work from, so take it as a starting point rather than a target. What those published averages actually counted, and why none of them transfers cleanly onto outbound traffic, is unpicked in average landing page conversion rate.
Working from a 6.6% baseline, at the conventional bar of 95% confidence and 80% power, the illustrative arithmetic below shows how steeply the sample each variant needs depends on the size of the change it has to detect. Every figure in it is computed from that baseline rather than measured on any real page, and the shape is what matters rather than the exact numbers.
| Relative improvement you want to detect | Visitors per variant (illustrative) | Visitors in total (illustrative) |
|---|---|---|
| 10% better | about 23,200 | about 46,500 |
| 20% better | about 6,100 | about 12,100 |
| 30% better | about 2,800 | about 5,600 |
| 50% better | about 1,100 | about 2,200 |
| 100% better | about 320 | about 640 |
Read the top row and the bottom row together, because the gap between them is the whole practical point. Detecting the kind of improvement a headline rewrite plausibly produces takes tens of thousands of visitors. Detecting a doubling takes a few hundred. Most of what testing literature recommends sits in the top half of that table, and most B2B landing pages live in the bottom.
What a B2B landing page actually receives
Put a real denominator against those numbers.
A campaign to two thousand people produces some hundreds of opens and some tens of clicks. A content programme on a specialist topic might send a few hundred people to a page in a month. Paid search on a term with genuine commercial intent in a narrow category can be a few dozen clicks a day at a price that makes every one of them count.
Where the hoped for source is organic search, asking one page to rank and to convert produces a compromise that underperforms at both jobs.
Against a 6,100-per-variant requirement, a page receiving two hundred visitors a month needs five years to detect a 20% improvement. Long before then the offer will have changed, the campaign will have changed and the market will have moved, so the test would not have been measuring one thing anyway.
That is not an argument for giving up on improving the page. It is an argument that the instrument most people reach for cannot measure at this scale, and using it anyway produces a number that looks like evidence.
What goes wrong when the test runs anyway
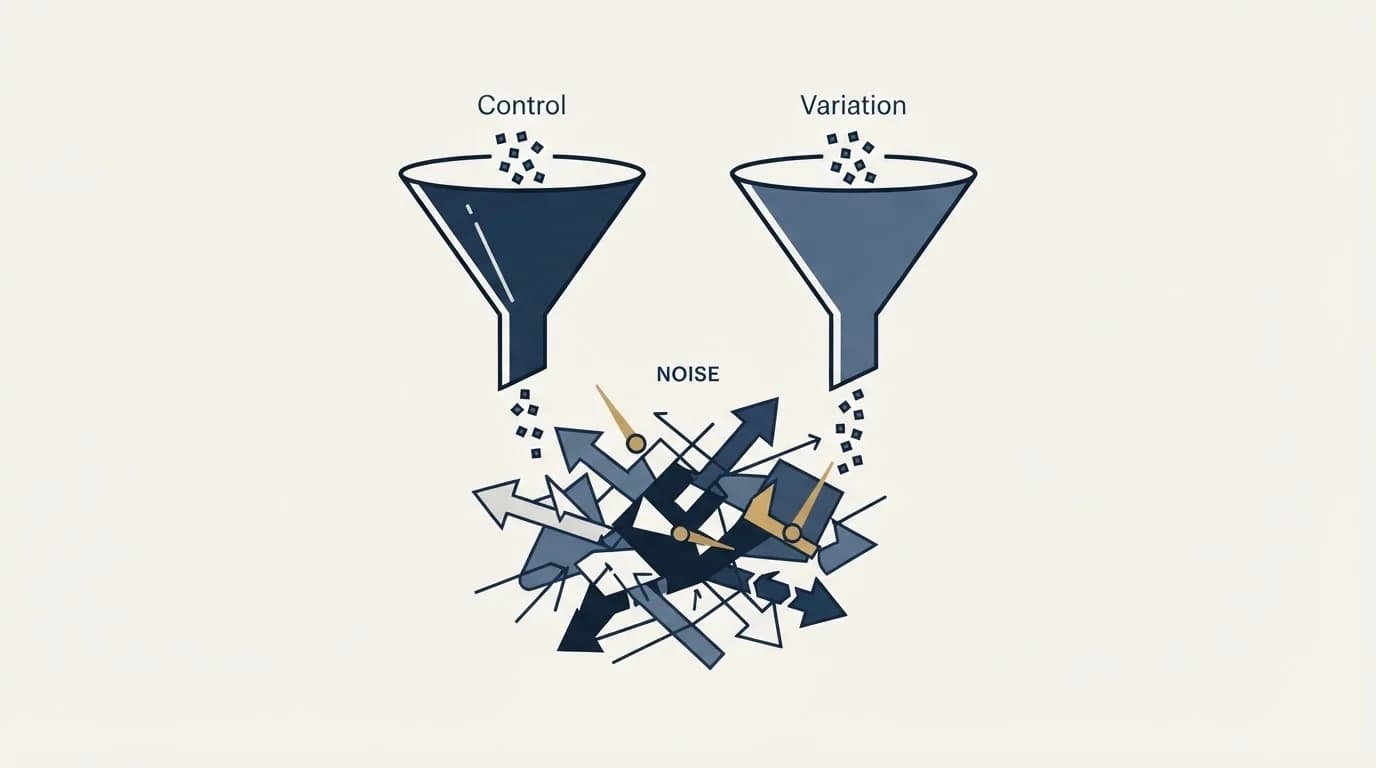
Three failures recur, and they compound.
Stopping when it looks good. A test checked daily and stopped the first time the bar crosses the line is no longer running at the confidence level it was configured for. Repeatedly looking at an accumulating result and stopping at the first favourable moment inflates the false positive rate substantially, and it is the single most common way an underpowered test produces a shipped change. The tool usually encourages it, because watching the number is the product.
Reading a rate over a base too small to support one. A rate computed over a few dozen conversions moves visibly on one outcome, so the percentage tells you almost nothing about the page and a great deal about chance. Quoting the fraction rather than the percentage, eleven of forty rather than twenty-eight percent, does most of the work of a confidence interval at none of the cost, and the general form of the problem is set out in the number that needs both ends named.
Mixing sources into one denominator. A page fed by branded search, a cold campaign and a newsletter shows three different conversion rates for reasons that have nothing to do with the variant under test. If the traffic mix shifts between the two arms, or across the weeks of the test, the difference measured is partly a difference in who arrived. The relevant discipline, segmenting by source before drawing any conclusion, is part of why the headline conversion number misleads on a landing page.
What is genuinely testable at low volume
The table above also says what is possible, and it is more than it first appears.
Large differences are detectable on a few hundred visitors per arm. That rules out button colours, headline word choice and layout tweaks, and it rules in the changes that plausibly move a rate by half or more: removing three fields from a form, replacing a gated PDF with a tool the visitor can use, changing the ask from a demo request to a fifteen-minute call, or removing the page entirely in favour of a direct booking link.
Those are offer decisions rather than design decisions, which is convenient, because they are also the decisions most likely to matter. A page that asks for less and offers more is the change with the largest expected effect on a B2B page, and it is the one that a small sample can actually resolve.
The other genuinely testable thing at low volume is a binary that is not a page test at all: two campaigns pointed at two different destinations, judged on meetings rather than on submissions. That comparison has a denominator counted in people contacted rather than in visitors, which is usually an order of magnitude larger.
Measure the thing that pays, not the thing that moves
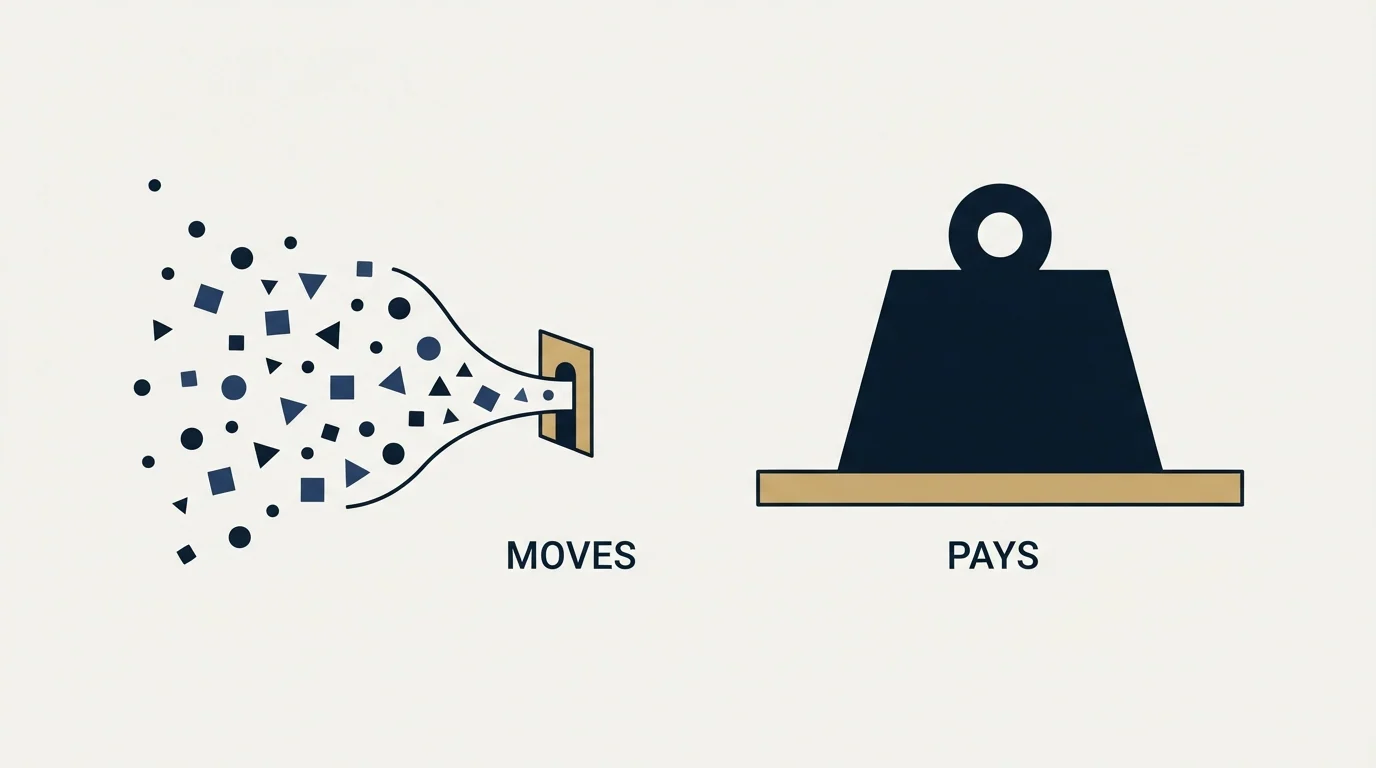
The deeper reason to be relaxed about not testing is that the page metric is the wrong target anyway.
Conversion rate improves when the ask shrinks, and a page that doubles its submissions while halving their quality shows up as a success. On a B2B page the number worth governing is the count of submissions that become qualified conversations, and the cost of producing one. That measure resists the easy optimisations, and it also has a smaller numerator, which means it needs even more traffic to test formally. The honest conclusion is that the page should be changed on judgment and evaluated on the downstream count over a quarter.
Downstream value belongs in that judgement too, and what average deal size actually assumes shows how easily one metric gets computed two ways by accident.
The same team almost certainly does have a surface where testing works, and it is the sending side rather than the page. A campaign contacts thousands of people rather than hundreds, so message-level comparisons reach usable sample sizes in a way page-level comparisons do not. The sample sizes that make that true, by baseline rate and by metric, are tabulated in cold email A/B testing benchmarks. Where a programme sends one message per campaign, as ours does, the unit under test is the whole campaign rather than a step inside a sequence, which makes the comparison cleaner rather than harder.
Worth naming the boundary though. Testing the message and testing the page are different questions, and a message test cannot tell you whether the destination was the constraint. When the reply rate is healthy and the meetings are not appearing, the page is a reasonable suspect; when the reply rate is low, the page is not the problem and no test of it will help.
A decision procedure
Before opening a testing tool, compute the sample the page would need. Take the current conversion rate, decide the smallest improvement worth acting on, and read the table above for the order of magnitude. Then divide by monthly traffic.
Testing tools price that decision too, and Instapage places its A/B testing a tier up, so a plan bought to experiment is not the entry plan.
If the answer is under about two months, run the test properly: fix the sample size in advance, do not look at the result until it is reached, and hold the traffic mix steady across the window.
If the answer is over two months, do not run it. Change the page on judgment, keep the change, and measure the downstream count across the quarter. Keep a log of what was changed and when, so the periods can be compared later.
And if the answer is over a year, the page is not the constraint. A landing page converts demand that already exists and has no mechanism for creating any, so a page starved of traffic is reporting a problem that lives upstream of it. The two motions that supply that traffic, and why they should not share a domain, are separated in email marketing lead generation.
The short version

Landing page A/B testing is a real technique that needs a traffic volume most B2B pages do not have. The arithmetic is checkable in a minute and it decides the question: detecting a small improvement on a 6.6% baseline takes tens of thousands of visitors, which a page receiving a few hundred a month will never accumulate before the offer changes underneath it.
At that scale the honest process is to make large changes on judgment, ship them to everyone, and judge them on qualified conversations over a quarter. Save the formal testing for the surface that has the volume, which is the campaign rather than the page.
If the real question is whether enough of the right people are reaching the page at all, see what a first campaign against your own market produces and read the answer on replies rather than on conversion rate.
The sample-size figures in the table are illustrative arithmetic computed from a 6.6% baseline at 95% confidence and 80% power, presented to show the shape of the requirement. They are invented for illustration rather than measured on any real page, as are the rates and visitor counts in the opening example. The 6.6% baseline itself was read from Unbounce's own page on 29 August 2026, with a dated snapshot retained.
Frequently asked questions.
Frequently asked questions- How much traffic does a landing page A/B test need?
- It depends on the baseline rate and the smallest change worth acting on. From a 6.6% baseline at 95% confidence and 80% power, detecting a 20% improvement takes about 6,100 visitors per variant, 12,100 in total, while a doubling takes about 320 per variant. Divide the total by monthly traffic to see how long the test would run.
- Can you A/B test a low-traffic B2B landing page?
- Only for very large differences. A few hundred visitors per variant can detect a doubling, such as cutting form fields or changing the ask, but never a headline or button tweak. Below that, ship one big change to everyone, compare periods on counts with the traffic mix held steady, and judge the change on qualified conversations.
- Why do landing page A/B tests give false winners?
- Stopping the first time the tool shows a winner inflates false positives, rates computed over a few dozen conversions swing on single outcomes, and a traffic mix that shifts between arms measures who arrived rather than the variant. Fix the sample size in advance, read the result once, and hold sources steady.
- What should I test instead of the landing page?
- The campaign. Outbound contacts thousands of people rather than hundreds of visitors, so message-level and campaign-level comparisons reach usable sample sizes where page tests cannot. Compare two campaigns pointed at two destinations and judge them on meetings. If replies are healthy and meetings are not appearing, the page becomes a reasonable suspect.
About the author.

B2B cold email experts helping companies generate qualified leads through done-for-you outreach campaigns.
RevenueFlow Team
Explore more.
Ready to scale your outreach?
We build GTM engines that book real meetings. See the receipts.
Related articles.
SDR Outsourcing for Business Brokers: The Fee Timing
Whether a success-fee brokerage should rent sales development at all: the fee timing, the texts that limit what an outside person may say about value, and who signs.
SDR Outsourcing for Financial Services: The Third Party
What a bank, broker-dealer, adviser or agency's regulators say about an outside team that speaks for it, the licensed line, and which arrangement survives due diligence.
SDR Outsourcing for Logistics Companies: The Brokerage Line
What an outside sales development team may do in a freight company's name, the calling and email rules it inherits, and which arrangement survives a bid-shaped market.
Appointment Setting for Business Brokers: The Seller Meeting
What a bought meeting with a business owner has to be for a brokerage: the three-part qualification, the confidentiality rules, the licence line and the owner's reasons.
Win Rate Benchmarks: Which Figures State a Population
A catalogue of the published average sales win rates, sorted by whether the page names the population behind its own number. Most do not.
Sales Prospecting for Health Systems: The Public Record
Where health systems are written down in public: the Medicare cost report, the facility list a non-profit system files, and the two gates that follow qualification.