Sales Operations KPIs: Six Numbers That Measure the Machine
Most sales operations dashboards report the sellers' own numbers back to them. Six figures that measure the system, and the companion each one needs to stay honest.

Sales operations key performance indicators measure the system rather than the sellers. Six carry most of the load: forecast accuracy with the direction of the miss, field completeness on segment-critical fields, routing latency, dated definition changes, quota coverage split by tenure, and time to answer a reconciliation question.
Key takeaways
- Win rate, quota attainment and cycle length are sales numbers. An operations function measured only on those is being measured on somebody else's work rather than on its own.
- The strictest filter is single cause: a figure whose movement has five plausible explanations starts an argument, and one whose movement has a single explanation starts a diagnosis.
- Print the input count beside the accepted count beside the flagged count. A rate computed over an already-filtered population reports on survivors and reads green while the batch is worthless.
- Every one of these is gamed by an honest person under pressure, so carry the companion figure: submitted against best case, the dated field list, and time to first human action.
Reviewed and updated September 2, 2026
The sales operations dashboard in most quarterly reviews carries win rate, quota attainment, pipeline coverage and cycle length. Every one of those is a seller's number. The function presenting them owns none of them, and if the quarter went badly there is nothing on the slide that describes anything the operations team did or failed to do.
Sales operations key performance indicators are worth separating from sales KPIs for that reason. The sellers' numbers describe the outcome of a motion. The operations numbers describe the machine that motion runs on: the definitions everyone reports against, the data the segment queries hit, the routing that decides who owns a reply, and the reliability of the forecast the business plans with. A function measured entirely on the first set is measured on other people's work.
Because sales operations KPIs describe the machine rather than the seller, it helps to see where personal selling examples show adaptation in real buyer conversations.
Four tests a candidate KPI has to pass
Before choosing figures, it is worth having a filter, because this function can produce almost any number on request and that is exactly how its dashboard fills up with things nobody uses.
- Yes: The operations team can move it without a seller changing their behaviour
- Yes: It carries a named denominator, printed beside the rate
- Yes: It is computed from the system rather than assembled by hand each period
- Yes: A movement in it has one plausible cause rather than five
- No: Win rate, quota attainment and cycle length, which belong to the sales team
- No: Anything whose definition lives in a conversation rather than a dated document
- Depends: Adoption figures, where the tool was mandated rather than chosen
The single-cause test is the one that removes the most clutter. Pipeline coverage moves when marketing has a good month, when a seller sandbags, when a definition changes and when a large deal is created, so a movement in it starts an argument rather than a diagnosis. Time from reply to owner assigned moves when routing breaks. One of those is an operations KPI.
The six that measure the system
Forecast accuracy, by period and by direction. Submitted against actual, held over enough periods to see a pattern, with the direction of the miss recorded rather than the absolute error. A team that is consistently under by a similar margin can be calibrated. A team that alternates cannot, and the fix is different in each case. This is the closest thing the function has to a headline number, because it is a direct statement about whether the data and the definitions underneath the forecast hold.
Field completeness on the fields the segments depend on. Not the CRM's overall data health score, which is unactionable by construction. The narrow version is the share of records carrying a usable value in the specific fields your segment queries filter on. That number is checkable, it points at a repair, and it is the one that decides whether a campaign reaches the population somebody intended. Data hygiene is the discipline underneath it, and an ICP written tightly enough to query is what makes the field list finite.
Routing latency. Median and worst-case time from a lead or reply arriving to an owner being assigned and notified. It is unambiguous, it is entirely the function's to fix, and it decays silently after any change to ownership rules. Lead routing covers the mechanics that produce the number.
Definition stability. The count of changes made to stage, qualification or attribution definitions in the period, each one dated. A high count is not automatically bad in a company that is still learning its motion. An undated one is always bad, because every historical comparison silently spans a ruler change. What a stage has to require is where those definitions live.
Quota coverage against plan, split by tenure. Assigned quota against the plan number, with the share carried by sellers still inside their ramp interval shown separately. A team at full coverage on paper where a third of the quota sits with people in month two is a capacity problem the coverage figure hides. Ramp time is the interval being subtracted, and quota attainment is what the same population will be judged on later.
Tooling that tracks the same quota carries its own arithmetic trap, since a flat platform fee already covering five users changes the cost per seat as a team grows.
Time to answer a reconciliation question. How long it takes to answer how many opportunities came from outbound last quarter, and whether two people answering it separately produce the same number. It reads as soft and it is the most honest measure of whether the joins between systems actually hold.
- Forecast accuracy and the direction of the miss
- Field completeness on segment-critical fields
- Routing latency, median and worst case
- Definition changes made, each one dated
- Quota coverage split by tenure
- Time to answer a reconciliation question
- Win rate and average deal size
- Quota attainment per seller
- Pipeline created and coverage ratio
- Stage conversion and cycle length
- Meetings held per rep
- Activity volume of any kind
Reporting the right-hand column remains part of the job. The distinction is what happens in the review: a movement in the right-hand column is a question for the sales leader, and a movement in the left-hand column is a question for the person presenting. Which of the right-hand figures deserve a place at all, and what a target for one of them has to be derived from, is the separate question of what a sales KPI is for the selling team, and it is answered on its own terms rather than here.
Sales operations reporting is this same split under a different name, and the answer to what the function should report is both columns with the ownership stated: publish the sellers' numbers because the business needs them, and publish the six above because they are the only ones that describe the reporting function itself.
Every rate needs its denominator printed beside it
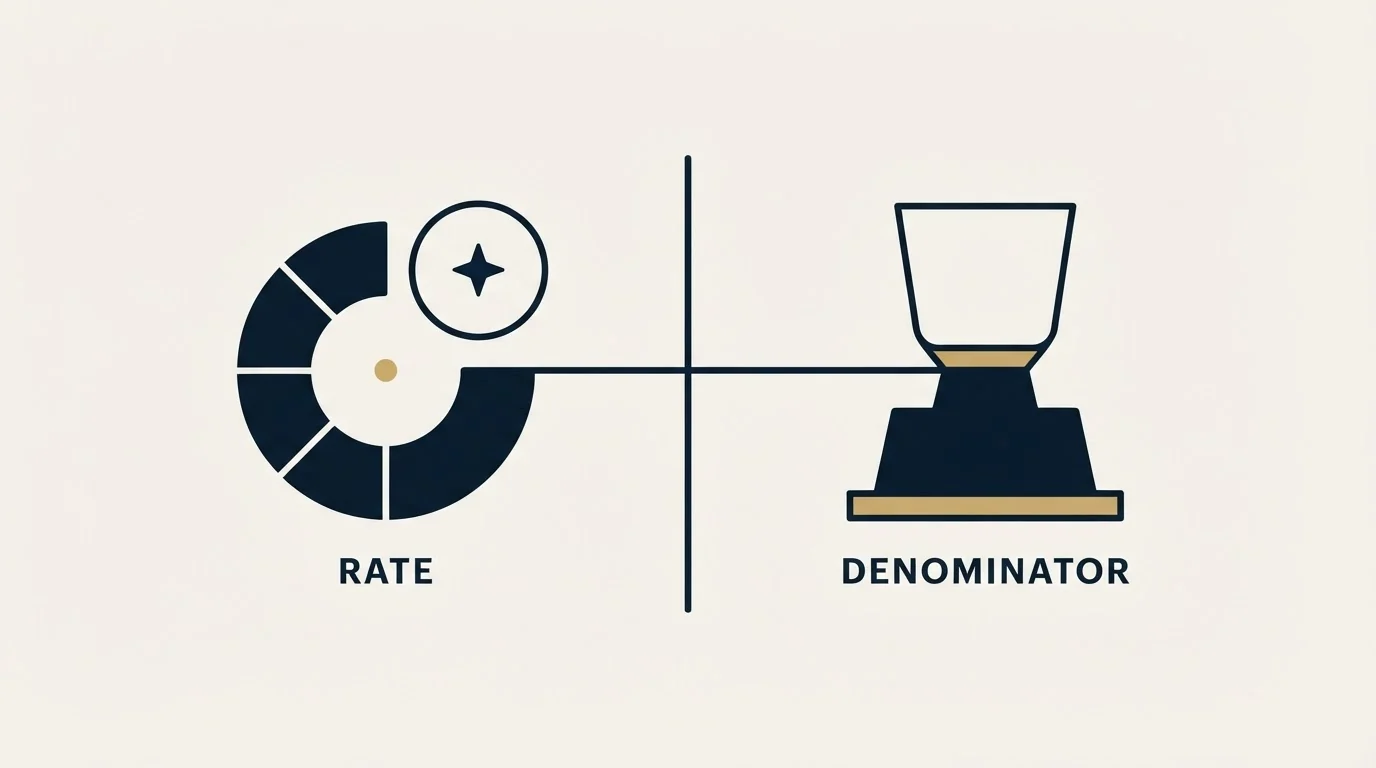
One arithmetic failure shows up in this function's reporting more than any other, and it is invisible in exactly the situation it should catch.
The input count, usually absent from the report
The population the rate was computed over
Reported as a 98 percent pass rate
The figure the report never carried
In that invented example a batch reports a pass rate that would clear any threshold, and the report is describing 120 records out of 4,000. A validation step upstream rejected the rest, and every number downstream is measuring survivors. The habit that prevents it costs nothing: print the input count beside the accepted count beside the flagged count, in the report format itself, and treat any rate whose denominator is zero or unnamed as a failure rather than a pass. A check that cannot see anything has to say so, because a guard that returns fine when it is looking at nothing is not a guard.
That rule generalises to match rates, coverage figures, adoption rates and conversion rates, which between them account for most of what this function publishes.
How each one gets gamed without anybody lying
Forecast accuracy improves by sandbagging. A team that submits low and beats it every period looks calibrated and is not. The companion that catches it is the spread between submitted and best case, held next to accuracy, because a wide and stable gap is a forecasting culture rather than a forecast.
Field completeness improves by narrowing the field list. Whatever is measured gets maintained, so a shrinking definition of critical fields produces a rising completeness figure while segment queries get worse. Date the field list with the same discipline as the stage definitions.
Routing latency improves by assigning to a queue. Auto-assignment to a shared queue stops the clock without a human seeing the record, so the median falls while the buyer's experience is unchanged. Measure to first human action, not to first ownership row.
Adoption improves by mandate. A tool nobody chose can reach full logged-in usage and change nothing. Where adoption is on the dashboard at all, it belongs next to a behaviour figure that would move if the tool were doing its job.
The pattern across all four is the same. Each of these numbers is honest under a companion figure and flattering alone, so the smallest useful dashboard carries pairs rather than a longer list of singles.
The set changes with the size of the company

At the first operations hire, the useful set is small and unglamorous: field completeness on a handful of segment-critical fields, routing latency, and the reconciliation question. Forecast accuracy is not yet meaningful, because a handful of deals per period produces a number that swings on one outcome and teaches nothing.
Once the motion has enough deals per period for a rate to mean something, forecast accuracy and quota coverage by tenure become the two that carry the review, and definition stability starts mattering because there is now history worth comparing against.
What does not change with size is the order of the work. Definitions before data, data before wiring, wiring before tooling, and every reported rate carrying its population. Tooling bought ahead of that order inherits every defect underneath it and presents them with more authority than a spreadsheet would. The clearest tell that the order has been skipped is a confident forecast that nobody can reconcile back to a source system.
Choosing tools before that order is fixed often comes down to a layer mismatch, which the five distinct jobs of sales operations software breaks apart clearly.
A sales operations metrics dashboard is that same set under one extra constraint: it has to be readable without its author standing next to it. In practice that means every tile carries its denominator beside the rate, the period is printed rather than assumed, and any metric nobody has agreed a decision for comes off rather than staying on for completeness.
Where our own outbound sits inside this
Outbound is the part of the motion this discipline pays off on fastest, because every input is chosen rather than inherited. The segment is a decision, the message is a decision, and the population is reconstructible afterwards only if the definitions held while the campaign ran.
Two things about how we work are worth stating plainly, since this page sits on our site. Meetings we are paid for are qualified against criteria agreed in writing before launch, so the definition exists before any result can be read off it, and budget, timing and authority are never billing conditions. And each campaign carries a single message, with no bumps and no thread replies, so a later approach to the same audience is a separate campaign with its own premise and its own counting. The operational consequence is that attribution needs no untangling: a reply belongs to one campaign with one stated reason for contact. What qualified has to mean when money depends on it covers how that definition gets agreed, and the SDR manager role covers who owns the input side of the same numbers on the team side.
The short version

Sales operations key performance indicators measure the system rather than the sellers. Six carry most of the load: forecast accuracy with the direction of the miss, field completeness on segment-critical fields, routing latency, dated definition changes, quota coverage split by tenure, and the time it takes to answer a reconciliation question.
Filter every candidate with four tests, of which the strictest is that a movement should have one plausible cause. Print the input count beside every rate, and treat an unnamed denominator as a failed check rather than a passing one. Expect each figure to be gamed by an honest person under pressure, and pair it with the companion that exposes the shortcut.
Where the reconciliation shows the constraint is the number of qualified conversations rather than the reporting around them, that is the half we run: see what a first campaign produces.
Frequently asked questions.
Frequently asked questions- What is the difference between sales operations KPIs and sales KPIs?
- Sales KPIs describe the outcome of a selling motion, so they move when selling changes. Sales operations KPIs describe the machine that motion runs on: the shared definitions, the data the segment queries hit, the routing rules and the reliability of the forecast. Operations reports both sets, and only the second one measures its own work.
- What is a good forecast accuracy target?
- Published targets travel badly, because accuracy depends on deal count, cycle length and how the submitted number is defined. The more useful reading is the direction and stability of the miss over several periods. A team consistently under by a similar margin can be calibrated. A team alternating between over and under has a definition problem underneath the forecast.
- How do you measure CRM data quality without a data team?
- Narrow it to the fields your segment queries actually filter on, then report the share of records carrying a usable value in each one, with the record count printed beside the share. That is a spreadsheet-sized job, it points directly at a repair, and it avoids the overall health score that no one can act on.
- Which sales operations KPIs matter at the first operations hire?
- Field completeness on a handful of segment-critical fields, routing latency, and how long it takes to answer a reconciliation question such as how many opportunities came from outbound last quarter. Forecast accuracy is not yet meaningful, because a handful of deals per period produces a figure that swings on one outcome.
About the author.

B2B cold email experts helping companies generate qualified leads through done-for-you outreach campaigns.
RevenueFlow Team
Explore more.
Ready to scale your outreach?
We build GTM engines that book real meetings. See the receipts.
Related articles.
MEDDIC vs BANT: What Each Qualifies and When to Use Which
MEDDIC and BANT from the originators' own text: IBM's BANT form as a gate after the first call, PTC's six themes as an audit of a live deal, and when to run each.
Win Rate Benchmarks: Which Figures State a Population
A catalogue of the published average sales win rates, sorted by whether the page names the population behind its own number. Most do not.
SDR Outsourcing for Logistics Companies: The Brokerage Line
What an outside sales development team may do in a freight company's name, the calling and email rules it inherits, and which arrangement survives a bid-shaped market.
LinkedIn Outreach for Banks: A Regulated Message
How a bank's relationship managers use LinkedIn to reach business owners: what the FFIEC guidance, FINRA's notices and LinkedIn's own rules require, and where to stop.
LinkedIn Lead Generation for Financial Services Firms
A LinkedIn message from a regulated firm is a communication the rulebook already defines, and the definition turns on how many people receive it within thirty days.
SDR Outsourcing for Business Brokers: The Fee Timing
Whether a success-fee brokerage should rent sales development at all: the fee timing, the texts that limit what an outside person may say about value, and who signs.